
|
|
1.IntroductionEver since the first descriptions of identified neurons by Camillo Golgi,1 Santagio Ramon y Cajal,2 and other pioneers in the field of modern neuroscience, morphometric data of identified neurons have contributed to our understanding of the nervous system. In recent years, morphometric analysis has gained in importance due to a series of exciting developments in the field of light microscopy,3–6 the generation of genetically engineered mice expressing fluorescent proteins,7 and modern computational approaches, which bring together complex morphological and functional data.8–10 Accordingly, neuroscientists are confronted with the need to analyze neuronal structures and to extract morphometric information from huge datasets of single- or multi-photon image stacks. Image stacks acquired with the help of laser-scanning microscopes often suffer from limited resolution and sometimes low signal-to-noise ratio, in part due to physical limitations. Therefore, we aimed at developing a software that supports the investigator in analyzing these datasets by providing automatic and manual tools integrated in a graphical user interface (GUI). This attempt resulted in a lightweight and easy to use software, operating even on average portable computers, which significantly accelerates morphometric analysis. We named this novel tool SpineLab. SpineLab is based on the NeuRA filter.11–13 In the present study we validate the ability of SpineLab to reconstruct the dendritic tree of identified GFP-expressing neurons as well as its capability in identifying individual dendritic spines. Interestingly, a rather simple approach for automatic processing, not requiring computer processors with high power, proved to be sufficient to accelerate cell morphology reconstruction. Moreover, we demonstrate that this automatic approach is capable of detecting changes in spine density, when time-lapse imaging datasets are analyzed. Accordingly, SpineLab proves to be a valid and highly suitable software tool that significantly accelerates the morphometric analysis and three-dimensional (3-D) rendering of identified neurons. 2.Materials and Methods2.1.Acquisition of Confocal Image StacksThe datasets used in the present study were in part published previously in a different context.14 Images were acquired with an upright Zeiss LSM Pascal confocal microscope. Dendritic trees were visualized using a 40x water immersion objective lens (0.9NA, Zeiss). A 63x water immersion objective lens (0.95NA; Zeiss) at 4x scan zoom was used to image individual dendritic segments at high resolution. Up to 40 images were recorded per stack (, and ; -steps: 3 μm and 0.5 μm respectively; Videos 1 and 2). 2.2.Manual QuantificationsTo verify the capability and correctness of the SpineLab tool to reconstruct neuronal dendritic branching and spines, four model cells were generated using NeuGen,15 transferred to a volume image using NeuRA2,16 and reconstructed with SpineLab, Neurolucida software 10.0,17 and Neuronstudio 0.9.92 (CNIC Mount Sinai School of Medicine, NY18) (Fig. 1). In addition, a dendritic segment containing spines was generated using the above-mentioned method. These datasets were analyzed by independent investigators (Gerlind Schuldt and Nadine Zahn). Fig. 1Validation of SpineLab reconstruction using model neurons: (a) volumetric projection of a model neuron generated with NeuGen 15 and NeuRA2;16 (b) reconstruction of the model neuron with SpineLab; (c) total dendritic branch length of model neurons reconstructed by SpineLab, Neurolucida, and Neuronstudio. Values in μm; SEM, standard error of the mean.  The dendritic tree of individual GFP-expressing dentate granule cells19,20 was manually reconstructed using Neurolucida and Neuronstudio. Confocal image stacks of individual dendrites at higher magnification containing dendritic spines were assessed manually on 3-D image stacks of dendritic segments using the Zeiss LSM image browser to navigate through the stacks, as previously described.14,21,22 All dendritic protrusions were counted as dendritic spines, regardless of their morphology. Images from control and denervated dentate granule cells14,22 were analyzed blind to experimental condition to ensure unbiased observation. For each segment, a defined distance () from a dendritic branch point was analyzed and all spines were counted (red dots in Video 2). The spine density per μm was calculated based on these results. All results were compared with partially automatic reconstructions by the same independent investigators using SpineLab. 2.3.SpineLab Software ToolSpineLab is based on the morphology reconstruction software NeuRA2,16 which is an optimized and extended version of the award-winning Neuron Reconstruction Algorithm NeuRA.11–13 SpineLab was developed for an automatic or partially automatic extraction of 3-D data, such as morphometric data of neurons, from image stacks suffering from reduced -resolution. SpineLab combines simple noise reducing and segmentation operators, like median-filtering or global segmentation,23 as well as the inertia based anisotropic diffusion filter, introduced in Refs. 11–13, together with the possibility to extract centerlines, using Telea’s Augmented Fast Marching Method.24 SpineLab enables the user to modify the reconstruction manually via a highly developed graphical user interface. It was written in C++, using the Qt-GUI-Framework,25 and is therefore available for Mac, Linux, and Windows systems. All methods integrated in SpineLab are implemented highly optimized, yielding a software tool, which requires few resources and runs reliably and fast on today’s computers. 2.4.Pre-Processing of Three-Dimensional Image StacksIn a first pre-processing step, SpineLab applies a median filter23 with a small neighborhood size to all original images in order to reduce noise. Thereafter, the image stacks are projected along the -axis using the maximum norm where denotes the image stack, depending on the 3-D coordinates and denotes the projected image, depending on the two-dimensional (2-D) coordinates .2.5.Generation of Neuronal Feature SkeletonsThe projected image stacks [Fig. 2(a)] are segmented [Fig. 2(b), for details see Ref. 23] and the centerlines of the segmented regions are extracted using Telea’s Augmented Fast Marching Method24 [Fig. 2(c)], which collapses the boundaries of the segmented image parts. The centerlines are subsequently transformed into the so called neuronal feature skeleton—a graph26 consisting of nodes and edges linking the nodes [Fig. 2(d)]. To obtain the feature skeleton from the centerline, every pixel belonging to the centerline is considered to be a skeleton node. The nodes belonging to adjacent pixels are linked with edges. Nodes with one or three neighbors represent end points of spines and dendrites or branching points, respectively. Nodes with exactly two neighbors are important to approximate the curvature of dendrites or spines. However, a subset of these nodes can be removed if the angle between the two adjacent edges is large (i.e., ). This simplification yields a neuronal feature skeleton, which consists of a reasonable number of nodes [Fig. 2(e)]. This feature skeleton is 2-D, since the original image stack was projected along the -axis. In a final step, the -coordinate of every skeleton node is therefore calculated as the center of mass along the -axis of the pre-processed image stack . This yields a 3-D skeletal representation of neurons or dendrites with spines of interest—the so called neuronal feature skeleton.Fig. 2Reconstruction of GFP-labeled neurons using SpineLab: (a) through (d) Projected image stacks of a GFP-expressing dentate granule cell; (b) Segmentation using a threshold method in SpineLab’s graphical user interface; (c) Using Telea’s Augmented Fast Marching Method the centerlines of the segmented region are generated; (d) The centerlines of the regions of interest are selected by rolling over with the mouse. Scale bars: 10 μm; (e) To ease separation and to confirm correct reconstruction of individual neurons, SpineLab offers a real-time -plane view, in which the investigator can correct the precise position of the centerline in all spatial directions. The blue squares denote the skeleton nodes whereas the green lines denote the skeleton edges. The eight labeled nodes are arbitrarily chosen to highlight the -plane view. Scale bars 2 μm; (f) The dendrogram of the reconstructed neuron. Different colors indicate different branch orders; (g) Examples of values computed by SpineLab. The particular branches and angles are shown in Fig. 2(f). (Video 1 QuickTime, 2.8 MB) [URL: http://dx.doi.org/10.1117/1.JBO.17.7.076007.1]. 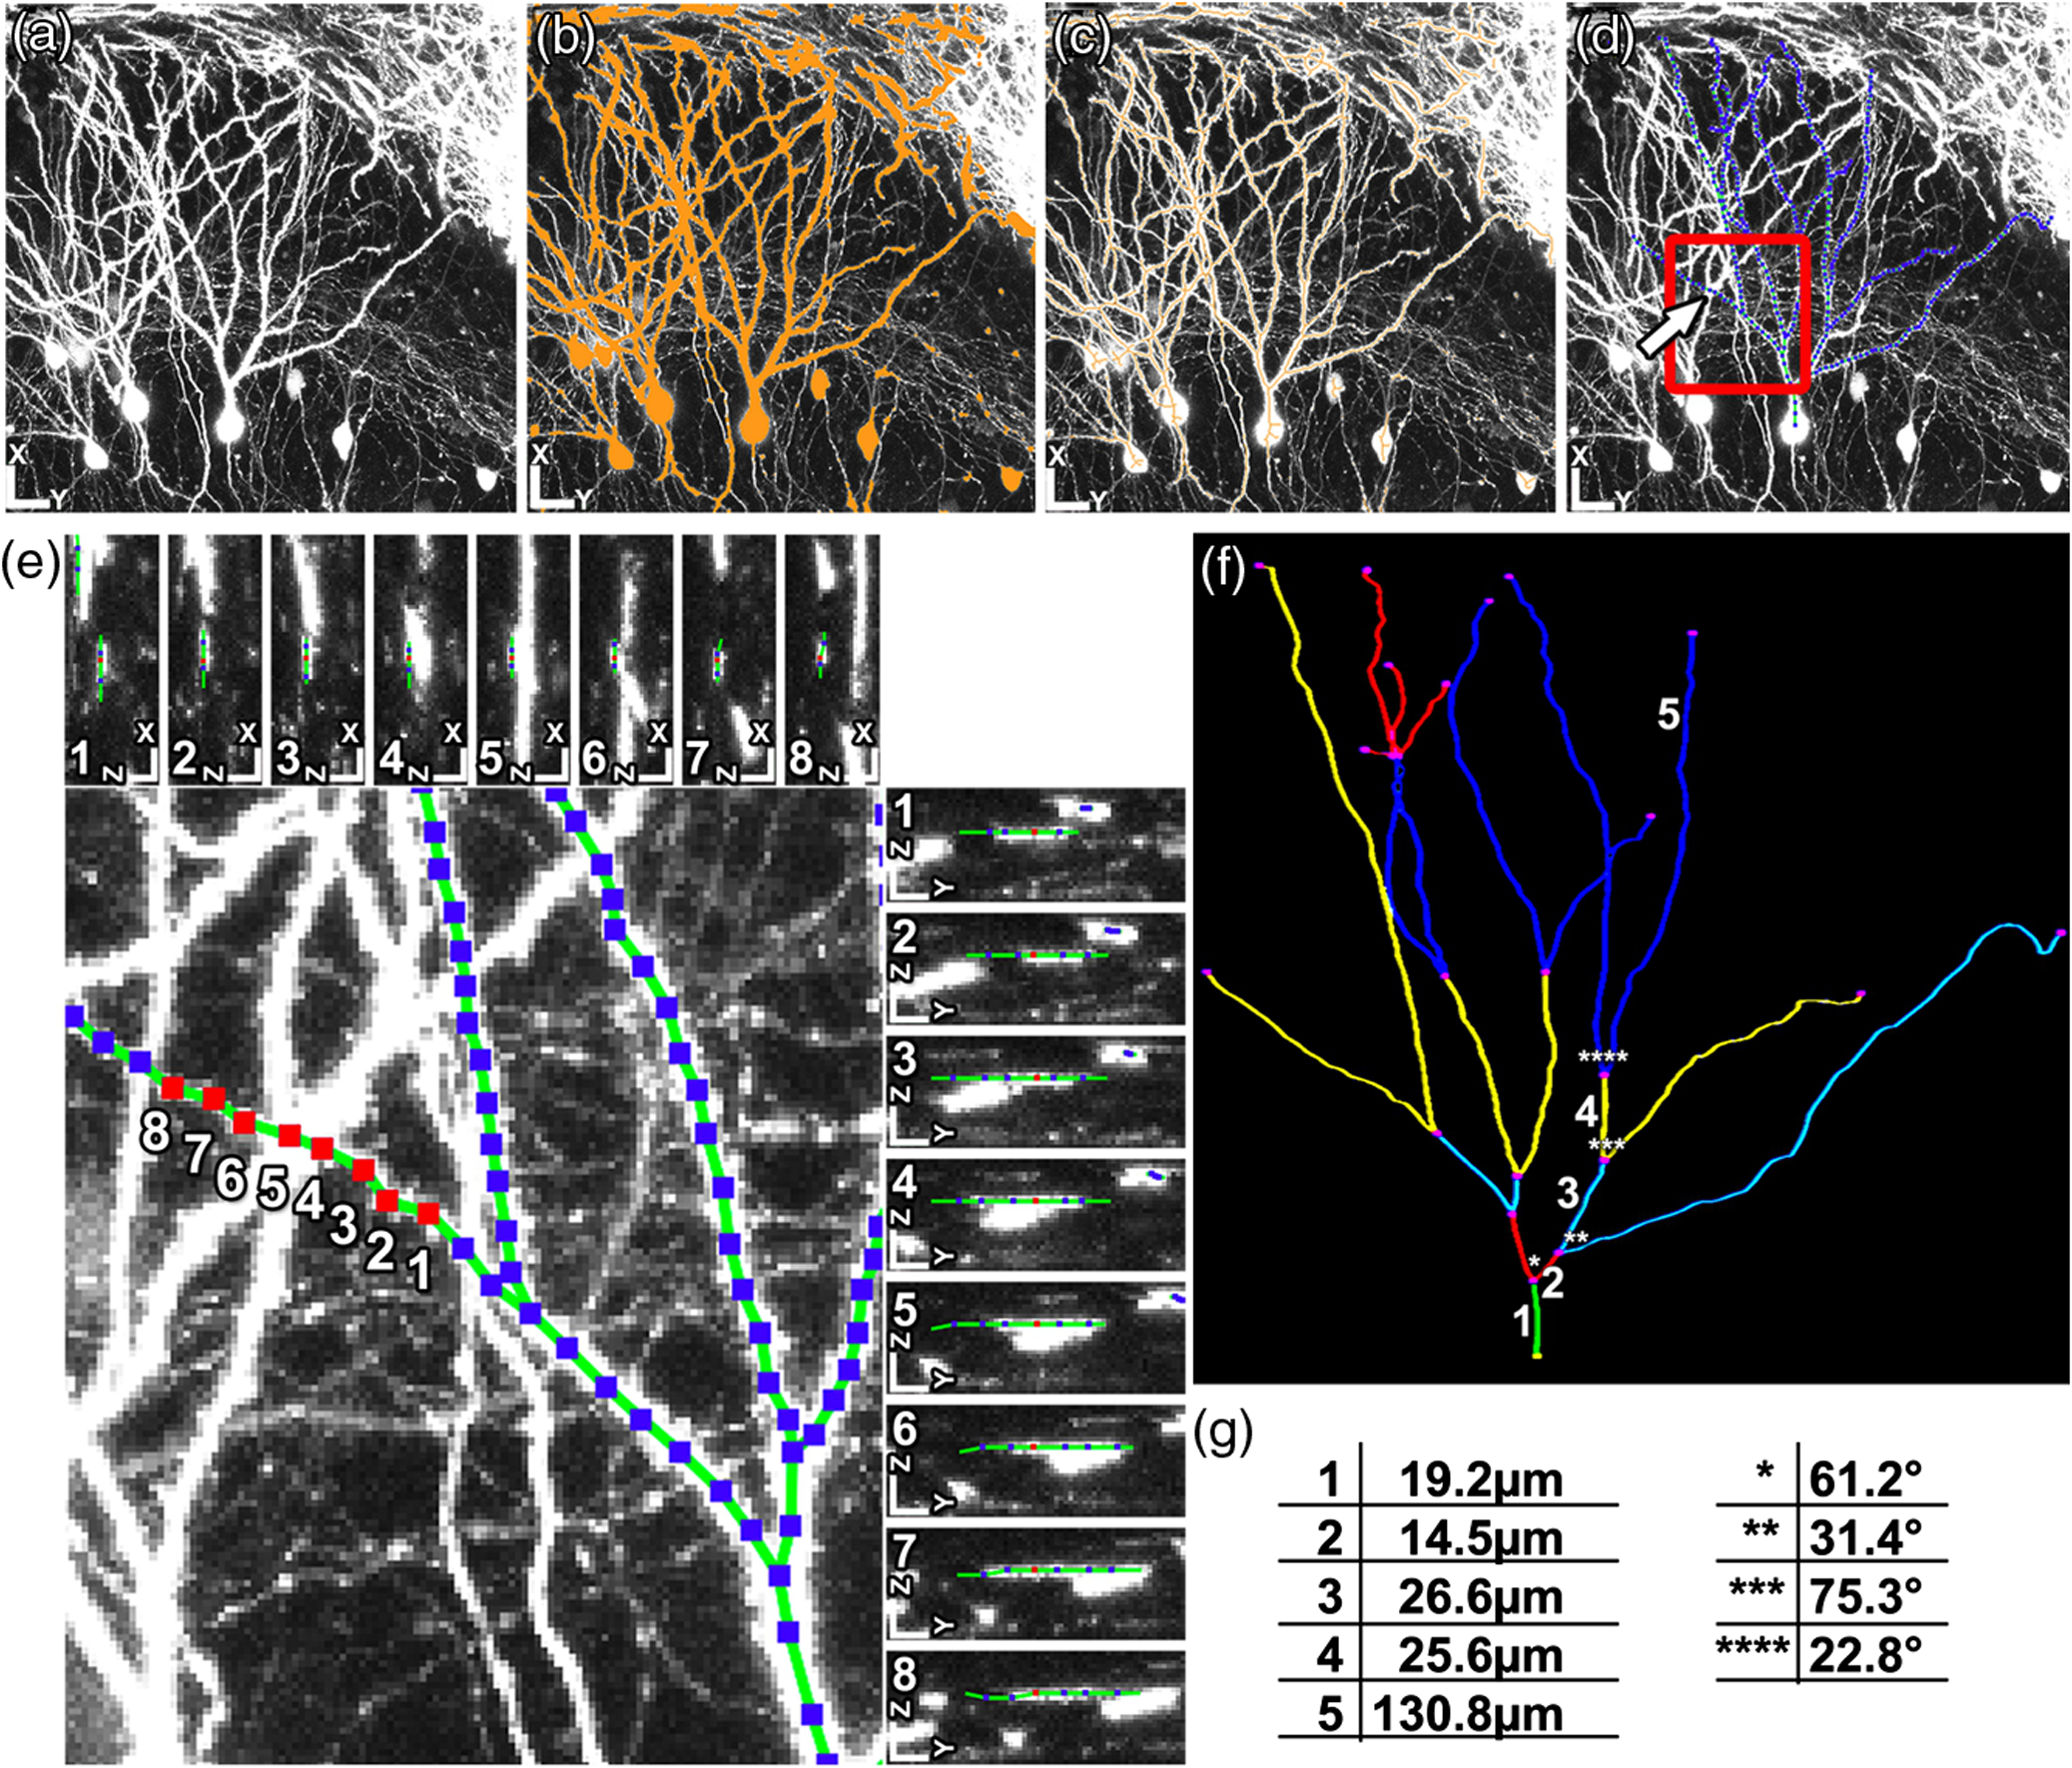 2.6.Analyzing the Neuronal Feature SkeletonThe neuronal feature skeleton can be used to extract additional information from imaging datasets—in particular spine length and spine volume. To obtain this information, the feature skeleton G is defined as a special graph with following attributes: (1) G is connected and contains no cycles (i.e., G is a tree26); (2) G is weighted,26 and the weights symbolize the real length in micrometers (i.e., every edge of the graph is attributed with its real length); (3) one path of G (usually the longest path in the graph) represents the dendrite; (4) branches connected to the dendrite represent single spines. Spines in -direction were not included in this analysis. The volume of single spines can only be calculated if they are oriented in the - and -axes. Spines are cut away from the dendrite on the image level and reconstructed via the Neuron Reconstruction Algorithm NeuRA11–13 in the version NeuRA2,16 where the originally used Marching-Tetrahedron mesh generator27 was replaced by the faster Marching-Cubes-Algorithm.28 The volume of these spines can easily be calculated by using Gauss’ divergence theorem.29 3.ResultsIn the present study, model neurons generated with NeuGen,15 as well as the dendritic arbor of cultured dentate granule cells of entorhino-hippocampal slice cultures prepared from Thy1-GFP mice,7 were reconstructed (Figs. 1Fig. 2–3). In addition individual dendritic segments were evaluated at high magnification (Figs. 4Fig. 5–6) to test and validate handling and accuracy of the newly developed reconstruction software SpineLab. Fig. 3Validation of SpineLab reconstruction of GFP-labeled neurons with Neurolucida and Neuronstudio: Five individual GFP-expressing dentate granule cells of entorhino-hippocampal slice cultures14 were reconstructed using SpineLab, Neurolucida, and Neuronstudio software to validate the newly developed software tool. The results revealed comparable total dendritic branch length values. No significant differences were detected between the three software tools. The observed differences were within re-test reliability [SpineLab (1) versus SpineLab (2)]. Values in μm, SEM, standard error of the mean.  Fig. 4Reconstruction of individual dendritic segments and dendritic spines: (a) Projected image of an individual dendritic segment of a dentate granule cell in the outer molecular layer. Note numerous dendritic spines extending from the dendrite. Scale bar 2 μm. (b) Segmentation using the threshold method and calculation of the centerline. (c) SpineLab identifies individual dendritic spines (spines, purple lines; dendrite, yellow line; feature skeleton nodes, blue squares). Green asterisks indicate spines that were not detected, e.g., due to “optical fusion” in the 2-D-projected image. (d) Spinogram of the reconstructed dendritic segment (lengths in μm).  Fig. 5SpineLab detects changes in spine density: (a) and (b) The spine density of ten dendritic segments (five segments imaged twice, at 0d and 7d) was assessed manually and compared to the automatic detection-step of the SpineLab-software. While SpineLab was only capable of detecting of spines in comparison to a manual analysis in three dimensions it showed robust results when changes in spine density were compared to values of manual reconstruction. (Video 2 QuickTime, 1.9 MB) [URL: http://dx.doi.org/10.1117/1.JBO.17.7.076007.2].  Fig. 63-D surface rendering of dendritic spines: (a) Individual spines can be processed by SpineLab using three-dimensional surface rendering. Projected image of the dendritic segment shown in Fig. 4. Scale bar 2 μm. (b) The spine indicated in (a) by an arrow is shown after 3-D surface rendering from two sides. (c) Additional examples of spines indicated in (a) by numbers. SpineLab can extract information about the length and volume of spines.  3.1.SpineLabOne of the central problems in cell morphology reconstruction using transgenic mouse lines, which express fluorescent markers for visualization of neuronal morphology, is the fact that single- or multi-photon image stacks usually contain several cells, one of which should be reconstructed (Fig. 2, Video 1). This is one of the major problems automatic software-based reconstructions face. SpineLab is a lightweight (e.g., only 15 MB of hard disk space and low memory resources required) and easy to handle software for partially automatic cell reconstructions, which supports investigators with a set of automatic tools to identify and reconstruct neuronal morphology. All necessary parameters for noise reduction, segmentation, and centerline-extraction can be adjusted in real-time by the operator. 3.2.Reconstruction of Dendritic Trees Using SpineLabWe have used SpineLab to reconstruct the morphology of the dendritic trees of individual cultured GFP-expressing neurons (Fig. 2). After applying a median filter,23 the image stacks were projected along the -axis using the maximum norm [Fig. 2(a); see Sec. 2] and segmented using a threshold method, which is reasonable, since the data resolution in -direction is low compared with the horizontal resolution; every pixel of the projected image with a higher intensity than the selected threshold is colored orange and every pixel with a lower intensity than the selected threshold is colored black,23 as shown in Fig. 2(b). The centerline of the segmented region [Fig. 2(c)] was then extracted by using Telea’s Augmented Fast Marching Method,24 which generates centerlines from segmented 2-D images by collapsing the boundaries of the segmented parts. Parts, which belong to the cell of interest, can be selected by the investigator by defining regions of interest with the computer mouse [Fig. 2(d)]. In addition, SpineLab provides a real-time -plane view supporting separation and precise position of centerlines, and therefore the identification and separation of individual dendritic branches belonging to different neurons [Fig. 2(e)]. The resulting 3-D neuronal feature skeleton is a tree in the sense of graph theory, which means it is a connected graph without cycles,26 for which the root denotes the soma. This enables the visualization of the reconstructed dendritic tree as a dendrogram [Fig. 2(f)] and subsequent assessment of various morphometric parameters of interest. Starting at the soma, the lengths and orders of the dendritic branches and the angles between branches emerging from identified branching points can be automatically computed [Fig. 2(g)]. Using this approach, a trained investigator can reconstruct individual cultured dentate granule cells within , i.e., an approximate total dendritic length of 1000 μm. 3.3.Validation of Dendrite Reconstruction Using SpineLabWe validated the reliability and accuracy of SpineLab in dendritic reconstruction in two steps: First, model neurons with known dimensions were generated using NeuGen15 [Fig. 1(a)] and reconstructed with SpineLab [Fig. 1(b)], Neurolucida17 and Neuronstudio18 software. Second, we compared the results of SpineLab reconstructions of GFP-expressing neurons with the results of Neurolucida and Neuronstudio. We observed differences of while reconstructing model cells [Fig. 1(c)] and differences of between the reconstructions of GFP-labeled neurons done with SpineLab compared to Neuronstudio and Neurolucida software (Fig. 3). Taken together, we conclude that SpineLab is a reliable tool to determine dendritic branch lengths in 3-D image stacks, especially since SpineLab yielded accurate results in reconstructing the model neurons (which was also the case for Neurolucida and Neuronstudio-software). 3.4.Reconstruction of Identified Dendritic Segments and Dendritic SpinesNext we assessed the ability of SpineLab to reconstruct and trace dendritic spines. In particular, we were interested in evaluating how many of the present dendritic spines could be automatically identified (Fig. 4). To obtain the neuronal feature skeleton from the projected image [Fig. 4(a)], the same approach was used as in the case of reconstructions of the entire dendritic tree of neurons: A centerline of the projected image was calculated and transformed to the neuronal feature skeleton, as described (see Sec. 2). The longest path of the resulting feature skeleton is marked as dendrite, which is correct for most images and can be changed by the operator if necessary [Fig. 4(c)]. The endpoints of the spines are detected reliably by the automatic approach of SpineLab, whereas the startpoints of the spines have to be corrected manually in most cases. The reconstruction of each dendritic segment can be saved as a spinogram [Fig. 4(d)]. 3.5.Spine Density Analysis Using SpineLabSince dendritic spines, especially the neck of spines, are close to and in part beyond the resolution of confocal microscopy, the reconstruction algorithm described above did not detect all spines. To improve the automatic analysis, disconnected skeleton parts, which are often spine heads, were automatically connected to the dendrite by adding the shortest edge, which connects the dendrite and the spine head. Nevertheless, due to low resolution in -direction, spines oriented in the -axis, were detected only occasionally. We believe that this reflects the rather low detection rate of () using the initial automatic approach in comparison to manual assessment of all spines in three-dimensions [Fig. 5(a); Video 2]. Regardless of these limitations, SpineLab significantly accelerated the analysis of spine densities since a considerable fraction of spines were readily identified and marked by the automatic approach of the software. 3.6.Spine Density Changes Using SpineLabIt has been suggested in a consensus paper by several labs that only spines exceeding the dendrite laterally should be analyzed in order to minimize errors, due to the low -resolution of the image stacks.30 In fact, the reliability of SpineLab to detect the subset of lateral spines in dentate granule cells was considerably higher [; Fig. 4(c)], in comparison to detecting spines in all three dimensions (Fig. 5). In order to base the analysis of lateral spines on objective criteria, a function was included, which enables setting a lateral angle in which all spines will be considered. Using this specification, we reasoned that the reliability of assessment of changes in spine density by SpineLab should be particularly high if the same dendritic segment is visualized repeatedly. Thus SpineLab should be able to detect changes of spine density without the need of time-consuming and laborious post-hoc manual corrections. To test this hypothesis, dendritic segments of untreated controls and partially denervated dentate granule cells were analyzed.14,22 In this earlier studies we were able to demonstrate that denervation leads to a reduction in spine densities of about 30% to 40% at seven days post-lesion. Indeed, the automatic pre-processing approach of SpineLab reliably detected these changes in spine density [; in comparison to manual assessment; Fig. 5(b)]. Accordingly, we were able to confirm our previous result on denervation-induced changes in spine density using an objective computer-based approach, i.e., the SpineLab software. Taken together, we conclude that while automatic spine detection of SpineLab fails to identify all dendritic spines and requires manual correction, it identifies a considerable portion of all spines, in particular lateral spines,30 and thus appears suitable for detecting relative changes in spine density. This makes SpineLab an attractive tool for screening huge time-lapse imaging datasets for spine density changes in a rather short period of time, specifically compared with manual assessments. In case a difference is detected, a manual post-hoc analysis could be performed to verify these results. 3.7.Spine Length and Spine Volume AnalysisOne of the major advantages of SpineLab reconstruction is that the neuronal feature skeleton can be used to extract additional information from imaging datasets. In particular spine length and spine volume are considered important functional features of dendritic spines (for a recent review on spines and their function see Ref. 31). SpineLab automatically measures the length of spines and provides a function for volume calculation of selected spines. In Fig. 6(b) the surface reconstruction, on which the volume calculation is based on (for details see Sec. 2) is shown for some spines. Naturally, these extracted values are limited by the resolution of the confocal laser scanning microscope. However, their automated extraction again provides the opportunity to use this approach to assess relative changes in spine length and spine volume of large numbers of spines under various experimental conditions, as long as the same dendritic segment is imaged with the same parameters at the same microscope. 3.8.Validation of Spine ReconstructionTo provide further evidence for the accuracy of SpineLab to detect dendritic spines, we generated and reconstructed a model dendritic segment studded with 57 equally distributed spines. The automatic approach detected the dendrite () and of the spines correctly. As expected, spines oriented in -direction were not detected. After manual correction, all spines were reconstructed correctly with an average error of per spine. These results show that SpineLab is a suitable tool to accelerate detection and analysis of dendritic spines. 4.DiscussionIn the present study we have introduced a novel partially automatic software tool, named SpineLab. We report that: (1) SpineLab is a lightweight and easy to use program that enables investigators to adjust all necessary parameters of image pre-processing and automated detection in real-time. (2) SpineLab facilitates the reconstruction of neurons by combining automatic and manual approaches. (3) We validate the ability of SpineLab to facilitate assessment of dendritic arbors of identified fluorescent neurons in confocal image stacks. (4) Furthermore, we demonstrate that SpineLab is capable of detecting dendritic spines, in particular lateral spines,30 and determining changes in spine density in time-lapse imaging datasets. Taken together, we conclude that SpineLab complements the available software tools of neural morphology reconstruction and will therefore be of value for the neuroscience community. The importance of valid, reliable, and fast reconstruction and assessment of neural morphology is reflected in the fact that a series of tools is available on the market in both commercial as well as freeware versions. Such tools sometimes claim a fully automated detection or reconstruction of morphology information at high accuracy. If the best images available are used to assess the capability of such software, this may indeed be true. However, typical experimental data does not consist of ideal images (e.g., such as in the case of the model cells used in the present study), which resides in part also in physical limitations of the imaging techniques (e.g., visualization of structures below the diffraction limit such as the neck of dendritic spines). We therefore developed a lightweight and easy to use software tool with low hardware requirements (even running on average portable computers), which supports investigators in assessing neural morphology by pre-processing and automatically detecting at least parts of the structures of interest. An important aspect of this approach is the real-time adjustment of parameters for automated detection. This feedback mechanism ensures low failure rates since the investigator gets a visual feedback while adjusting the parameters to get ideal results in the first step of automatic reconstruction. The value of such an approach has been recognized by many other groups and companies and has been implemented in the latest versions of their reconstruction tools (e.g., latest version of IMARIS 3D, Bitplane). Novel software tools need to be validated. We have, therefore, analyzed the ability of SpineLab to reconstruct the entire dendritic tree of model neurons and have compared SpineLab reconstructions of identified GFP-expressing granule cells with reconstruction results of the same neurons obtained with Neurolucida and Neuronstudio software. The analysis revealed comparable results with the expected small deviations. Thus, SpineLab is a valid and reliable tool to reconstruct and assess the morphology of dendritic trees. The automatic approach of SpineLab was able to detect of all dendritic spines on a given dendritic segment imaged at high resolution in our time-lapse imaging datasets. This may reside, at least in part, in the fact that live cell imaging has to take phototoxic damage into account and thus signal-to-noise ratio and -resolution will be lower in comparison with images taken from fixed tissue mounted in antifading medium and imaged with oil immersion objectives. This will inevitably lead to a lower detection rate of spines specifically in -direction. In fact, it has been recognized that even under “ideal imaging conditions” the limited resolution in -dimension can be problematic with respect to spine analysis. It has been therefore proposed in a consensus paper by several labs that only lateral spines, i.e., spines in -direction, should be analyzed.30 Indeed the ability of SpineLab to detect these spines in our datasets was high () and failed primarily in cases where optical fusion of neighboring spines occured in the 2-D-projected images. In line with the high rate of detection of lateral spines, we were able to demonstrate that the automatic spine detection approach of SpineLab is capable of detecting relative changes in spine density in time-lapse imaging datasets. This is an important result as it will facilitate the analysis of large datasets for changes in spine density in a considerably short period of time. Given the fact that organotypic slice cultures are a highly versatile and widely used in vitro model,32,33 we are confident that the usage of single- or multi-photon imaging techniques in combination with SpineLab will significantly accelerate assessment of spine density changes under various experimental conditions of interest. This may in particular be interesting for high-throughput approaches such as screening for drugs that could be aimed at affecting spine densities in neuronal networks. It may be important to mention that the SpineLab reconstructions can be exported to the svc-file format. This is in particular of value, since SpineLab is primarily focused on extracting the neuronal feature skeletons but not in further detailed analysis of the respective spino- or dendrograms. Thus feature skeletons obtained with SpineLab can easily be transfered to other software tools for further analysis and computational modeling, e.g., to the TREES Toolbox8 or the simulation environment NEURON.34 Finally, SpineLab is capable of rendering individual spines in three dimensions. This feature of SpineLab enables investigators to assess relative changes in the volume of spines, as long as the same parameters are used when imaging identified dendritic spines repeatedly. However, due to technical reasons residing in the imaging approach itself, this is currently only possible for spines oriented in - and -directions.30 Conventional single- and multi-photon microscopes do not yield correct absolute volumetric data. The recent development of novel microscopic techniques3,35,36 offers the opportunity to overcome this limitation, since absolute measurements of small () microscopic structures seem to be within reach. It can be expected that SpineLab will yield useful absolute volumetric data if imaging datasets from these microscopes are used. We conclude that SpineLab is a useful and easy to handle tool for the extraction of morphometric data from single- or multi-photon image stacks of neurons. We are confident that it will be of value for the neuroscience community, in particular by accelerating the analysis of spine density changes. AcknowledgmentsWe thank Sergei Wolf from G-CSC Frankfurt for creating the model neurons with NeuGen. The work was supported by a German-Israeli Foundation Grant (GIF G-2239-2096.1/2009), by Deutsche Forschungsgemeinschaft DFG (DE551/10-1;11-1), by BMBF via Bernstein-Group DMSPiN and by Baden-Württemberg-Stiftung via project HPC-12. ReferencesC. Golgi, Sulla fina anatomia degli organi centrali del sistema nervoso, Reggio-Emilia: S. Calderini e Figlio; 1885, Milan: Hoepli; Italy
(1903). Google Scholar
S. Ramon y Cajal, Histology of the Nervous System of Man and Vertebrates, Oxford University Press, UK
(1995). Google Scholar
E. Betziget al.,
“Imaging intracellular fluorescent proteins at nanometer resolution,”
Science, 313
(5793), 1642
–1645
(2006). http://dx.doi.org/10.1126/science.1127344 SCIEAS 0036-8075 Google Scholar
T. A. Klaret al.,
“Fluorescence microscopy with diffraction resolution barrier broken by stimulated emission,”
Proc. Natl. Acad. Sci. USA, 97
(15), 8206
–8210
(2000). http://dx.doi.org/10.1073/pnas.97.15.8206 1091-6490 Google Scholar
S. W. HellJ. Wichmann,
“Breaking the diffraction resolution limit by stimulated emission: stimulated-emission-depletion fluorescence microscopy,”
Opt. Lett., 19
(11), 780
–782
(1994). http://dx.doi.org/10.1364/OL.19.000780 OPLEDP 0146-9592 Google Scholar
M. J. RustM. BatesX. Zhuang,
“Sub-diffraction-limit imaging by stochastic optical reconstruction microscopy (STORM),”
Nat. Methods, 3
(10), 793
–795
(2006). http://dx.doi.org/10.1038/nmeth929 1548-7091 Google Scholar
G. Fenget al.,
“Imaging neuronal subsets in transgenic mice expressing multiple spectral variants of GFP,”
Neuron, 28
(1), 41
–51
(2000). http://dx.doi.org/10.1016/S0896-6273(00)00084-2 NERNET 0896-6273 Google Scholar
H. Cuntzet al.,
“One rule to grow them all: a general theory of neuronal branching and its practical application,”
PLoS Comput. Biol., 6
(8), e1000877
(2010). Google Scholar
M. LondonM. Hausser,
“Dendritic computation,”
Annu. Rev. Neurosci., 28 503
–532
(2005). http://dx.doi.org/10.1146/annurev.neuro.28.061604.135703 ARNSD5 0147-006X Google Scholar
I. SegevM. London,
“Untangling dendrites with quantitative models,”
Science, 290
(5492), 744
–750
(2000). http://dx.doi.org/10.1126/science.290.5492.744 SCIEAS 0036-8075 Google Scholar
P. J. Broseret al., The Neuron Reconstruction Algorithm,
(2011) http://www.neura.org July ). 2011). Google Scholar
P. J. Broseret al.,
“Nonlinear anisotropic diffusion filtering of three-dimensional image data from 2-photon microscopy,”
J. Biomed. Opt., 9 1253
–1264
(2004). http://dx.doi.org/10.1117/1.1806832 Google Scholar
G. Queisseret al.,
“Filtering, reconstruction, and measurement of the geometry of nuclei from hippocampal neurons based on confocal microscopy data,”
J. Biomed. Opt., 13
(1), 014009
(2008). http://dx.doi.org/10.1117/1.2829773 JBOPFO 1083-3668 Google Scholar
C. M. MüllerA. VlachosT. Deller,
“Calcium homeostasis of acutely denervated and lesioned dentate gyrus in organotypic entorhino-hippocampal co-cultures,”
Cell Calcium, 47 242
–252
(2010). http://dx.doi.org/10.1016/j.ceca.2009.12.006 CECADV 0143-4160 Google Scholar
J. P. EberhardA. WannerG. Wittum,
“Neugen: a tool for the generation of realistic morphology of cortical neurons and neural networks in 3D,”
Neurocomputing, 70
(1–3), 327
–342
(2006). http://dx.doi.org/10.1016/j.neucom.2006.01.028 NRCGEO 0925-2312 Google Scholar
D. JungblutG. QueisserG. Wittum,
“Inertia based filtering of high resolution images using a GPU cluster,”
Comp. Vis. Sci., 14
(4), 181
–186
(2011). Google Scholar
Bioscience mbf: “Neurolucida—advanced software for neuron reconstruction, 3D mapping, and morphometry,”
(2011) http://www.mbfbioscience.com/neurolucida/ July ). 2011). Google Scholar
S. L. Wearneet al.,
“New techniques for imaging, digitization and analysis of three-dimensional neural morphology on multiple scales,”
Neuroscience, 136
(3), 661
–680
(2005). Google Scholar
M. Vuksicet al.,
“3D-reconstruction and functional properties of GFP-positive and GFP-negative granule cells in the fascia dentata of the thy1-GFP mouse,”
Hippocampus, 18
(4), 364
–375
(2008). http://dx.doi.org/10.1002/(ISSN)1098-1063 35LUAN 1050-9631 Google Scholar
M. Vuksicet al.,
“Unilateral entorhinal denervation leads to long-lasting dendritic alterations of mouse hippocampal granule cells,”
Exp. Neurol., 230
(2), 176
–185
(2011). Google Scholar
A. Vlachoset al.,
“Synaptopodin regulates plasticity of dendritic spines in hippocampal neurons,”
J. Neurosci., 29
(4), 1017
–1033
(2009). JNNUEF Google Scholar
A. Vlachoset al.,
“Time-lapse imaging of granule cells in mouse entorhinohippocampal slice cultures reveals changes in spine stability after entorhinal denervation,”
J. Comp. Neurol., 520
(9), 1891
–1902
(2012). http://dx.doi.org/10.1002/cne.23017 JCNEAM 0021-9967 Google Scholar
B. Jaehne, Digital Image Processing, 6th ed.Springer, Berlin, Germany
(2005). Google Scholar
A. TeleaJ. van Wijk,
“An augmented fast marching method for computing skeletons and centerlines,”
in Joint Eurographics IEEE TCVG Symposium on Visualization,
(2002). Google Scholar
J. BlanchetteM. Summerfield, C++ GUI Programming with Qt 4., Prentice Hall International(2006). Google Scholar
R. J. Wilson, Introduction to Graph Theory, 4th ed.Prentice Hall Inc., New Jersey, USA
(1996). Google Scholar
G. M. TreeceR. W. PragerA. H. Gee,
“Regularised marching tetrahedra: improved iso-surface extraction,”
Comput. Graph., 23
(4), 583
–598
(1998). COGRD2 Google Scholar
W. E. LorensenH. E. Cline,
“Marching cubes: a high resolution 3d surface construction algorithm,”
Comput. Graph., 21
(4), 163
–169
(1987). Google Scholar
D. Eberly, Polyhedral Mass Properties,
(2011) http://www.geometrictools.com/ July ). 2011). Google Scholar
A. Holtmaatet al.,
“Long-term, high-resolution imaging in the mouse neocortex through a chronic cranial window,”
Nat. Protoc., 4
(8), 1128
–1144
(2009). http://dx.doi.org/10.1038/nprot.2009.89 NPARDW 1750-2799 Google Scholar
M. Segal,
“Dendritic spines, synaptic plasticity and neuronal survival: activity shapes dendritic spines to enhance neuronal viability,”
Eur. J. Neurosci., 31
(12), 2178
–2184
(2010). Google Scholar
M. FrotscherS. ZafirovB. Heimrich,
“Development of identified neuronal types and of specific synaptic connections in slice cultures of rat hippocampus,”
Prog. Neurobiol., 45
(6), 143
–164
(1995). Google Scholar
B. H. Gahwileret al.,
“Organotypic slice cultures: a technique has come of age,”
Trends Neurosci., 20
(10), 471
–477
(1997). http://dx.doi.org/10.1016/S0166-2236(97)01122-3 TNSCDR 0166-2236 Google Scholar
M. L. HinesN. T. Carnevale,
“The NEURON simulation environment,”
Neural. Comput., 9
(6), 1179
–1209
(1997). Google Scholar
U. V. Nägerlet al.,
“Live-cell imaging of dendritic spines by STED microscopy,”
Proc. Natl. Acad. Sci. USA, 105 18982
–18987
(2008). Google Scholar
K. I. Williget al.,
“Nanoscale resolution in GFP-based microscopy,”
Nat. Methods, 3
(9), 721
–731
(2006). http://dx.doi.org/10.1038/nmeth922 1548-7091 Google Scholar
|


