|
|
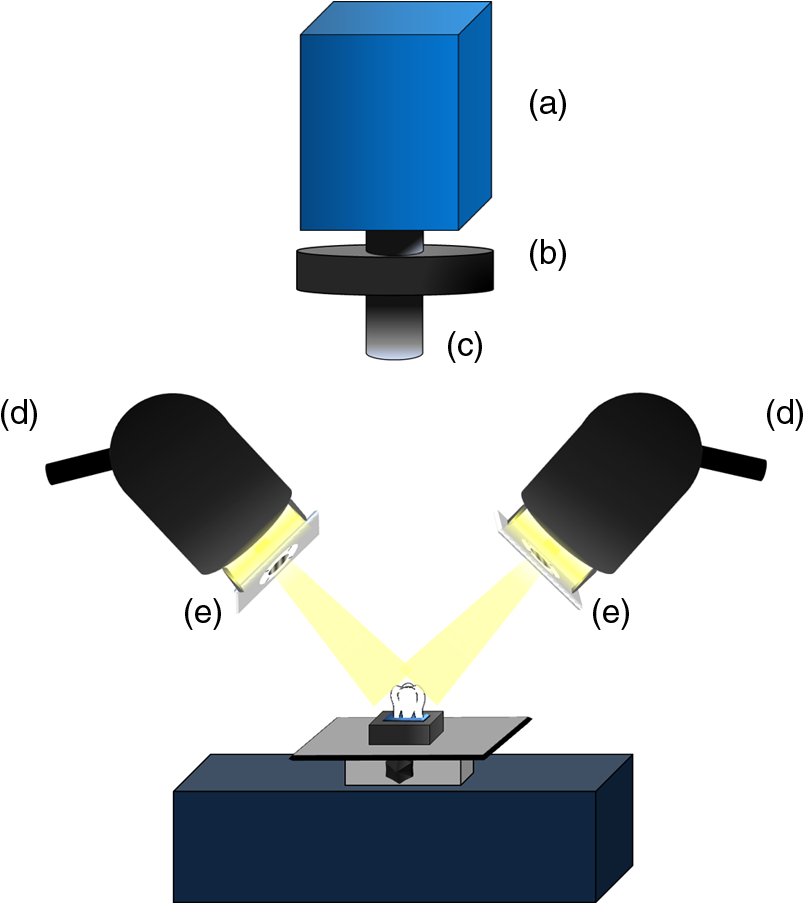
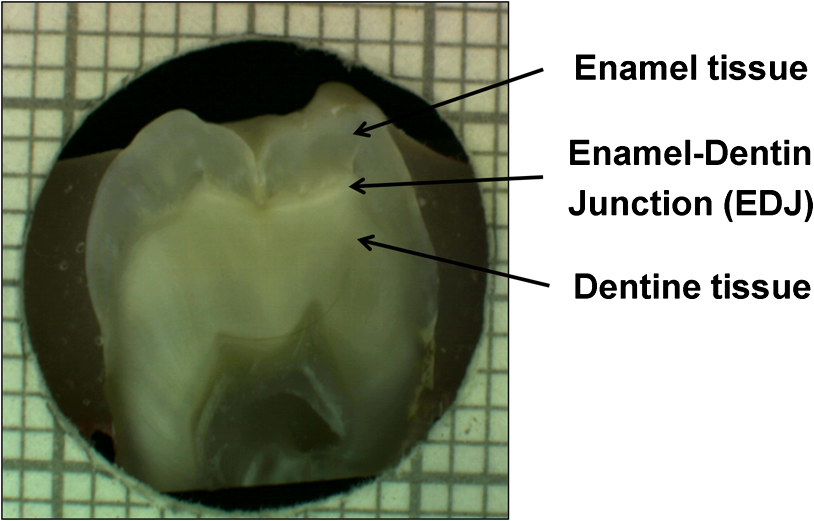
1.IntroductionDespite increased oral hygiene awareness, water fluoridation prevention programs,1 and widespread availability of fluoride,2 dental caries is still one of the most prevalent diseases worldwide, currently affecting 60 to 90% of schoolchildren and the vast majority of adults.3 Dental caries is a dynamic disease manifesting as a demineralization of enamel, causing an increase in surface porosity.4 While confined to enamel, the disease can still be arrested or reversed, and remineralization treatments are available;5 however, if left untreated, it can progress to the underlying dentinal tissue, at which point surgical treatment may be required. Therefore, objective methods for early detection, assessment, and monitoring of the disease are needed to allow the early implementation of therapeutic interventions and to monitor treatment outcomes. The ability to avoid the need for surgical intervention has benefits for both patients and social medicine service budgets.6 Visual inspection is routinely used by dental clinicians to detect and assess caries; however, this is a subjective measure and requires training. Traditional dental radiography is still the most widely used detection aid in dental practice but is inadequate for the detection of incipient demineralization.7–9 Dental radiographs also carry a small risk of inducing malignant change in tissues. While such a risk is minimal, it should be considered against the context of the millions of such radiographs taken and the principle of taking radiographs only when they are of diagnostic benefit. Fiber-optic transillumination methods have been used as detection aids to visualize the internal contrast between sound and decayed regions within teeth,9,10 but these do not allow an absolute quantification of lesions due to the heterogeneous light distribution within the tooth. Caries quantification methods based on electrical tooth impedance measurement11,12 and bacterial fluorescence related to dental caries13,14 have been also reported, but these only provide single point measurements and do not allow visualization of the lesion distribution. Such single point measurements are prone to errors, especially when longitudinally monitoring lesions, as it can be difficult to achieve identical repositioning between patient visits. Imaging methods based on the loss of natural light fluorescence in teeth as a result of light scattering in porous tissue, such as quantitative light fluorescence (QLF),15,16 have shown the ability to detect and quantify lesions. Optical methods are, however, affected by the presence of stain on teeth (especially occlusal surfaces) as it absorbs visible light, and some care is required in the interpretation of images. The use of near-infrared (NIR) wavelengths has been explored as they show little absorption by stain and have a deeper penetration in teeth (the mean free path of the photons being at 1310 and 1550 nm, while under 0.1 mm for visible wavelengths).17–19 NIR transillumination imaging20 has been shown to enhance lesion contrast visualization; in particular, quantification of lesion based on image contrast was used with line profile drawing and pre-knowledge on sound areas. Moreover, 1310-nm (NIR) wavelength optical coherence tomography (OCT) has been investigated as a possible method to measure backscattered light intensity in relation to dental porosity and provide cross-sectional structural information from the surface and sub-surface of teeth.21–23 A recent study has demonstrated that NIR spectral imaging can be used to quantify and map lesion distribution and severity at both enamel and dentin levels.19 Although the results were promising, this was an explorative study using hyperspectral imaging to find characteristic wavelengths for quantitative analysis, which would be impractical for use in the mouth. Moreover, specular reflections associated with tooth morphology impeded detection and cross-polarization has shown to remove their effect.24 The aim of the current study is a) to simplify the optical design of that study and explore NIR cross-polarized multispectral reflectance imaging to remove specular reflections and b) to validate the sensitivity and specificity of the quantitative detection method using a combination of key wavelengths in an in vitro study against a histological reference sample. 2.Materials and Methods2.1.Sample PreparationA set of 112 extracted teeth (premolars and molars) with natural lesions was collected from the Oral Health Centre of the University of Indiana, USA. Soft tissues were removed and thoroughly cleaned at this facility. Each tooth was immediately placed in a solution of distilled water and 0.1% thymol to prevent bacterial growth. Teeth were selected according to their ICDAS score ranging from 0 to 4 with the objective of having all lesion severities from none to the dentin across the sample set, but scores were not included in the analysis. ICDAS is a visual caries-scoring system used to assess lesion severity by dental clinicians.25 2.2.InstrumentationA diagram of the NIR imaging setup is shown in Fig. 1. A near-infrared multispectral imaging system was built using an InGaAs camera (XEVA-FPA-1.7, XenICs), with a spectral response range from 0.9 to 1.7 μm, connected to a computer-controlled filter wheel with six filter positions. An extension tube with a NIR polarizer (Thorlabs NIR Linear Polarizer, 650 to 2000 nm) was mounted in front of the filter wheel. A 60-mm focal length NIR coated lens (Thorlabs AC254-060-C-ML) was used to focus the sample image, and an iris was attached in the front in order to increase the depth of field and reduce aberrations. The filter wheel was fitted with filters in the range from 1050 to 1600 nm, namely 1050, 1250, 1300, 1450, 1550, and 1600 nm. Two broadband halogen lamps emitting visible and NIR light up to 2.5 μm (Osram 300W Halogen lamps) at about 30 deg from the horizontal plane were used for the illumination system and polarizers were mounted in front of each lamp, both cross-polarized with respect to the camera polarizer. This removed specular reflections coming from the surface of the sample. A software application was developed for automatic image capture and filter selection. 2.3.Measurement MethodologyEach tooth was kept in the 0.1% thymol solution at room temperature before imaging. The samples were taken out of their bottles and placed on the sample holder only during measurement to prevent dehydration. Each tooth was placed with its occlusal surface facing the camera at a distance of 15 cm from the lens and air-dried for 15 s at approximately 5 cm to remove moisture from the enamel surface. 2.4.HistologyTooth histology was used as the caries reference standard. It has a direct clinical relevance as it takes into account physiological and structural changes related to the carious disease. A relevant occlusal area with a suspected lesion was selected based on the ICDAS criteria26 by two dentists (J.G./R.E.) and used as a region of interest (ROI) on each tooth. In order to assess lesion severity at the specific point of interest, the individual teeth were mounted in acrylic resin blocks and hemi-sectioned in the bucco-lingual direction through the ROI using a 300-µm-thick diamond wheel saw (South Bay Technology Inc., USA). Color photographs of the hemi-sections were captured with constant illumination and magnification, as shown in Fig. 2. The images of the two hemi-sections obtained for each tooth were scored by two examiners (J.G./I.P.) until agreement was reached and the final score was based on the highest score identified for the ROIs. The score criteria used were for sound, for a lesion up to the outer half of the enamel, for a lesion to the inner half of the enamel, EDJ for a lesion up to the enamel-dentin junction, for a lesion in dentin.19,27 2.5.Image AnalysisImages were pre-processed in order to obtain denoised and calibrated spectral reflectance images. Four reflectance standards at 2, 10, 50, and 99% (Avian Technologies Gray Scale Standards) were captured for each wavelength at the beginning of the study to linearize the camera intensity to reflectance values. Illumination intensity variations were corrected by capturing an image of the 50% reflectance standard before each measurement and compensating for the difference to a baseline reference value. A nonlinear Gaussian filter was applied to denoise the image. The heterogeneity of the illumination spatial distribution was corrected by calculating a spatial distribution factor based on the image obtained from the 50% reflectance standard. Based on a previous study,19 calibrated reflectance spectral images, , at , , and were combined to generate a first functional image to detect the existence of a carious lesion, , and a second functional image to quantify the severity of the detected caries lesion, . They were calculated as follows: where and are the coordinates of each pixel of the images. In the above equations, provides information on the light scattered by the surface (which would be related to enamel lesions), while provides information on both the light scattered by the surface (due to enamel lesions) and the attenuation of light due to water absorption (which would be related to dentin lesions). Note that the natural brightness of each sample is also accounted by normalizing the images by . Figure 3 shows example images for and . A caries map, , was then obtained by identifying presence or absence of caries using and quantifying it using , combined as follows: where is the threshold for to detect presence of lesions. The precise threshold value is found following the statistical analysis described in the next section.Fig. 3Examples of NIR images for (a) and (b). gives information on presence and position of lesions while quantifies the severity of the lesions giving a continuous score pixel by pixel. 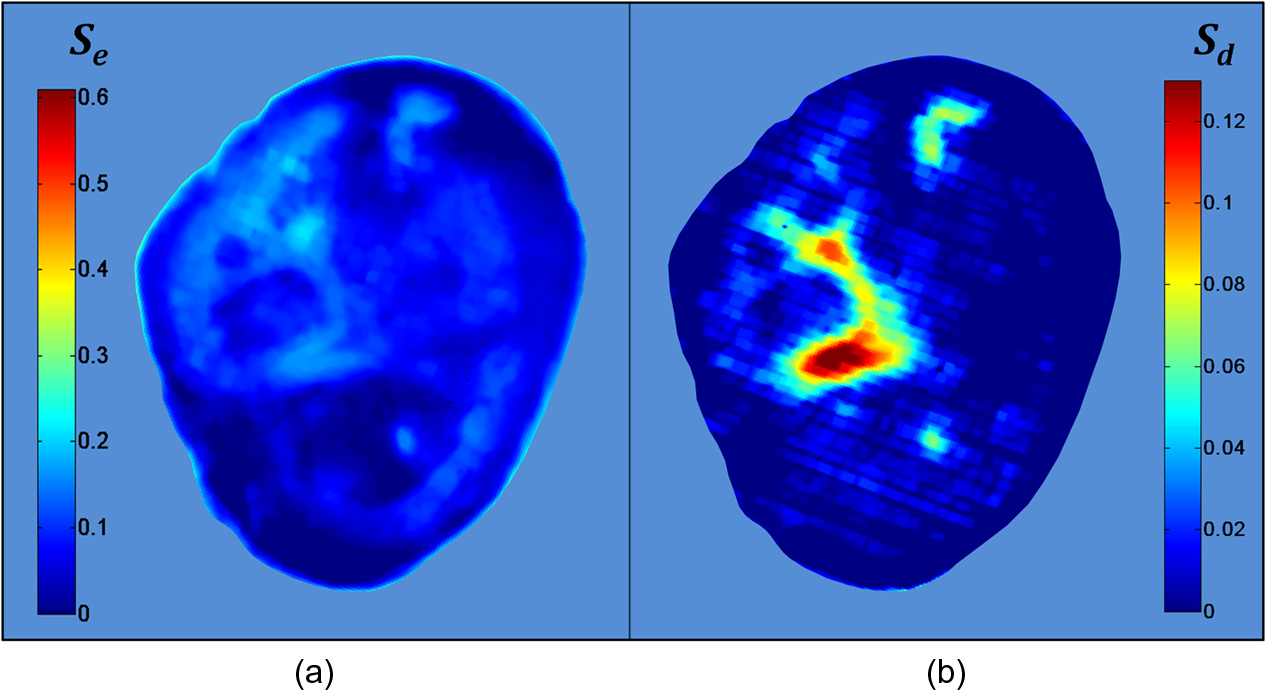 Although the selection of wavelengths and Eqs. (1) and (2) are based on a previous publication,19 the need of empirical factors for is eliminated in here by calculating the thresholds based on the statistical analysis described below. 2.6.Statistical AnalysisA region of interest was selected for each caries map corresponding to the site of the most representative histological hemi-section. The maximum value inside the region was used as the score for the tooth. Teeth were sorted by histological score with the odd and even entries split into two subsets: training sample set (56 teeth) and test sample set (56 teeth). This allowed for an equal lesion severity distribution across both sets. ROC curves were calculated on the training sample set to find detection thresholds corresponding to the best Youden’s index () for each histology level, namely , , EDJ, and D; an ideal index value would be 1. Note that using this same methodology, was calculated from at the E1 histology detection level and subsequently used to generate maps as described in Eq. (3). A three-level detection analysis was implemented with these thresholds in order to investigate the ability of the NIR imaging system to classify (a) areas with no lesion (), (b) areas with enamel lesion (), and (c) areas with dentin lesion (). Here corresponds to the threshold value for the detection of lesions at the histology level as calculated from . Areas with enamel lesion include cases with demineralization in the outer half of the enamel (), inner half of the enamel (), and at the enamel-dentin junction (EDJ). A confidence table was computed for the three-level classification to calculate the sensitivity and specificity of NIR against histological reference standard. The threshold optimized for the training sample set was then applied to the test sample set to produce an unbiased classification analysis and evaluate the ability of the method proposed on an independent (test) set of data. Spearman’s correlation was used to investigate the relationship between the histological and the scores. 3.ResultsExamples of near-infrared maps are shown in Fig. 4. A line on the related color picture indicates the location where the tooth was sectioned, corresponding to the ROI where the score was obtained. The three cases in Fig. 4 show increasing lesion severity in the histology sections, and this is reflected on the score as expected. The maps show a continuous scale above zero as severity increases. Values of zero on the map are therefore registered as sound; values above zero and below () are registered as enamel lesions; otherwise, as dentin lesions. Figure 5 shows boxplots of and histological scores for the training and the test sets. The mean and the standard deviation of the values for each histological score are presented in Table 1. In Table 2, confidence tables for these two sets are also shown. Fig. 4Examples of NIR images for . Three different cases: sound (top), enamel lesion (middle), and dentin lesion (bottom). For each tooth, the color picture (a) with the indication of the investigated lesion (black square) and the histological sectioning site (red line), the corresponding histological section (b), and the false-color map (c) are shown. On the color bar, the range of values are shown along with the dentin lesion threshold (). Values of zero on the map are registered as sound; values above zero and below () are registered as enamel lesions, otherwise as dentin lesions.  Fig. 5Boxplots of against histological scores. scores from (a) training set and from (b) test set. The red horizontal lines represent the threshold () at the D histology level, calculated based on the training sample set and applied to the test sample set. The D histology level is here decomposed in its components: D1 (first third of dentin); D2 (second third of dentin); and D3 (last third of dentin).  Table 1Table of mean and standard deviation values for training sample set and test sample set.
Table 2Confidence table for training sample set (a) and test sample set (b).
Table 3 presents the threshold values for and calculated using the ROC curve analysis from the training sample set. Note that the areas under the ROC curve for the training sample set give a measure of detection accuracy (with ideal value of 1), ranging from 0.90 to 0.94 for . The corresponding sensitivities and specificities for each set are also shown along with the Youden’s indices both for training and for test sets. The best Youden’s index for is 0.93 obtained at the level, discriminating between sound tissue and lesion. Lesion detection sensitivities above 88% and specificities above 79% were found for . Table 3Values of thresholds, areas under the curve, sensitivities, specificities, and Youden’s indices at each lesion level (for histology score greater or equal to E1, E2, EDJ, or D) are shown for Scaries and Sd. Results are divided in training sample set (half of the sample population on which thresholds were calculated) and test sample set (remaining half of sample population on which thresholds were applied).
For the test sample set, the highest Youden’s index found was 0.64 at the level. shows high sensitivity (91%) and good specificity (73%) at detecting lesions at the outer half of the enamel () and above. Moreover, severe demineralization () was detected with 83% sensitivity and 70% specificity. Results for another possible NIR score, , are shown. is proposed as a simplification of the score system but equally efficient (values for the area under the ROC curve ranged from 0.91 to 0.96), less sensitive to sound sites but more sensitive at detecting dentinal lesions. This is because has a higher specificity at the E1 level and therefore higher sensitivity at identifying sound areas, which results from the performance of the enamel threshold, for , as described in Eq. (3). Note in Table 3 a higher sensitivity (95%) and specificity (69%) for at the E2 histological level and also at the dentin level (87% and 67%). In Table 4, values of sensitivity and specificity for and are shown both for training and test sets divided in three detection levels: (a) sites with no lesions; (b) sites with lesions at the outer half of the enamel, reaching the inner half of the enamel or reaching the EDJ; and (c) areas with lesions in dentin. This table is computed by applying the thresholds for detection of lesions at E1 level () and at D level (). Table 4Values of sensitivities and specificities at three lesion levels (for histology scores equal to S, E1+E2+EDJ or D) are shown for Scaries and Sd. Results are divided in training and test sample sets, as for Table 3.
had a sensitivity and specificity of 99% and 93% for sound tissue, 57% and 99% for enamel lesion, and 96% and 79% for dentin lesion detection on the training sample set. On the test sample set, had a sensitivity and specificity of 73% and 91% for sound tissue, 36% and 79% for enamel lesion, and 83% and 70% for dentin lesion detection. performed very similarly, with a lower sensitivity at detecting sound sites but higher sensitivity for dentin lesions, as shown in Table 4. Significant Spearman’s correlation coefficients of 0.774 () between and histological scores and of 0.765 () between and histological scores were obtained. 4.DiscussionThe NIR reflectance multispectral imaging method detects the change in porosity of the surface (a proxy for measure for mineral loss within enamel4) and reveals the presence of cavities under the surface, thus producing a detailed map of caries of the occlusal view of the tooth. Superficial changes in porosity would result in an increase of light scattering, whereas larger cavities would act as water reservoirs. Moreover, at longer wavelengths the scattering from sound enamel reduces, gaining a deeper penetration in the tissue. Presence of water in the lesion can be detected by NIR light absorption, resulting in reflectance attenuation, particularly at about 1450 nm. It is judged that the increase of light scattering at 1600 nm may be used to account for superficial changes in porosity and therefore the difference between the reflectance at 1600 nm and at 1450 nm could explain the discrimination observed between enamel mineral loss and dentinal lesion. The initial near-infrared hyper-spectral study carried by Zakian et al.19 revealed the caries detection ability of different wavelengths in the NIR spectrum. Although the results reported previously using NIR reflectance imaging were promising, the study employed a small sample set of 12 teeth. A sensitivity and a specificity of and 87.5% for enamel lesions and 80% and for dentin lesions were reported. Note that as there was no split between training and test sample sets, the equivalent sensitivity and specificity in this study would be the one for E1 level (93% and , respectively) and the one for D level (96% and 79%, respectively) in the training set in Table 3. In this study, the image quality and detection ability are improved by adding a system of cross-polarization of light in order to remove specular reflections. These reflections from the tooth surface acted as noise, preventing the lesions from being detected in affected areas. Moreover, on the study reported by Zakian et al.,19 empirical factors including the threshold values were applied to the algorithm that prevented generalization of the model. A considerable increase in the sample population, from 12 to 112, allowed more powerful statistical analysis and robust assessment of the technology. In order to evaluate the use of this method throughout the different disease stages, a full range of lesion severity was included in this study: 23 teeth were sound; 43 had lesions in the E1 (4), E2 (17), or EDJ (22); and 46 had dentin lesions. The diagnostic dilemma is separating enamel from dentin lesions, and hence it is important to identify lesions just into dentin ( or so up to pulp) as lesions larger than this may trigger operative interventions. Similarly, failing to detect this kind of lesions may lead unnecessary procedures to be carried out. Optimum thresholds were obtained quantitatively based on the ROC curves using the training sample set and applied to the test sample set. The use of two different sample sets for calculating the performance allows for an unbiased analysis where the test sample set is independent from the training sample set and represents the more realistic scenario where caries quantification would be performed on cases never measured before. It has been therefore shown that can be free of empirical factors, meaning that these findings are directly applicable to any new sample set. The three-level detection statistical method27 used in here can further inform the dental clinicians for a better decision-making. Computed on the test sample set, the score system results are specific (91%) at detecting sound sites, meaning that unhealthy sites are truly detected as unhealthy and has a good performance at detecting demineralized dentin tissue (sensitivity of 83% and specificity of 70%). Although quite specific (79%) at detecting enamel demineralization sites, both incipient and progressed (E1 to EDJ), the sensitivity is low (36%). This can be partly due to the limited presence of early enamel lesion cases in the sample set, affecting the threshold decision procedure (ROC curves) and therefore reducing the ability to discriminate between sound and incipient demineralization. This is a common issue for in vitro studies since the collection of samples with incipient natural lesions would mainly result from extractions due to orthodontic reasons. However, the low sensitivity is mostly due to severe lesions in the EDJ that were detected as dentin lesions. An example is shown in Fig. 6. Consequently, this decreases the value of specificity at detecting dentin. The probable cause of this issue is that the NIR method quantifies severity based on the presence of water. If a lesion is severe and confined in the tissue at an EDJ level, it might contain more water than incipient lesions and would yield higher values. Fig. 6Example of overscoring. Color picture (a); histological section (b); and map (c) of a tooth where scored above the dentin lesion threshold (0.0718).  Other cases of overscoring are presented. As shown in Fig. 7, enamel breaks or enamel defects are detected as lesions even if scored as sound by histology. Note that the evaluation of the histological sections remains a subjective process but is, however, accepted as a gold standard. Scores are given on the basis of lesion depth and cannot give information on activity in the lesion or remineralization of the tissue (it is broadly based on color changes in the tooth structure rather than assessment of infected or affected tissues). Although more studies on the NIR response on remineralized tissue are required, when the tissue is remineralized, a reduced porosity is expected and therefore lower scattered light could be detected and scored as sound. However, if there is enamel breakdown, this might be detected as a lesion even if scored as sound with histology, as shown in the top image in Fig. 7. Fig. 7Examples of overscoring. Color pictures (a); histological sections (b); and maps (c) are shown. Enamel break (top) and enamel defects (bottom) scored by histology as sound but detected as enamel lesion. 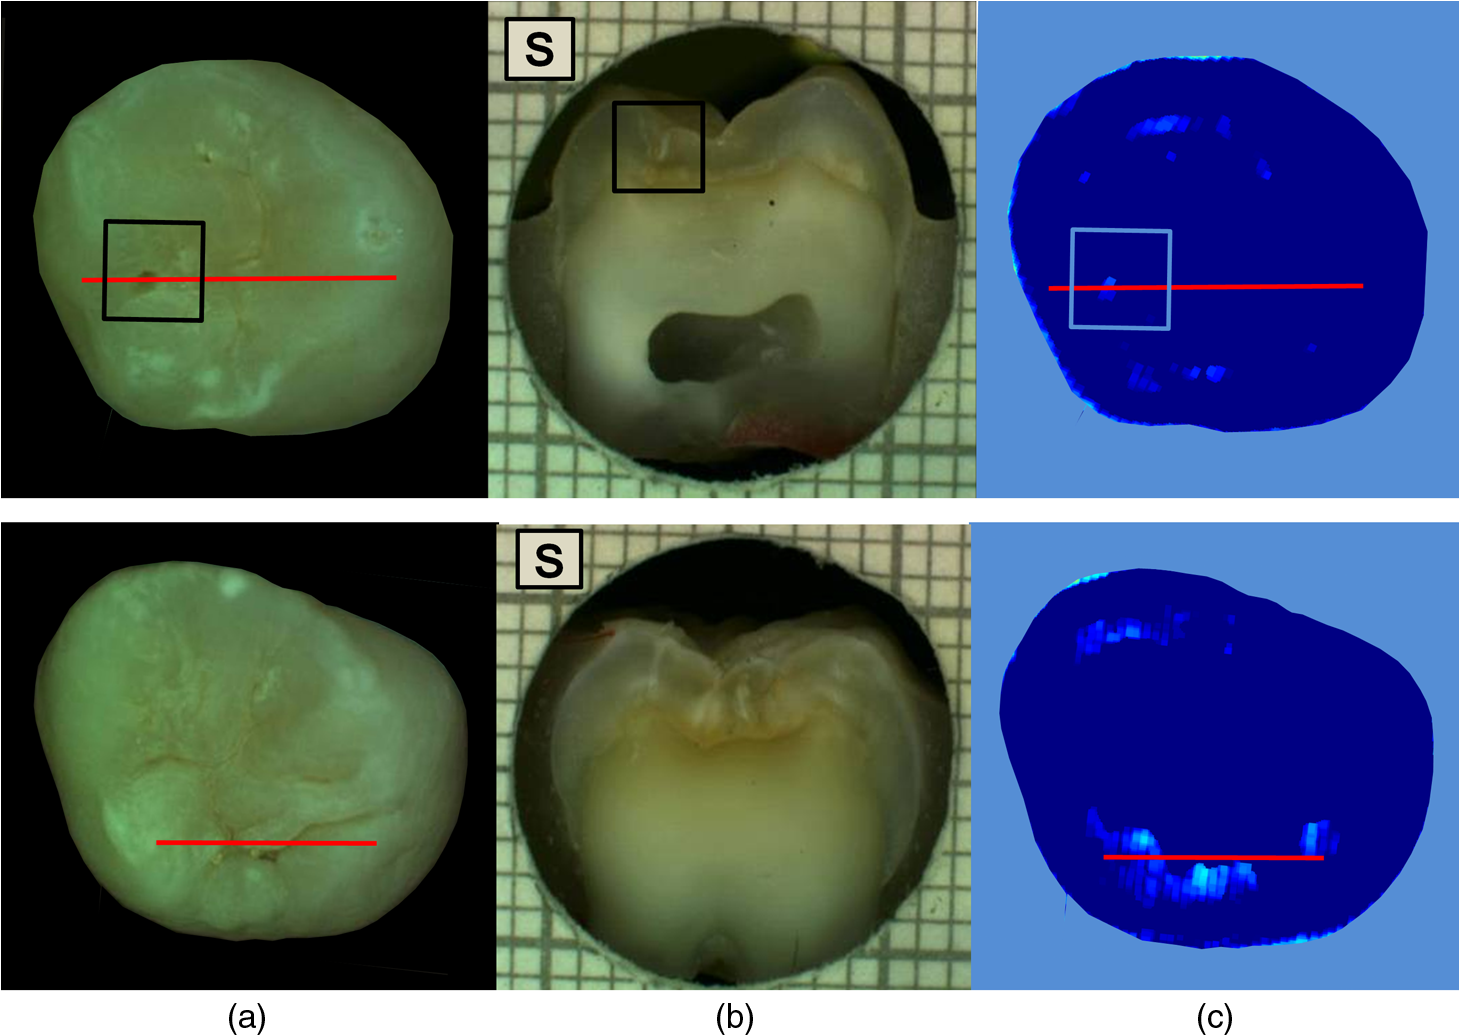 Very few cases of underscoring were reported, an example is shown in Fig. 8. Underscoring can be due to an excess of moisture filling the porous tissue, reducing the amount of light scattering at 1600 nm and lowering the values for . Although Chung et al.28 suggested that use of reflectance to determine lesion depth was inappropriate due to a reduced penetration of light in the presence of lesions, this would not explain the overall behavior observed in our study. In fact, using the spectral difference between and allows for a clear distinction between dentin lesions under overlying enamel lesions, as is affected by water even in presence of scattering due to surface porosity. Moreover, the relative combination of specific wavelengths for imaging reduces the influence of the natural tooth reflectance variations on the quantitative caries score. This approach allows for an automated distinction between sound tissue and demineralized tissue without requiring the input of a user to preselect specific regions of interest such as sound areas surrounding the lesion or sound edges at the extreme ends of a line profile drawn for quantification. This is aimed to reduce any source of subjective information introduced about the tooth in the method. Fig. 8Example of underscoring. Color picture (a); histological section (b); and map (c) of a tooth with dentin lesions that was scored by as demineralized up to the inner half of enamel. Possibly the presence of water in the enamel attenuated the reflectance at 1600 nm. 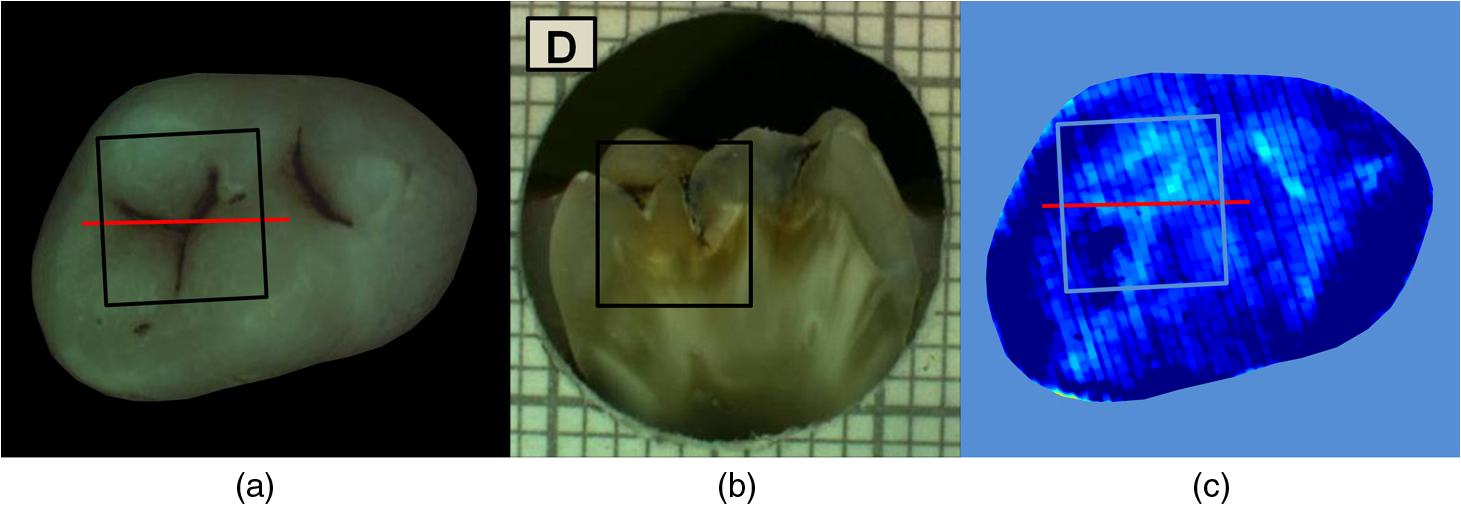 From the results obtained in this study, it was observed that higher severity corresponded to higher demineralization. In most cases this would coincide with increased depth, but this is not necessarily true, as in the examples shown in Figs. 6 and 9. Fig. 9Example of overscoring. Color picture (a); histological section (b); and map (c) of a tooth with enamel lesion scored as dentin by (dentin lesion threshold ).  Unlike single-point measurement devices, the lesion mapping ability of the technique presented can be an instantaneous visual enhancement tool for the clinicians. Mapping the tooth using NIR light can help to discriminate between a stained healthy site and a site with stained-carious tissue. In Fig. 10, two examples of stained teeth are shown. In the first case (top images), the color image shows a stained fissure pattern that covers the lesion as mapped by , while in the second case (bottom images) the stain pattern is invisible to the lesion pattern indicated by . This suggests that stain is neither increasing nor decreasing the measurement. In both cases stain negligibly absorbs NIR light19,29 and maps the lesions present at different levels demonstrating that the stain does not interfere with the NIR imaging. Stain is the biggest confounding factor in techniques using visible light such as QLF and DIAGNOdent, as well as clinical inspection and FOTI and DIFOTI. Moreover, NIR light is noninvasive and can be used as frequently as required. The restrictions of this technique may be the presence of large enamel breaks, such as macroscopic holes on the surface. As already reported in Zakian et al.,19 this case is easily detectable with visible inspection to which this technique is suggested as an adjunct to support decision-making. It, however, performs efficiently in the case of microcavities, where microscopic holes on the enamel, difficult to detect, are channels to extended severe caries in dentin. Fig. 10Examples of teeth affected by stain. Color pictures (a); histological sections (b); and maps (c) are shown. These cases demonstrate the ability of to detect dental caries through stain. is able to map dentinal lesions underneath a layer of stained tissue as seen in the upper case. The tooth shown in the bottom is used to confirm that the map is not affected by stain as the stain pattern visible in the corresponding color image is not reflected in the map. Arrows show how the stain does not interfere with the detection of the spread dentinal lesion underneath.  Detection improvements can be investigated by modifying the measurement procedure and the detection algorithm. This technique ideally requires dry enamel in order to detect the presence of water in dentin. Further studies can be undertaken with a dynamic drying system computer-controlled for concurrent monitoring of the signal. The results are encouraging and other types of carious lesions could be assessed in future work, such as fluorosis and approximal lesions. 5.ConclusionsIn this study, 112 teeth were examined with the NIR multispectral imaging and hemi-sectioned to validate this technique against a histological reference sample. NIR can detect sound tissue with sensitivity and specificity of 73% and 91%, enamel lesions with 36% and 79%, and dentin lesions with 83% and 70%. This NIR technique is noninvasive, stain insensitive, and it has the ability of mapping the tooth showing the presence of lesions and giving a continuous caries score pixel by pixel. This technique can be a tool for detection of early to severe caries, can help the clinician in first assessment and dental health monitoring, can give information on the location of the lesion for targeted treatment procedures, and can enhance communication with patients, as recently recognized and suggested as an essential objective for dental practitioners.6 AcknowledgmentsThe authors wish to thank Mr Brian Daber for the tooth sectioning and Dr. Angeles Martinez Mier for providing the tooth samples. This work was funded by the University of Manchester Intellectual Property (UMIP, Ltd). S.S. would like to thank the Ministero dell’Istruzione, dell’Università e della Ricerca for her PhD scholarship. ReferencesJ. Fawellet al.,
“Fluoride in drinking water,”
Cancer Epidemiology, IWA Publishing, London, UK
(2006). Google Scholar
D. BratthallG. Hänsel-PeterssonH. Sundberg,
“Reasons for the caries decline: what do the experts believe?,”
Euro. J. Oral Sci., 104 416
–422
(1996). http://dx.doi.org/10.1111/eos.1996.104.issue-4 EJOSFY 0909-8836 Google Scholar
P. E. Petersen,
“The world oral health report 2003-WHO global oral health programme,”
Oral Health
(2003). Google Scholar
E. A. M. KiddO. Fejerskov,
“What constitutes dental caries? Histopathology of carious enamel and dentin related to the action of cariogenic biofilms,”
J. Dent. Res., 83 C35
–C38
(2004). http://dx.doi.org/10.1177/154405910408301S07 JDREAF 0022-0345 Google Scholar
D. T. Zero,
“Dentifrices, mouthwashes, and remineralization/caries arrestment strategies,”
BMC Oral Health, 6 1
–13
(2006). http://dx.doi.org/10.1186/1472-6831-6-S1-S9 BOHMBD 1472-6831 Google Scholar
P. Bottenberget al.,
“Decision-making and preventive non-surgical therapy in the context of a European Core Curriculum in Cariology,”
Eur. J. Den. Educ.: off. Assoc. J. Dental Educ. Eur., 15 32
–39
(2011). http://dx.doi.org/10.1111/eje.2011.15.issue-s1 1396-5883 Google Scholar
D. F. Côrteset al.,
“An in vitro comparison of the ability of fibre-optic transillumination, visual inspection and radiographs to detect occlusal caries and evaluate lesion depth,”
Caries Res., 34 443
–447
(2000). http://dx.doi.org/10.1159/000016621 CAREBK 0008-6568 Google Scholar
V. MachiulskieneB. NyvadV. Baelum,
“A comparison of clinical and radiographic caries diagnoses in posterior teeth of 12-year-old Lithuanian children,”
Caries Res., 33 340
–348
(1999). http://dx.doi.org/10.1159/000016532 CAREBK 0008-6568 Google Scholar
A. Wenzelet al.,
“Accuracy of visual inspection, fiber-optic transillumination, and various radiographic image modalities for the detection of occlusal caries in extracted non-cavitated teeth,”
J. Dent. Res., 71 1934
–1937
(1992). http://dx.doi.org/10.1177/00220345920710121501 JDREAF 0022-0345 Google Scholar
A. Schneidermanet al.,
“Assessment of dental caries with digital imaging fiber-optic transillumination (DIFOTI): in vitro study,”
Caries Res., 31 103
–110
(1997). http://dx.doi.org/10.1159/000262384 CAREBK 0008-6568 Google Scholar
Y. L. Fennis-IeE. H. VerdonschotM. A. van’t Hof,
“Performance of some diagnostic systems in the prediction of occlusal caries in permanent molars in 6- and 11-year-old children,”
J. Dent., 26 403
–408
(1998). http://dx.doi.org/10.1016/S0300-5712(97)00060-2 JDENAB 0300-5712 Google Scholar
C. LongbottomM.-C. D. N. J. M. Huysmans,
“Electrical measurements for use in caries clinical trials,”
J. Dent. Res., 83 C76
–C79
(2004). http://dx.doi.org/10.1177/154405910408301S15 JDREAF 0022-0345 Google Scholar
H. M. Alwas-Danowskaet al.,
“Reliability and validity issues of laser fluorescence measurements in occlusal caries diagnosis,”
J. Dent., 30 129
–134
(2002). http://dx.doi.org/10.1016/S0300-5712(02)00015-5 JDENAB 0300-5712 Google Scholar
X. Q. ShiS. TranaeusB. Angmar-Månsson,
“Validation of DIAGNOdent for quantification of smooth-surface caries: an in vitro study,”
Acta Odontologica Scandinavica, 59 74
–78
(2001). http://dx.doi.org/10.1080/000163501750157153 AOSCAQ 0001-6357 Google Scholar
B. T. AmaechiS. M. Higham,
“Quantitative light-induced fluorescence: a potential tool for general dental assessment,”
J. Biomed. Opt., 7 7
–13
(2002). http://dx.doi.org/10.1117/1.1427044 JBOPFO 1083-3668 Google Scholar
B. Angmar-ManssonJ. J. ten Bosch,
“Quantitative light-induced fluorescence (QLF): a method for assessment of incipient caries lesions,”
Dentomaxillofacial Radiol., 30 298
–307
(2001). http://dx.doi.org/10.1038/sj.dmfr.4600644 0250-832X Google Scholar
R. JonesD. FriedS. Francisco,
“Attenuation of 1310-nm and 1550-nm laser light through sound dental enamel,”
Proc. SPIE, 4610 187
–190
(2002). http://dx.doi.org/10.1117/12.469324 PSISDG 0277-786X Google Scholar
C. L. DarlingG. D. HuynhD. Fried,
“Light scattering properties of natural and artificially demineralized dental enamel at 1310 nm,”
J. Biomed. Opt., 11 34023
–11
(2006). http://dx.doi.org/10.1117/1.2204603 JBOPFO 1083-3668 Google Scholar
C. ZakianI. PrettyR. Ellwood,
“Near-infrared hyperspectral imaging of teeth for dental caries detection,”
J. Biomed. Opt., 14 064047
(2009). http://dx.doi.org/10.1117/1.3275480 JBOPFO 1083-3668 Google Scholar
R. Joneset al.,
“Near-infrared transillumination at 1310-nm for the imaging of early dental decay,”
Opt. Express, 11 2259
–2265
(2003). http://dx.doi.org/10.1364/OE.11.002259 OPEXFF 1094-4087 Google Scholar
B. W. Colstonet al.,
“Imaging of hard- and soft-tissue structure in the oral cavity by optical coherence tomography,”
Appl. Opt., 37 3582
–3585
(1998). http://dx.doi.org/10.1364/AO.37.003582 APOPAI 0003-6935 Google Scholar
B. T. Amaechiet al.,
“Correlation of quantitative light-induced fluorescence and optical coherence tomography applied for detection and quantification of early dental caries,”
J. Biomed. Opt., 8 642
–647
(2003). http://dx.doi.org/10.1117/1.1606685 JBOPFO 1083-3668 Google Scholar
M. C. D. N. J. M. HuysmansH. P. ChewR. P. Ellwood,
“Clinical studies of dental erosion and erosive wear,”
Caries Res., 45 60
–68
(2011). http://dx.doi.org/10.1159/000325947 CAREBK 0008-6568 Google Scholar
J. WuD. Fried,
“High contrast near-infrared polarized reflectance images of demineralization on tooth buccal and occlusal surfaces at ,”
Lasers Surg. Med., 41 208
–213
(2009). http://dx.doi.org/10.1002/lsm.v41:3 LSMEDI 0196-8092 Google Scholar
A. I. Ismailet al.,
“The International Caries Detection and Assessment System (ICDAS): an integrated system for measuring dental caries,”
Community Dent. Oral Epidemiol., 35 170
–178
(2007). http://dx.doi.org/10.1111/com.2007.35.issue-3 CDOEAP 0301-5661 Google Scholar
A. Jablonski-Momeniet al.,
“Reproducibility and accuracy of the ICDAS-II for detection of occlusal caries in vitro,”
Caries Res., 42 79
–87
(2008). http://dx.doi.org/10.1159/000113160 CAREBK 0008-6568 Google Scholar
C. M. Zakianet al.,
“Occlusal caries detection by using thermal imaging,”
J. Dent., 38 788
–795
(2010). http://dx.doi.org/10.1016/j.jdent.2010.06.010 JDENAB 0300-5712 Google Scholar
S. Chunget al.,
“Multispectral near-IR reflectance and transillumination imaging of teeth,”
Biomed. Opt. Express, 2 2804
–2814
(2011). http://dx.doi.org/10.1364/BOE.2.002804 BOEICL 2156-7085 Google Scholar
C. M. BuehlerD. Fried,
“Near-IR imaging of occlusal dental decay,”
Proc. SPIE, 5687 125
–131
(2005). http://dx.doi.org/10.1117/12.604555 PSISDG 0277-786X Google Scholar
|
|||||||||||||||||||||||||||||||||||||||||||||||||||||||||||||||||||||||||||||||||||||||||||||||||||||||||||||||||||||||||||||||||||||||||||||||||||||||||||||||||||||||||||||||||||||||||||||||||||||||||||||||||||||||||||||||||||||||||||||||||||||