

|
|
1.IntroductionSpectroscopic analysis to determine differences between normal and diseased tissues has been researched extensively in the past. Most of these studies were carried out on biopsied tissue samples.1,2 Fluorescence characteristics of tumors have been studied by spectroscopic methods by various laboratories using both single wavelength excitations as well as by varying the excitation wavelengths.3–6 Moreover, fluorescence intensities and intensity ratios have been used in the past to distinguish malignancy from normal tissues.7,8 Decision making on the disease state of these tissues was based on comparison with the spectral pattern of normal tissue. Studies employing hyperspectral imaging have also been reported.9,10 Based on the reports in the literature, it can be inferred that most of the fluorescence-based studies reported so far focused on spectroscopic methods, employing point-by-point scan in very small targeted areas and wavelength scans that provide poor resolution, both spatially and temporally. Furthermore, these methods are only effective for detailed diagnosis, once the abnormal area is identified, and not for scanning for localization of the abnormality itself within a whole-field image. Some other studies employed CCDs with fluorescence-detection-based approach.11,12 An endoscope employing red & green channels CCDs for detection of autofluorescence with blue (442 nm) illumination and a separate CCD for white-light imaging has previously been reported.11 Another approach taken was to capture fluorescence (with or without markers), applying UV or short wavelength illumination. In one such study, the fluorescence image of a tissue was captured by a CCD camera under UV illumination, and the ratio of the intensities of the green to the red components in the recorded image was used for assessing malignancies.12 Another interesting concept utilized was based on an autofluorescence observation scheme with a set of monochromatic CCDs under blue- and green-light excitation wavelengths (from a Xenon arc lamp with a rotating filter synchronised with the CCD).13 In this reported method, autofluorescence (green) with blue excitation was fed into the green channel and reflection with green illumination was fed into the red and blue channels. The images were overlaid, resulting in green areas for normal regions and magenta areas for cancerous regions. However, diagnostic accuracy was dependent on the extent of abnormality and still based on visual judgment of the combined image. Another study used narrow-band illumination together with rotating filters to study the contrast of the lesions compared to normal areas of the tissue.14 An on-the-fly identification of the abnormal region becomes difficult in these cases, especially when the differences in fluorescence or absorption are small or when the emissions are weak. The CCD-based RGB shift analysis with light-emitting diode (LED) excitation proposed through this paper offers a simple methodology for tissue diagnostics in a whole-field-imaging scheme without the use of external colour filters, and eliminating the need for blind biopsies. Light of specific wavelengths falling on the targeted tissue will be reflected, transmitted, absorbed, or re-emitted at a wavelength different from the illuminating wavelength. The extent to which this happens depends on the tissue type and the changes in its physiology. The morphological and biochemical changes in diseased tissues result in changes to their fluorescence, reflection and absorption spectra.15 As fluorescence emissions get red-shifted with respect to the illuminating wavelength, the RGB values of the image captured by the CCD camera can potentially be used to indicate the presence or absence of fluorophores in a probed tissue area. Similarly, absorption of the illuminating wavelength in a certain region of the tissue results in a decrease in one or more components of the RGB gray values. The normalized R, G, and B values of the pixels or groups of pixels in an image when compared against those of an illuminating wavelength provides an opportunity to enhance the differences in appearance of the different tissue regions. Pseudo-colored images are created with a color scheme denoting the extent of shift in the RGB values from the reference illumination. These are superimposed on the original images to localize the abnormality. Experiments were carried out on animal models to explore the ability of the proposed methodology to identify and differentiate between abnormal regions from normal regions of the tissue field. 2.MethodIn the proposed approach, instead of attempting to find the exact fluorescence emission wavelength from the RGB data, spectral shift estimation is done on a patch of the image acquired by the CCD camera, with respect to the illumination in terms of the R, G, and B components. The spectral shift values are then used for localization of the abnormality. The RGB color model can be represented as a cube, where the R, G, and B are the three coordinate axes and wavelengths in the visible spectrum can hence be mapped onto the RGB cube. Depending on fluorescence or absorption, the RGB values at different points in the image captured by the CCD camera differ correspondingly from those of the illuminating wavelengths. The differences between the RGB gray values in the image with respect to those of the illuminating wavelength are used to calculate the shift in terms of Euclidean distance in the RGB coordinate system. Normalization of the RGB values is done, both for the illuminating wavelength as well as for the pixels in the image to reduce intensity differences related issues and to ensure an even basis for spectral shift calculation, as given in Eqs. (1)–(3). where R, G, B are the respective gray values at the image pixels and , , are the normalized gray values. Assuming a cube representation of the R, G, B coordinates, the magnitude of shift may be expressed as the Euclidean distance between the R, G, and B colour coordinates of the probed area with respect to the reference R, G, and B color coordinates, as given in Eq. (4). The reference may be the illumination source (preferred) or a portion of the surface being interrogated. where SS is the spectral shift value, the subscript ‘n’ stands for the normalized R, G, B values for the imaged target area and the subscript ‘r’ refers to the normalized R, G, B values for the reference; in this case, the illuminating wavelength.A pseudo-colored image is then created using the calculated shift values. In a generic approach, one can employ several coloring schemes. In our program, we have provided a transition color scale scheme (say, from yellow-to-red or red-to-yellow-to-green) and correspondingly allocated the same based on the minimum to maximum of the shift values calculated. The minimum and maximum values of these shifts are used to stretch the contrast on the pseudo-colored image. With this approach, small spectral shifts are magnified in the pseudo-colored image to enable easy localization of abnormalities. Pseudo-colored images are also created showing significant increase in R, G, or B components, respectively. The logic table is built based on the possible shift directions of the RGB components (increase, decrease, remain unchanged). As there are three coordinates and three shift directions for each coordinate, the logic table has 27 possible conditions, of which only the valid 12 conditions are used (invalid conditions are eliminated, for instance, all the three normalized R, G, B gray values simultaneously cannot increase, or decrease with reference to the illumination). An algorithm was developed to calculate the RGB shifts from the captured images with reference to the RGB values of the corresponding illumination and used to superimpose a pseudo-colored image on the original image for localization of the abnormality. The algorithm allows deletion of areas with high specular reflection (eliminating CCD saturation) and dark areas from the calculation by way of thresholding. When there is an extremely bright area in the image, especially in the case of specular reflection, all the three R,G, and B gray values take the upper limit (for example, 255 for 8-bit). Similarly, when there are very dark areas, for instance, caused by shadow, the gray values are close to the minimum, 0. In such cases, the shift value calculations will be erroneous and meaningless. In our program, two options are provided to eliminate such regions from the calculation: a) point and click on the too bright or dark portions to define the upper and lower thresholds or b) input threshold values (for instance, the program can be set such that portions with RGB values above 250, 250, 250, or below 10, 10, 10 are eliminated from the calculations). In the case of low-intensity light, the R, G, B values are adjusted upward, maintaining the ratiometric relationship between the three values. In circumstances where CCD saturation results due to high-intensity light, the source power can be adjusted downward to bring the gray values to below saturation limits. It is proposed that in an in vivo diagnosis scenario, a sequence of different illuminating wavelengths and white light could be projected on to the target tissue surface, synchronised with the CCD. This can help the endoscopist to observe the corresponding images on a monitor with superimposed RGB shift effects to enable localization of an abnormal condition such as cancer. In order to illustrate the approach with real tissues, imaging was carried out on freshly excised rat colon tissue with a simulated tumor as well as a nude mouse with cancerous tumor on the flank. Imaging was carried out with Basler Scout CCD camera [Scout SCA1400fc (Basler AG, Germany)] fitted with an f 2.8, 50-mm zoom lens (Tamron, Japan). LEDs ( SuperbrightLEDs.com) of different wavelengths were used to illuminate the sample (Fig. 1). No filters were used to cut off the illuminating wavelengths from entering the CCD camera. 3.Results3.1.Experiments with Excised Rat Colon Tissue with Simulated Fluorescence and Cancerous tumor with LED IlluminationThe rat colon surface was doped with Alexafluor 488 solution (concentration dissolved in 20 mM phosphate buffered saline (PBS; 150 mM NaCl) at pH 7.4 to simulate human colon emission. The animal handling was performed in accordance with BRC, A*STAR Animal Research Committee guidelines. In the current study, colon derived from euthanized Wistar rats were used. Ten minutes before the experiments, the animals were euthanized with , and the entire colon was dissected and transferred into ice-cold phosphate buffered saline (PBS). The colon tube structure was cut open and washed thoroughly to remove bounded faeces without disturbing the tissue texture of the colon. Soon after the wash, the tissue was placed on a slide, and the fluorescence images were collected. All the image acquisitions were performed within two hours of dissection of the colon in an air-conditioned room. HCT-116 human colon cancer cells (ATCC, Manassas, VA) were mixed in a matrix (, 1% agarose) and a small pellet was made to mimic a cancerous lesion and image acquired using the setup illustrated in Fig. 1. An example of the raw images and the pseudo-colored images obtained based on the RGB shift calculations with 405-nm LED illumination is shown in Fig. 2. Fig. 2Real and pseudo-colored images of the excised Wistar rat colon sample (lightly doped with Alexafluor 488) and with simulated tumor (cancer cell pellet placed on colon) under LED illumination showing clear localization of tumor region in pseudo-colored images: (a) near UV (405 nm) LED illumination; (b) pseudo-colored image with total RGB shift; (c) pseudo-colored image with total RG shift; (d) pseudo-colored image with total RB shift; and (e) pseudo-colored image with total GB shift.  The green color in the pseudo-colored images in Fig. 2 indicates regions of highest shift, and the red color shows least shift. The figures are created with shift values calculated from the pairs in the RGB values. This is to give a visual indication of the strongest shift component pairs and to obtain high contrast. It may be noted that the normal colon region (which was doped with the fluorophore) shows a high shift (in green); the simulated tumor having masked the fluorescent region, shows the least shift (in red). For instance, Fig. 2(c) and 2(e) shows large areas with the green pseudo-color patches indicating a large shift, which is caused by the G component increase as a result of fluorescence from the exposed Alexafluor 488 stained regions. However, in Fig. 2(e), the contrast is higher as the increase in G component with the corresponding decrease in B component is taken together in the calculation. The simulated tumor region is thus localized using the proposed methodology. An example of the pseudo-colored images based on the R/G/B component increase/decrease is shown in Fig. 3. Fig. 3Real and pseudo-colored images of the excised Wistar rat colon sample (lightly doped with Alexafluor 488) and with simulated tumor (cancer cell pellet placed on colon) under LED illumination showing clear localization of tumor region in pseudo-colored images: (a) white LED illumination; (b) Near UV (405 nm) LED illumination; (c) pseudo-colored image: green component shift in normal (Alexafluor488 doped) area; and (d) pseudo-colored image: red component shift in simulated tumor (cancer cell pellet) area.  It may be noted from the images that the simulated tumor, not easily visible under white light, nor with the near-UV image, is easily localized with the RGB shift-based pseudo-colored images with the 405-nm illumination. Excitation of the fluorophore is clearly emphasised in Fig. 3(c); the normal region highlights the G component increase. The tumor region remains uncolored (no G component increase) as the simulated tumor masks the fluorescence. Regions with R component reduction in the pseudo-colored image get the dark red color; in this case, the simulated tumor [Fig. 3(d)]. Pseudo-colored images can also be created using pairs in the RGB components to calculate the shifts; for example, blue-green shift, blue-red shift and green-red shift. The advantage is that the contrast, if present, is improved as confounding by the third component is reduced. 3.2.Experiments with Nude Mice with Induced TumorA nu/nu nude mouse was used in this study. Subdermal placement of tumor xenograft on the flank region was performed as follows: The mouse was placed under anaesthesia using isoflurane inhalation (2% isoflurane in 100% oxygen at a flow rate of ), and the skin of the nude mouse was disinfected with alcohol and betadine about three times. The mouse was then injected subcutaneously with HCT-116 human colon tumor cells (0.15 ml Matrigel); one injection on each of right and left flanks. After two weeks of inoculation (tumor growth 0.5 cm) an image of the animal was acquired in prone position with white (LED) illumination, followed by LED spectral acquisitions. The nude mouse was euthanized under anaesthesia; however, its tumors were imaged within 30 min thereafter. LEDs of different wavelengths were used to illuminate the tumors. The images recorded were processed with software developed by us to process the RGB values and to produce pseudo-colored images to localize the tumors. A few examples of the results after image processing are shown in Fig. 4. Fig. 4Real and pseudo-colored images of scarved nu/nu nude mouse with cancerous tumor under LED illumination: (a) White light image of mouse. The yellow inset box is marked to represent the region analyzed for spectral shift. Top left corner region in the marked portion has tumor exposed from scarving. Bottom right region in the marked portion shows the tumor without the skin removed. (b) Image of the marked portion under 605-nm LED illumination. (c) Pseudo-colored image: red component increase in normal area skin as well as scarved area; dark regions at tumor locations both in scarved and unscarved portions; spectral shift contrasted in tumor regions with respect to rest of the regions; (d) pseudo-colored image: Red component decrease in tumor area; bright regions at tumor locations both in scarved and unscarved portions; spectral shift contrasted in tumor regions with respect to rest of the regions; and (e) pseudo-colored image; green component increase in skin area with Yellow LED illumination (587 nm); dark regions at tumor locations and scarved portions; skin regions appear bright; spectral shift contrasted in skin regions with respect to scarved regions. 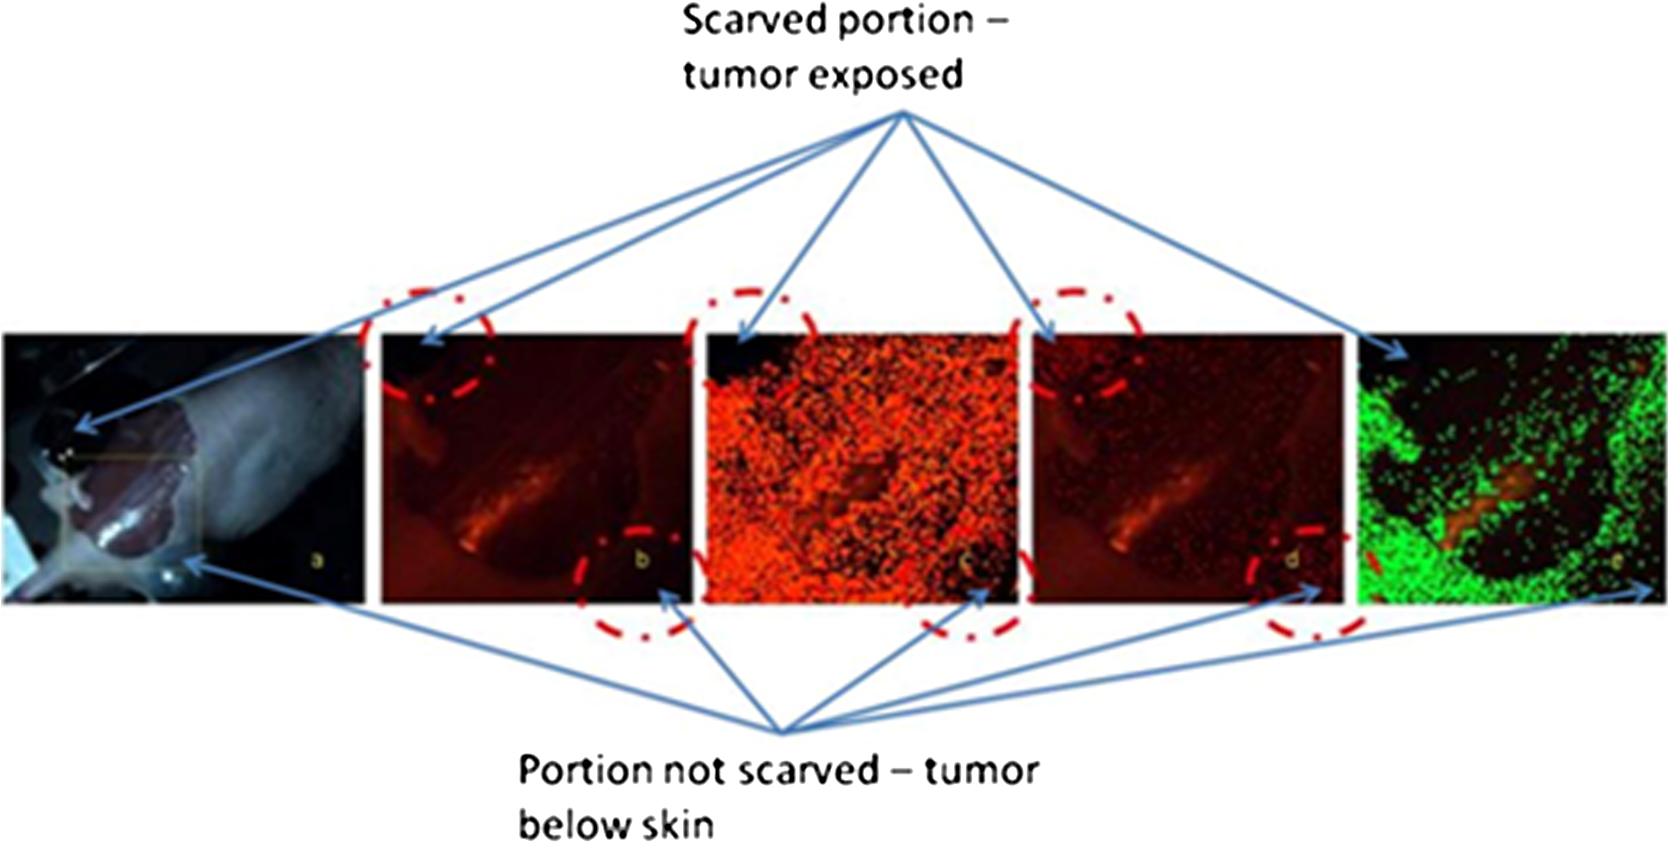 Figure 4(a) shows the white-light image of the scarved mouse, with the area highlighted by the yellow-lined box used for further image processing. Figure 4(b) to 4(d) shows examples of processed images of the same area imaged under 605 nm LED illumination, and Fig. 4(e) is the processed image with 587 nm LED illumination. A clear demarcation of the cancerous, normal, and scarved areas of the tissues could be observed on the pseudo-colored images, which were created based on shifts in the R and G gray values with respect to those of the illuminating wavelengths. While the pseudo-colored images in Fig. 4(c) and 4(d) contrasted tumor regions with respect to rest of the regions, Fig. 4(e) pseudo-colored image contrasted skin regions with respect to scarved regions. Use of specific illuminating wavelengths help to contrast spectral differences better and avoid ambiguity. Figure 5 shows some example results of spectral shift analysis carried with white, near UV (405 nm) and yellow (587 nm) LED illumination. Fig. 5Pseudo-colored images based on RGB shift superimposed on original images under white, 405-nm and 587-nm LED illumination. 5 (a1) to (a4): Images showing R component increase, G component increase, R component decrease, and G component decrease, respectively; for white LED illumination. 5 (b1) to (b4): Images showing R component increase, G component increase, R component decrease, and G component decrease, respectively, for 405-nm LED illumination. 5 (c1) to (c4): Images showing R component increase, G component increase, R component decrease, and G component decrease, respectively, for 587 nm LED illumination.  It can be observed that, though the white LED images show areas of strong RGB shifts, it is difficult to localize the abnormal tumor areas (left top and right bottom corner areas) without ambiguity. With 405-nm illumination, Fig. 5 (b)3 and (b)4 are able to contrast the tumor area. With the 587-nm illumination, contrasting of tumor areas [5 (c)1, (c)3, (c)4] as well as normal skin area [5 (c)2] is observed. For in vivo application, the illuminating wavelengths may need to be optimized. Based on the above illustrated results, it can be inferred that the proposed technique could enable localization of abnormal or cancerous region from the surrounding normal tissue. 4.DiscussionIn a real-life scenario, additional improvement in image contrast may be derived due to the masking or destruction of the collagen and increase of porphyrins in the cancerous lesion.11,15 In the human colon, the collagen is excitable with UV and blue wavelengths;6,15 hence the cancerous lesion region with disrupted collagen would show a low RGB shift (less fluorescence, so less spectral shift in the pseudo-colored image) and a normal tissue region would show a large RGB shift (high collagen fluorescence, so large spectral shift in the pseudo-colored image), with respect to the illuminating wavelength, and would be readily discernible on the endoscopist’s monitor. In the program, a minimum value for difference in the gray values of the individual RGB components in the image (with respect to those of illumination) can be input so that only significant changes in the RGB components are considered for the shift calculation. In our experiments, a value between 5 and 10 provided images with reasonably good localization of abnormality. However, this value may need to be adjusted for in vivo assessments. The application envisaged in this study is targeted at disease diagnosis, which is inferred from the extent of shift in the R, G, B values away from normal values in the tissue area being probed, with specific narrowband illumination. It is not necessary to obtain a complete spectral assessment of the probed area (as is done with conventional spectroscopy, where the process would involve enormous amount of time as well as data crunching). It is to be emphasized that in the proposed scheme, it is also not necessary to use filters for the camera to cut off the illuminating wavelengths; the advantage being that different illuminating wavelengths could be applied and imaging could be carried out with a simple CCD camera setup. In a preferred scheme, specific illumination wavelengths (in the UV/blue/green/red ranges) and white light are projected sequentially on the target tissue area, and the RGB gray values of the resulting images are analyzed for potential fluorescence and absorption effects. For real-time image processing and display, speed is crucial, and hence it is proposed that the system looks only for typical signatures of the tissue by way of specific fluorescence emissions (for example, collagen or porphyrin) detection under specific illuminating wavelengths. The algorithm examines the tissue image for RGB gray value shift values beyond a defined threshold to indicate the tissue nature and condition. Currently, our software produces the spectral shift images and the RGB component images within 1 s. The software will be adapted for real-time video processing, sampling the CCD images at regular intervals, facilitating fast localization of abnormality for the endoscopist. Once the abnormal area is identified, the endoscopist can zoom in or move the endoscope tip to the target area and conduct further in-depth diagnostics. A noise factor that is anticipated is the shadow region caused by folds of tissue, causing little or no illumination, resulting in very low RGB values. In such cases, thresholding can be applied during image processing, and such regions in the image can be marked out as shadow regions. 5.ConclusionsA simple and user-friendly imaging system and protocol with the proposed RGB shift analysis concept is illustrated here for efficient tissue diagnostic applications. The proposed whole field imaging based on a simple CCD based system and LED illumination can localize an abnormal area in the targeted tissue. With this approach the conventional requirement of complete spectrum analysis is eliminated (unlike conventional spectroscopy), which is expected to expedite the detection of abnormality localization process. Further, the advantages of observing the tissue under white light (normal image) as well as under the specific illumination wavelengths with the same CCD camera are retained, without the need for or change of filters for cutting off the illuminating wavelengths. The proposed concept and system illustrated with rat and nude mouse models is expected to bring in diagnosis and data analysis in a simple whole-field-imaging environment. A variant of the proposed concept in a probe setup is expected to find potential applications in in vivo imaging and disease diagnostics and work is in progress in this direction. AcknowledgmentsThe authors acknowledge the support provided by Nanyang Technological University, Singapore, under grant ACRF18/05 and SBIC, A*STAR for the animal models and preparations support. The authors would like to express their thanks to Biju K P for his help with software programming. VKM and MVM conceived the concept of the study and prepared the manuscript. PP and KB prepared the animal models for the study and provided facilities for the experiments. VKM, PP, SK, and JJ set up the equipment and carried out the experiments. All authors read and approved the final manuscript. ReferencesJ. S. Wanget al.,
“FT-IR spectroscopic analysis of normal and cancerous tissues of esophagus,”
World J. Gastro., 9
(9), 1897
–1899
(2003). WJGAF2 1007-9327 Google Scholar
Q. B. Liet al.,
“Use of Fourier-transform infrared spectroscopy to rapidly diagnose gastric endoscopic biopsies,”
World J. Gastro., 11
(25), 3842
–3845
(2005). WJGAF2 1007-9327 Google Scholar
B. VladimirovE. BorisovaL. Avramov,
“Delta-ALA-mediated fluorescence spectroscopy of gastrointestinal tumors—comparison of in vivo and in vitro results,”
Proc. SPIE, 6727 67271X
(2007). http://dx.doi.org/10.1117/12.752411 Google Scholar
G. Kostenichlet al.,
“Non-invasive tumor detection using spectrally resolved in-vivo imaging,”
Proc. SPIE, 4161 244
–251
(2000). http://dx.doi.org/10.1117/12.409335 Google Scholar
Y. HiraokaT. ShimiT. Haraguchi,
“Multispectral imaging fluorescence microscopy for living cells,”
Cell Struct. Func., 27
(5), 367
–374
(2002). http://dx.doi.org/10.1247/csf.27.367 CSFUDY 0386-7196 Google Scholar
G. Zonioset al.,
“Fluorescence spectroscopy for colon cancer diagnosis,”
Proc. SPIE, 2324 9
–13
(1995). http://dx.doi.org/10.1117/12.198726 PSISDG 0277-786X Google Scholar
T. D. Wanget al.,
“Real-time in vivo endoscopic imaging of fluorescence from human colonic adenomas,”
Proc. SPIE, 3259 18
–26
(1998). http://dx.doi.org/10.1117/12.307335 PSISDG 0277-786X Google Scholar
T. C. Chiaet al.,
“Application of laser-induced autofluorescence spectra detection system in human colorectal cancer in vivo screening,”
Proc. SPIE, 5969 59691I
(2005). http://dx.doi.org/10.1117/12.632130 Google Scholar
M. E. Martinet al.,
“Development of an advanced hyperspectral imaging (hsi) system with applications for cancer detection,”
Annals. Biomed. Eng., 34
(6), 1061
–1068
(2006). http://dx.doi.org/10.1007/s10439-006-9121-9 ABMECF 0090-6964 Google Scholar
E. LindsleyE. S. WachmanD. L. Farkas,
“The hyperspectral imaging endoscope: a new tool for in vivo cancer detection,”
Proc. SPIE, 5322 75
–82
(2004). http://dx.doi.org/10.1117/12.561884 Google Scholar
S. TakehanaM. KanekoH. Mizuno,
“Endoscopic diagnostic system using autofluorescence,”
Diag. Therap. Endo., 5
(2), 59
–63
(1999). DTENER Google Scholar
G. Tycet al.,
“Digital analysis of fluorescent images as a method of assessing the advancement of cancerous disease,”
Proc. SPIE, 5576 330
–333
(2003). http://dx.doi.org/10.1117/12.581840 Google Scholar
M. IgarashiK. Gono,
“Novel endoscopic imaging system for early cancer diagnosis,”
Proc. SPIE, 6432 64320J
(2007). http://dx.doi.org/10.1117/12.714226 Google Scholar
K. Gonoet al.,
“Appearance of enhanced tissue features in narrow-bandendoscopic imaging,”
J. Biomed. Opt., 9
(3), 568
–577
(2004). http://dx.doi.org/10.1117/1.1695563 JBOPFO 1083-3668 Google Scholar
I. Georgakoudi,
“The color of cancer,”
J. Luminesc., 119–120 75
–83
(2006). http://dx.doi.org/10.1016/j.jlumin.2005.12.015 JLUMA8 0022-2313 Google Scholar
|


