|
|
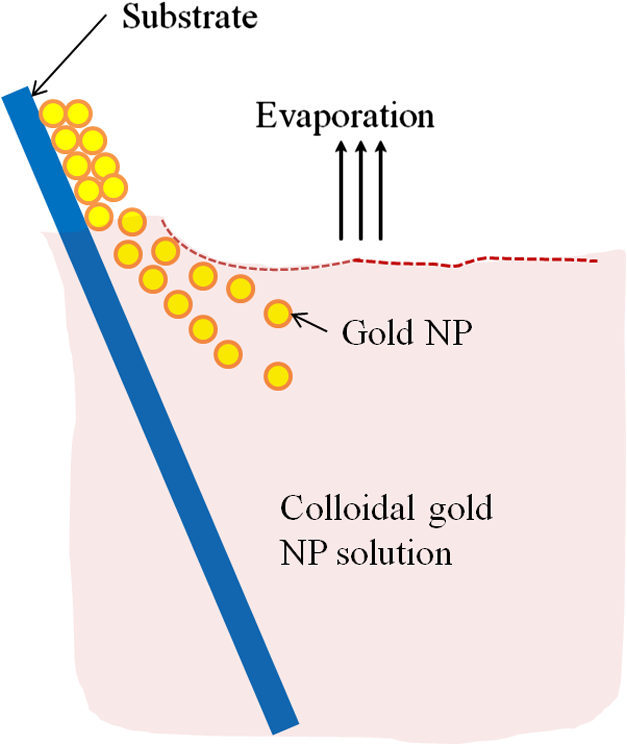
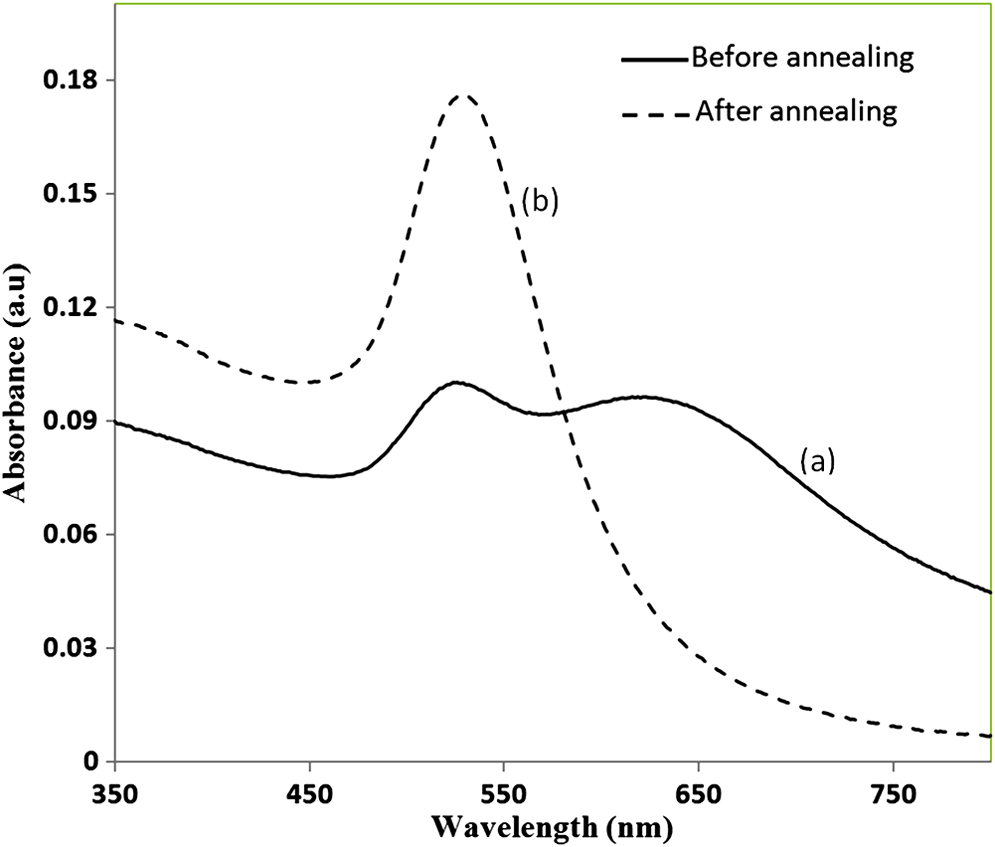
1.IntroductionSomatotropin (ST) is a polypeptidic growth hormone naturally produced by the anterior pituitary gland in mammals. The polypeptide chain for bovine somatotropin consists of 191 amino acids but the composition and the biological effects depend considerably on the species. The biological effects of bovine somatotropin (bST) are associated with growth, development, and reproductive functions. Its effect on milk production was discovered in 1937.1 Since the 80s, recombinant DNA technologies allowed the production of large quantities of hormones that are used in USA and other countries to increase milk production but their use is forbidden in Canada and in the European Union. The use of recombinant bovine somatotropin (rbST) is controversial2–4 because of its potential effects on animal and human health. In order to provide meaningful information to consumers and to identify rbST-treated animals, highly sensitive analytical methods are required. The concentration of bST in various biological media was traditionally estimated using, either an enzyme-linked immunosorbent assay (ELISA)5,6 a radioimmunoassay (RIA)7,8 or bioassay methods.9 The most important limitation of ELISA assays is that the concentration of antibody can only be reported in relative terms such as “titer,” that is, a combination of affinity and concentration. More recently, a sensitive method that allows the discrimination between the recombinant and the endogenous forms of somatotropin has been developed. It is based on liquid chromatography-mass spectrometry combined with electrospray ionization.10–12 The principal drawback of this approach is the complexity of the methodology involved, which, together with the very expensive instrumentation, makes this method difficult to implement for a rapid detection of bST and rbST in milk. For injection preparations of somatotropins, a surface plasmon resonance (SPR) biosensing method has also been suggested.13 However, the measurement was carried out in an expensive plasmonic instrument (Biacore 3000). For this reason, developing a microfluidic biosensing method that allows a rapid and precise detection of growth hormones in milk becomes extremely important. Synthesis of various noble metal nanostructures has been an active area for decades because of the interesting properties and the importance of noble metals to a variety of fields such as photonics, surface-enhanced Raman scattering (SERS)14 optoelectronics, near-field microscopy, and catalysis as well as chemical and biological sensing. Controlling the size, shape, and composition, in the case of bimetallic nanoparticles, the properties of gold and silver nanoparticles can be tailored for different applications. Particularly, the resonance frequency of the localized surface plasmon resonance (LSPR) of gold and silver nanoparticles can be tuned by adjusting the size and morphology or by alloying.15,16 In some cases, the LSPR band could be shifted to the near-infrared region, a region of particular interest for biomedical applications such as cancer hyperthermia.17 Other biological and medical applications of gold nanoparticles and nanostructures can be found in the field of biological labels, biosensors, drug discovery, diagnosis, and monitoring of various diseases. The binding of analytes on immobilized gold nanoparticles changes the local refractive index of the surrounding environment resulting in a shift to longer wavelengths of the corresponding Au LSPR band. Gold and silver spherical nanoparticles with different dimensions and configurations have been widely used to recognize and detect various bio-molecules.18–27 The growing expertise in nanofabrication methods enables the preparation of gold and silver nanostructures and patterns of various complexities. However, most research on chip-based assays has focused on two-dimensional (2-D) structures, that is, a gold monolayer on glass having a low density of nanoparticles.19,20 In order to enhance the sensitivity of detection, multilayers of gold nanoparticles have been fabricated using layer-by-layer deposition28,29 or the immersion of the substrates in the colloidal gold solution for various time intervals.30 Au multilayers, prepared by the layer-by-layer deposition method, showed a higher refractive index sensitivity compared to the monolayer sensors used previously. However, the method is tedious and involves several steps of fabrication as the nanoparticles have to be coated with polyelectrolytes.31 Gold nanostructures for sensing purposes32 or for SERS substrates were deposited by thermal evaporation and sputtering as well.33 For a comprehensive review on the preparation of nanostructured film arrays, see Ref. 34 and references therein. In this work, we report on the fabrication and characterization of three-dimensional (3-D) gold nanostructures fabricated by convective assembly. The mechanism of self-assembly is based on the flow of a colloidal suspension induced by evaporation from the liquid meniscus formed at the substrate-solution interface. The technique of convective assembly relies on the interaction forces between particles and/or particles and surfaces that drive to the formation of ordered arrangements. During the deposition process, due to the strong attraction forces between the gold nanoparticles (NP) and the gold–glass attraction, gold aggregates are formed on the substrates as shown in Fig. 1. The rate of self-assembly is governed by the evaporation from the liquid meniscus, the particle concentration and the particle diameter. The high density of gold nanoparticles in the multilayers and the transparency of the samples allow the use of a conventional ultraviolet (UV)-visible spectrophotometer for the measurements. The proposed method is simple and can be carried out in a general laboratory environment, without any need of special apparatus or expertise. The nanostructure deposited on glass substrates by simple angled deposition resulted in gold aggregates that were further annealed to yield an improved sensing platform. We35 have recently shown that multilayer films, also called 3-D assembled gold nanostructures, can be fabricated from gold nanoparticles by convective assembly from the evaporating meniscus of aqueous suspension. 3-D Au nanostructures display two plasmon bands, one around 520 to 530 nm that belongs to plasmon resonance of isolated gold nanoparticles and a second one at longer wavelengths (600 to 700 nm) due to a collective surface plasmon oscillation.36 The 600 to 700 nm Au band arises from coupling of the individual plasmon resonances when gold nanoparticles are closely spaced. The intensity of this feature is proportional to the degree of aggregation. For a comprehensive discussion on the inter-particle coupling effect, see Ref. 37 and references therein. In our previous work,35 gold nanoparticles and aggregates, functionalized either with a carboxymethylated dextran hydrogel or with 11-mercaptoundecanoic acid, were used for monitoring an antigen-antibody interaction. The results demonstrated that, with spherical nanoparticles, a higher sensitivity of bio-sensing can be achieved by using the shift of gold LSPR band of aggregates toward longer wavelengths. However, because the collective surface plasmon oscillation results in a quite broad band, the detection of the shift upon the binding event is less precise than in the case of the sharp LSPR band corresponding to isolated particles or small aggregates. For this reason, we investigate in this work a post-deposition annealing of gold multilayers for improving the sensitivity of the detection. The present work is focused on the bio-sensing experiments carried out by using gold nanoisland structures obtained by annealing of gold multilayers. The multilayers, with different particle packing densities and degrees of aggregation, are prepared by the convective self-assembly of colloidal gold using a simple oven, instead of complex and tedious processes used by other authors.38,39 11-mercaptoundecanoic acid is used to form a self-assembled monolayer on the gold nanoparticles. The sensing platforms prepared by convective assembly and annealing were tested for the detection of bovine somatotropin (bST) through antigen-antibody interactions. A calibration curve that correlates the shift of Au-LSPR band with the concentration of antigen is established in the range of 5 to and the detection limit of polypeptide is determined. The mechanism of sensing by using the annealed gold nanostructures is also discussed. Further, a microfluidic device having the gold nanoparticles integrated into a microchannel was designed, fabricated and used for the analytical process. 2.Experiment DesignHydrogen tetrachloroaurate (III) trihydrate () was purchased from Alfa Aesar, MA, USA. Sodium citrate, 11-mercaptoundecanoic acid in ethanol (Nano Thinks Acid 11), phosphate buffered saline (PBS), N,N′-diisopropylcarbodiimide and N-hydroxysuccinimide were obtained from Sigma-Aldrich, Canada. The antigen, the natural bovine somatotropine (bST, MW 20 kDa) and its corresponding polyclonal antibody (anti-bST, raised in a guinea pig) were obtained from Dr. Parlow (National Hormone &Peptide Program, Harbor-UCLA Medical Center, CA, USA) and used for the immunoassay. Spherical gold nanoparticles were prepared by using the reduction of chloroauric acid by sodium citrate, following Turkevich’s method.40 Briefly, 75 mL of chloroauric acid solution containing around gold is heated and 5 mL of 1% sodium citrate solution is added to the boiling solution. After the colour of the solution turns to purple, the solution is further boiled for 15 min and then left to cool to room temperature. Gold multilayers were deposited on freshly cleaned substrates. Glass substrates were cleaned with soap and DI water, then rinsed with acetone, dried and finally rinsed with 2-propanol. Before the deposition process, the glass substrates were kept in an oven at 100°C for 1 h. Silanized glass substrates were immersed with an angle () in vials containing the gold colloid solutions (3 to 5 mL) (Fig. 2) and kept in the oven at temperatures between 60°C and 80°C, until the whole amount of gold was transferred to the substrate (one to three days). Nanoparticle multilayer films were post-annealed in a furnace for 1 h at 400°C, 500°C, and 550°C, respectively. Gold nanoparticles were further functionalized with a solution of mercaptoundecanoic acid in ethanol by covering the active surface of the platform (around 150 to 200 μL). For the bio-sensing experiments, the concentration of antibody on the functionalized gold structure was kept constant at and the concentration of antigen was varied between 5 and . The sensitivity of the sensor platform was determined by measuring the spectra of both nonannealed and annealed gold nanostructures in solvents with different refractive indices. The sensor platform was immersed in de-ionized water and, subsequently, in different solvents and kept for 2 h before the spectral measurement. Transmission UV-vis spectra were acquired by using a Perkin-Elmer 650 UV-visible spectrometer. Rectangular quartz cells were used to hold the glass substrates. 2.1.Assembly of the Microfluidic PlatformThe microfluidic structure incorporates three or more parallel microfluidic channels to activate the microfluidic flow between two liquid reservoirs [Fig. 3(a)]. The width of the channel was chosen to be 500 μm by considering two factors: first, the width of the light beam which was and second, the sealing of the channel. Due to the high flexibility of PDMS, sealing of the channel having the width of more than 500 μm is a difficult task as the oxygen plasma treatment is used for the bonding. When the plasma-treated substrates of glass and PDMS were kept together, it was observed that the channel having width higher than 500 μm collapsed. The plasma-treated surfaces exhibit a strong surface attraction force that could be the reason for the collapse of the channel. For this reason, the microfluidic channel was designed with three parallel microchannels of 500 μm, separated by 200 μm. The depth of the microchannel was 100 μm. The microfluidic structure was fabricated on PDMS by soft lithography. The mold for casting the PDMS was fabricated on SU8 photo-resist. Patterning of SU8 was done on a silicon wafer by using UV photolithography. The SU8 mold was silanized to promote the removal of the PDMS structure from the mold. For the fabrication of the microfluidic structure, the PDMS base and curing agent (SYLGARD 184 from Dow Corning, MIDLAND MI, USA) are mixed in a 10∶1 wt ratio, degassed in a vacuum desiccator to remove the gas bubbles, and casted to the mold and baked at 80°C for 5 h. The substrate holding the nanoisland structures is shown in Fig. 3(b). The device [Fig. 3(c)] was fabricated by bonding the glass substrate to a PDMS substrate with the help of oxygen plasma treatment. The glass substrate containing gold nanoisland structures and the PDMS slab containing the microfluidic structure were treated with oxygen plasma for 35 s in a plasma cleaner and bonded together immediately. The inlet and outlet tubes were fixed with the liquid reservoirs using silicone glue. Figure 4 shows photograph of the nanoparticle integrated miocrofluidic bio-sensor. 2.2.Experimental Procedure for the Bio-Sensing ExperimentGold nanoparticles were first functionalized with a solution of mercaptoundecanoic acid in ethanol by covering the active surface of the platform (around 150 to 200 μL). Then the cross-linker solution (N, N′-diisopropylcarbodiimide and N-hydroxysuccinimide) was dropped on the sample to covalently attach the antibody to the gold nanostructures. After 10 min, the spectrum of the functionalized gold is measured. Afterwards, an antibody solution is introduced into the sensing platform and kept in contact with the gold nanostructure for at least 1 h. The change in the position of LSPR corresponding to the binding of antibody was measured. The concentration of antibody on the functionalized gold structure was kept constant and the concentration of antigen was varied between 5 and . The excess of antibody is washed away with a phosphate buffered saline (PBS) solution and a blocker (nonfat milk powder solution) is passed, then the corresponding antigen is added to the sample and the LSPR spectrum is recorded to monitor the change of LSPR corresponding to the antigen-antibody interaction. The procedure is repeated in the microfluidic device by pumping the solution into the device. 3.Results and Discussion3.1.Tuning the Morphology of the 3-D Gold Nanostructure from Nanoaggregates to NanoislandsThe nonannealed samples showed a dark blue coloration [Fig. 5(a)] while the sample annealed at 550°C [Fig. 5(b)] had a red tint. As it can be seen in the Fig. 5(c), the films showed the striping behavior characteristic to samples deposited slowly by convective self-assembly.6,38 It is found that the stripes are uniformly distributed and the spacing between them is constant as long as the deposition temperature is the same. For samples annealed at lower temperatures, the color of the sample is not uniform. The scanning electron microscope (SEM) images corresponding to the two samples are shown in Fig. 6. It can be seen that, before annealing, the nanoparticles are aggregated, forming long chain-shaped structures with several layers of nanoparticles [Fig. 6(a)]. Aggregation begins in the evaporating meniscus because of the strong attractive van der Waals forces between gold nanoparticles.38 The annealed samples show nanoisland morphology [Fig. 6(b)], with large well-separated nanoislands and smaller particles around them. The nanoisland films formed by nucleation and coalescence of gold nanoparticles at 550°C are polydisperse with an average diameter of grains around 70 nm. The density of nanoislands is estimated to be around and it strongly depends on the concentration of gold in the colloidal solution. Fig. 5Images of the nonannealed sample (a), sample annealed at 550°C for 1 h (b) and enlarged images of the samples showing the stripping behavior (c).  Fig. 6SEM images of 3-D gold nanostructures (a) as deposited and (b) after annealing at 550°C for 1 h (the magnification is in both images and in inset).  At temperatures higher than 350°C, for a sample with around of Au in the colloidal solution, clearly separated nanoislands are formed. The islands look like droplets, are elongated (ellipsoid shaped) and their size varies between 10 and 100 nm. The formation of nanoislands upon annealing (at temperatures above 350°C) was widely reported for gold nanostructures prepared by LbL (layer-by-layer) deposition,28,29,40 as well as by thermal33 and electron-beam41 evaporation. The morphology of gold nanoislands generated from LbL assembly depends on the number of layers and the nature of linkers used for building up the multilayer. It has been reported42 that the morphology of ultrathin thermally evaporated films (less than 10 nm) can be tuned to nanoisland-type structures at temperatures as low as 200°C using long annealing times (20 h). The morphology change is thought to be induced by sintering and agglomeration of neighboring nanoparticles and diffusion coalescence, which results in the formation of a single layer of laterally-spaced islands. In the case of the multilayers deposited by angled convective assembly [Fig. 6(a)], having the intertwined chain structure, the gold nanoparticles would melt prior mobility and coalescence. Indeed, it is known that the melting temperature of gold nanoparticles is strongly depressed (tens to hundreds of degrees) due to the particle size. Due to high surface tension of liquid gold, nanoislands with convex surfaces are formed during the annealing process and percolation occurs at a high density of nanoislands. Compared to the aggregated multilayer structure, the nanoisland structure is likely to provide multiple binding sites and enough room for the diffusion of bio-molecules.28 The change in morphology, induced by annealing, is accompanied by a dramatic change in the optical properties as shown in Fig. 7(b). Fig. 7UV-visible spectra of gold nanostructures deposited on glass, (a) before annealing and (b) after annealing at 550°C for 1 h.  The spectra of the nonannealed and the annealed samples were measured in the UV-visible range (Fig. 7). The gold multilayer was deposited by using a solution of gold. Aggregated gold multilayers show a broad band in the 550 to 750 nm regions [Fig. 7(a)]. When heated at 550°C for an hour, the band is blue-shifted to 545 nm and becomes considerably narrower [Fig. 7(b)]. This band belongs to the nanoisland structures shown in Fig. 6(b). The position and the shape of this band clearly show that the island structures are particulate, not aggregated. When the concentration of the gold in solution was reduced to , the band appears to be changed, as shown in Fig. 8. When the gold nanoparticle solution was diluted ( of Au), the spectrum [Fig. 8(a)] shows two bands. The band corresponding to aggregated gold nanostructure is situated around 620 nm showing a lower degree of aggregation and a band at 526 nm. After annealing, the spectrum shows only one narrow band at 529 nm with a noticeable higher absorbance [Fig. 8(b)]. 3.2.Sensing Experiments: Study of the Reproducibility and Sensitivity of Nanoisland SensorsSeveral sensing platforms have been prepared and annealed, and both the position and the absorbance of the LSPR band were measured immediately after annealing and again, after several days. The results show a good reproducibility: for a number of 50 platforms, the position of the peaks after annealing was at . The position of the Au LSPR band belonging to the annealed sample may vary because of the slight differences in the preparation and annealing conditions. However, these variations would not affect the precision of the detection as the shift of the band would be the same. The sensitivity has to be determined because it gives a preliminary assessment of the ability of the platform to be used in the actual biosensing experiment. Hence, it is important to investigate the sensitivity of the LSPR peak to the refractive index, as during the biosensing process, the analytes bind to the gold nanostructure and the refractive index of the environment of the gold nanostructure changes which results in a shift of the LSPR peak. The shift of Au-LSPR () upon the change of refractive index of the local environment of the nanoparticles () is plotted (Fig. 9) and the slope of the curve is measured as the sensitivity of the platform. The shift of Au LSPR band in different solvents, with refractive indices in the range of 1.330 to 1.479 for both the nonannealed and annealed structures is shown in Fig. 9. In order to assess the sensitivity of the sensing platform, the change of UV-visible absorbance of gold nanostructures immersed in various media was investigated before and after annealing. The sensing platforms made of nonannealed and annealed samples are introduced subsequently in the solvents given in Table 1. Fig. 9Sensitivity of the platforms to the change in the refractive index of the environment for the annealed and for the nonannealed sample. (The error bar represents the standard deviation of 10 measurements.)  Table 1Solvents used for measuring the refractive index sensitivity of annealed and nonannealed sensing platforms.
The sample with gold nanostructures is immersed in a cuvette filled with the solvent with a known refractive index. In order to assess the refractive index sensitivity, the following formulas are used: where, is the change in the absorbance peak wavelength, is the absorbance peak wavelength corresponding to the medium with a known refractive index, is the absorbance peak wavelength corresponding to deionized (DI) water, is the difference between the refractive indices of the solvent and that of water, is the refractive index of the solvent, and is the refractive index of water.The sensitivity is assessed by plotting the graph of vs. as illustrated in Fig. 9. The sensitivity is measured by the slope of the graph (Fig. 9). The sensitivity of the nanoisland (annealed) sensor platform is much higher than that of the nonannealed one, more specifically, the sensitivity as calculated from the slope of the lines is found to be , compared to for the nonannealed platform. The higher sensitivity of the annealed samples, in spite of the broad size distribution of nanoislands shown in the SEM image [Fig. 6(b)], can be explained by their sensibly larger surface area than that of particles and aggregates. The large surface area allows the binding of a larger number of molecules (linkers and biomolecules) to gold resulting in a high sensitivity. The binding kinetics of antigen–antibody interaction was investigated by using the annealed gold nanostructures. The antibody and antigen were immobilized on the sample as explained in Sec. 2.2. The binding time as function of shift of LSPR peak is investigated in this study. The experimental results (Fig. 10) carried out on four samples for various time intervals show that around 30 to 40 min are required to complete the antigen—antibody interaction. After 40 min, the shift of LSPR peak remained constant. Fig. 10The shift of LSPR band over the binding time of the antibody () and antigen (). (Error bar represents the standard deviation of 4 measurements.)  The change of LSPR spectra corresponding to each step in the bio-sensing procedure are recorded (Fig. 11) as explained in the Sec. 2.2. A shift of 10 nm was obtained when the concentration of antigen was . The same experiment was repeated for various concentrations of the antigen. Figure 12 shows the shift in LSPR band versus the concentration of the antigen. It can be seen that there is quite a large red shift of the band due to the antibody-antigen recognition event. For the sensing experiments, only the most concentrated () gold solution was used, which resulted in high density nanoisland samples. Sensing experiments have been performed with concentrations of antigen in the range of 5 to and a calibration curve was established. The calibration curve (Fig. 12) shows that the shift of AuLSPR band () is proportional to the concentration in the range of 1 to (with sensitivity). At higher concentrations, the shift is still linear but the sensitivity is considerably lower. However, for practical purposes, the low concentrations range (high sensitivity) is important. The detection limit for bST, by using a nanoisland film was found to be . Fig. 11Spectra corresponding to a concentration of bST (antigen). Annealed gold nanostructure (550°C) (a), antibody was adsorbed on the sample (b) and the antigen was adsorbed on the gold holding the antibody (c). The shift due to antibody-antigen interaction is 10 nm. For clarity, the spectra corresponding to different intermediate states (functionalized gold nanoparticles, activated carboxyl group, etc.) are omitted.  3.3.Sensing Experiments in a Microfluidic DeviceThe microfluidic device was used instead of the cuvette in the spectrophotometer for the sensing experiments carried out in the device. A similar device, without nanoparticles was used as reference cell for the measurement. In this setup (Fig. 13), the light beam from a UV-visible source is splitted into two parallel beams and the sensing and the reference devices were placed vertically in the light paths. The sensing procedure as explained in Sec. 2.1 was repeated with the device, and all the sensing steps were carried out by pumping the solutions into the microfluidic channel by using the syringe pump. The absorbance spectra were recorded with the microfluidic device (Fig. 14). The curve in Fig. 14(a) shows the Au LSPR band before starting the sensing experiment. The Au-LSPR band was recorded [Fig. 14(b)] after absorbing the antibody of bST on the functionalized nanoparticles through pumping the solution in the microfluidic channel. The curve in Fig. 14(c) shows the LSPR band upon introducing the corresponding antigen. A shift of LSPR band of around 10 nm is recorded upon the interaction of the antigen () and antibody (). The shift of LSPR band is the same as the sensing results obtained on the glass sample (Fig. 11). Several experiments (3 to 4 measurements) were carried out in the device and they confirmed the reproducibility of the method (Fig. 15). The sensing curve of gold nanoisland structure on glass samples (Fig. 12) is also included in the Fig. 15 for comparison. 4.ConclusionA novel and simple method of preparation of multilayers of gold nanoparticles on glass substrates is reported. The nanostructure obtained from the angled deposition method shows chain-shaped structures with a broad UV-visible absorbance spectrum. The morphology of the nonannealed structures was modified to an island-like structure by annealing at various temperatures. The sensitivity of both nonannealed and annealed platforms was investigated by using solvents with known refractive indices. The sensing results showed a higher sensitivity for the annealed samples. The annealed platform was used for the sensing of bovine somatotropin (bST) by using an immunoassay format. The proposed sensing platform showed a detection limit as low as of bST. Further, the sensing platform was integrated into a microfluidic device and sensing experiments were carried out. The results demonstrated the suitability of nanoisland structures, integrated into a lab-on-a-chip device to detect bovine somatotropin with a good sensitivity. AcknowledgmentsAuthors would like to thank Développement économique, innovation et exportation (MDEIE) Québec and Valeo Gestion for the financial support for the project. ReferencesG. S. AsimovN. K. Krouze,
“The lactogenic preparations from the anterior pituitary and the increase in milk yield from cows,”
J. Dairy Sci., 20
(6), 289
–306
(1937). http://dx.doi.org/10.3168/jds.S0022-0302(37)95698-4 JDSCAE 0022-0302 Google Scholar
F. H. Buttel,
“The recombinant BGH controversy in the United States: toward a new consumption politics of food?,”
Agr. Human Values, 17
(1), 5
–20
(2000). https://doi.org/10.1023/A:1007636911210 AHVAEO Google Scholar
J. Burkhardt,
“On the ethics of technical change: the case of bST1,”
Technol. Soc., 14
(2), 221
–243
(1992). http://dx.doi.org/10.1016/0160-791X(92)90005-U Google Scholar
J. J. MolnarK. A. CumminsP. F. Nowak,
“Bovine somatotropin: biotechnology product and social issue in the United States dairy industry,”
J. Dairy Sci., 73
(11), 3084
–3093
(1990). http://dx.doi.org/10.3168/jds.S0022-0302(90)78996-5 JDSCAE 0022-0302 Google Scholar
L. Castigliegoet al.,
“Natural and recombinant bovine somatotropin: immunodetection with a sandwich ELISA,”
J. Dairy Res., 74
(01), 79
–85
(2007). http://dx.doi.org/10.1017/S0022029906002159 0022-0299 Google Scholar
X. Zhaoet al.,
“Somatotropin and insulin-like growth factor-I concentrations in plasma and milk after daily or sustained-release exogenous somatotropin administrations,”
Domest. Anim. Endocrinol., 11
(2), 209
–216
(1994). http://dx.doi.org/10.1016/0739-7240(94)90028-0 DANEEE 0739-7240 Google Scholar
S. K. JindalR. S. Ludri,
“Growth hormone concentration in lactating crossbred cows and buffaloes,”
Asian-Australian J. Anim. Sci., 3
(4), 319
–322
(1990). JDSCAE 0022-0302 Google Scholar
P. Groenewegenet al.,
“Bioactivity of milk from rbST treated cows,”
J. Nutr., 120
(5), 514
–520
(1990). 0022-3166 Google Scholar
C. M. ZwicklH. W. SmithP. H. Bick,
“Rapid and sensitive ELISA method for the determination of bovine somatotropin in blood and milk,”
J. Agric. Food Chem., 38
(6), 1358
–1362
(1990). http://dx.doi.org/10.1021/jf00096a013 JAFCAU 0021-8561 Google Scholar
M. L. Scippoet al.,
“Identification of bovine somatotropine-treated cows; Identification des vaches laitieres traitees a la somatotropine bovine,”
Annales De Medecine Veterinaire (Belgium),
(5), 381
–390
(1997). AMVRA4 Google Scholar
N. Rochutet al.,
“ESI-MS for the measurement of bovine and porcine somatotropins: mass spectrometry for the study of natural mechanisms,”
Analysis, 28
(4), 280
–284
(2000). http://dx.doi.org/10.1051/analusis:2000280280 0003-2638 Google Scholar
M. H. Le Bretonet al.,
(2008). Google Scholar
T. H. J. Heutmekerset al.,
“A rapid surface plasmon resonance (SPR) biosensor immunoassay for screening of somatotropins in injection preparations,”
Anal. Chim. Acta, 586
(1–2), 239
–245
(2007). http://dx.doi.org/10.1016/j.aca.2006.11.047 ACACAM 0003-2670 Google Scholar
V. CanpeanS. Astilean,
“Multifunctional plasmonic sensors on low-cost subwavelength metallic nanoholes arrays,”
Lab Chip, 9
(24), 3574
–3579
(2009). http://dx.doi.org/10.1039/b914235e LCAHAM 1473-0197 Google Scholar
D. Stuartet al.,
“Biological applications of localised surface plasmonic phenomenae,”
IEE Proc.-Nanobiotechnol.,
(1), 13
–32
(2005). http://dx.doi.org/10.1049/ip-nbt:20045012 1478-1581 Google Scholar
A. J. Haeset al.,
“Detection of a biomarker for Alzheimer's disease from synthetic and clinical samples using a nanoscale optical biosensor,”
J. Am. Chem. Soc., 127
(7), 2264
–2271
(2005). http://dx.doi.org/10.1021/ja044087q JACSAT 0002-7863 Google Scholar
B. G. Prevoet al.,
“Scalable routes to gold nanoshells with tunable sizes and response to near-infrared pulsed-laser irradiation,”
Small, 4
(8), 1183
–1195
(2008). http://dx.doi.org/10.1002/smll.v4:8 1613-6829 Google Scholar
N. NathA. Chilkoti,
“A colorimetric gold nanoparticle sensor to interrogate biomolecular interactions in real time on a surface,”
Anal. Chem., 74
(3), 504
–509
(2002). http://dx.doi.org/10.1021/ac015657x ANCHAM 0003-2700 Google Scholar
N. NathA. Chilkoti,
“Label-free biosensing by surface plasmon resonance of nanoparticles on glass: optimization of nanoparticle size,”
Anal. Chem., 76
(18), 5370
–5378
(2004). http://dx.doi.org/10.1021/ac049741z ANCHAM 0003-2700 Google Scholar
N. NathA. Chilkoti,
“Label free colorimetric biosensing using nanoparticles,”
J. Fluoresc., 14
(4), 377
–389
(2004). http://dx.doi.org/10.1023/B:JOFL.0000031819.45448.dc JOFLEN 1053-0509 Google Scholar
A. L. WeikelS. D. ConklinJ. N. Richardson,
“A multiple reflection attenuated total reflectance sensor incorporating a glass-indium tin oxide surface modified via direct attachment or film encapsulation of colloidal gold nanoparticles,”
Sens. Actuators B: Chem., 110
(1), 112
–119
(2005). Google Scholar
F. Frederixet al.,
“Biosensing based on light absorption of nanoscaled gold and silver particles,”
Anal. Chem., 75
(24), 6894
–6900
(2003). http://dx.doi.org/10.1021/ac0346609 ANCHAM 0003-2700 Google Scholar
J. C. Hulteenet al.,
“Nanosphere lithography: size-tunable silver nanoparticle and surface cluster arrays,”
J. Phys. Chem. B, 103
(19), 3854
–3863
(1999). http://dx.doi.org/10.1021/jp9904771 JPCBFK 1520-6106 Google Scholar
F. Fidaet al.,
“Gold Nanoparticle Ring and Hole Structures for Sensing Proteins and Antigen—Antibody Interactions,”
Plasmonics, 4
(3), 201
–207
(2009). http://dx.doi.org/10.1007/s11468-009-9093-3 1557-1955 Google Scholar
K. Fujiwaraet al.,
“Measurement of antibody binding to protein immobilized on gold nanoparticles by localized surface plasmon spectroscopy,”
Anal. Bioanal. Chem., 386
(3), 639
–644
(2006). http://dx.doi.org/10.1007/s00216-006-0559-2 ABCNBP 1618-2642 Google Scholar
M. D. Malinskyet al.,
“Chain length dependence and sensing capabilities of the localized surface plasmon resonance of silver nanoparticles chemically modified with alkanethiol self-assembled monolayers,”
J. Am. Chem. Soc., 123
(7), 1471
–1482
(2001). http://dx.doi.org/10.1021/ja003312a JACSAT 0002-7863 Google Scholar
J. Yeet al.,
“Enhanced localized surface plasmon resonance sensing on three-dimensional gold nanoparticles assemblies,”
Colloids Surf. Physicochem. Eng. Aspects, 321
(1–3), 313
–317
(2008). http://dx.doi.org/10.1016/j.colsurfa.2008.01.028 Google Scholar
L. GuoG. ChenD. H. Kim,
“Three-dimensionally assembled gold nanostructures for plasmonic biosensors,”
Anal. Chem., 82
(12), 5147
–5153
(2010). http://dx.doi.org/10.1021/ac100346z ANCHAM 0003-2700 Google Scholar
F. Toderaset al.,
“Controlling gold nanoparticle assemblies for efficient surface-enhanced Raman scattering and localized surface plasmon resonance sensors,”
Nanotechnology, 18
(25), 255702
(2007). http://dx.doi.org/10.1088/0957-4484/18/25/255702 NNOTER 0957-4484 Google Scholar
X. Wanget al.,
“Self-organized multilayer films and porous nanocomposites of gold nanoparticles with octa(3-aminopropyl)octasilsesquioxane,”
J. Inorg. Organomet. Mater., 17
(2), 447
–457
(2007). https://doi.org/10.1007/s10904-007-9128-1 Google Scholar
S. SzuneritsM. R. DasR. Boukherroub,
“Short-and long-range sensing on gold nanostructures, deposited on glass, coated with silicon oxide films of different thicknesses,”
J. Phys. Chem. C, 112
(22), 8239
–8243
(2008). http://dx.doi.org/10.1021/jp800478h 1932-7447 Google Scholar
S. Szuneritset al.,
“Gold island films on indium tin oxide for localized surface plasmon sensing,”
Nanotechnol., 19
(19), 195712
(2008). http://dx.doi.org/10.1088/0957-4484/19/19/195712 NNOTER 0957-4484 Google Scholar
Y. FlegerM. Rosenbluh,
“Surface plasmons and surface enhanced raman spectra of aggregated and alloyed gold-silver nanoparticles,”
Res. Lett. Optics, 2009 1
–6
(2009). https://doi.org/10.1155/2009/475941 Google Scholar
Y. S. Shonet al.,
“Preparation of nanostructured film arrays for transmission localized surface plasmon sensing,”
Plasmonics, 4
(2), 95
–105
(2009). http://dx.doi.org/10.1007/s11468-009-9079-1 1557-1955 Google Scholar
J. OzhikandathilS. BadilescuM. Packirisamy,
“Synthesis and optical properties of immobilized spherical and non-spherical gold nanoparticles for detection of polypeptides and microfluidics applications,”
in International Conf. on Nanotechnology; Fundamentals and Applications,
(2010). Google Scholar
K. C. Grabaret al.,
“Preparation and characterization of Au colloid monolayers,”
Anal. Chem., 67
(4), 735
–743
(1995). http://dx.doi.org/10.1021/ac00100a008 ANCHAM 0003-2700 Google Scholar
S. K. GhoshT. Pal,
“Interparticle coupling effect on the surface plasmon resonance of gold nanoparticles: from theory to applications,”
Chem. Rev., 107
(11), 4797
–4862
(2007). http://dx.doi.org/10.1021/cr0680282 CHREAY 0009-2665 Google Scholar
J. J. Diaoet al.,
“Surface vertical deposition for gold nanoparticle film,”
J. Phys. D, 36
(3), L25
–L-27
(2003). http://dx.doi.org/10.1088/0022-3727/36/3/101 JPAPBE 0022-3727 Google Scholar
B. G. PrevoO. D. Velev,
“Controlled, rapid deposition of structured coatings from micro-and nanoparticle suspensions,”
Langmuir, 20
(6), 2099
–2107
(2004). http://dx.doi.org/10.1021/la035295j LANGD5 0743-7463 Google Scholar
J. TurkevichP. C. StevensonJ. Hillier,
“A study of the nucleation and growth processes in the synthesis of colloidal gold,”
Discuss. Faraday Soc., 11
(0), 55
–75
(1951). http://dx.doi.org/10.5012/bkcs.2010.31.02.291 BKCSDE 0253-2964 Google Scholar
P. J. AletL. EudeS. Palacin,
“Transition from thin gold layers to nano-islands on TCO for catalyzing the growth of one-dimensional nanostructures,”
Phys. Status Solidi (a), 205
(6), 1429
–1434
(2008). https://doi.org/10.1002/pssa.200778158 Google Scholar
I. Doron-Moret al.,
“Sensitivity of transmission surface plasmon resonance (t-spr) spectroscopy: self-assembled multilayers on evaporated gold island films,”
Chem.–Eur. J., 11
(19), 5555
–5562
(2005). 0947-6539 Google Scholar
|