
|
|
1.IntroductionThe incidence and mortality rates of skin cancer have increased dramatically during the last decade until it has become the malignancy with the highest incidence in the Brazilian population. In 2012, the estimated incidence of nonmelanoma skin cancer in Brazil is about 134,000 new cases.1 The high incidence of skin cancer in Brazil is related to the long exposure of workers/farmers to sunlight in the countryside, and of people pursuing leisure (mainly the beach). Despite a permanent government campaign urging people to avoid unprotected exposure to sunlight,2 which would ultimately reduce the incidence rate of skin neoplasias, only early detection would help to decrease mortality rates. Biopsy of suspicious lesions followed by histopathological analysis is considered the gold standard for skin cancer diagnosis. In spite of different clinical presentations for basal cell carcinoma (BCC) lesions, the most pronounced characteristic is an asymptomatic nodule of rosy or translucid lesion, with either a pearly, flat, and shiny aspect or ulcerated appearance, containing telangectasic vessels.3 Skin melanoma (MEL) appears initially as a dark lesion with progressively increasing size, accompanied by alterations in the original color, pigmented dots at the lesion border, ulcerations, and bleeding followed by pain, itching, or inflammation.4 Diagnosis is performed by well-trained specialists able to differentiate among common skin pigmented lesions. Up to 50% of early malignant skin lesions may escape detection during clinical routine examinations, while experts achieve an 80% to 90% success rate of detection.5 The challenge for modern medicine is to develop an analytical technique that relies upon the morphological and biochemical changes in different tissues, and could give early diagnostic information in real time, noninvasively and nondestructively, in situ. Vibrational spectroscopy, particularly Raman spectroscopy, has the potential to diagnose and study the evolution of human malignancies both in vitro and in vivo in prostate,6,7 esophagous,8 stomach,9 lung,10,11 breast,12,13 and arteries,14–16 among others. Abnormal tissues have differences in their morphology and biochemistry, reflected in the levels of proteins, lipids, and nucleic acids observed compared with normal tissues; these are mainly caused by differences in neoplastic metabolism, or changes in cellular and subcellular structures and functions.6,17–19 These changes should be detectable by Raman spectroscopy and, therefore, this technique has been considered a promising tool to discriminate the progression from benign to malignant tissues in different pathologies in vivo.17 The use of near-infrared excitation (typically 785 or 830 nm from diode lasers) has the important advantage of decreased sample fluorescence in biological specimens.14,20 The use of a fiber-optic Raman probe would provide the capability to perform specific molecular fingerprinting and analysis in in vivo experiments,13,16,17,21 and detect skin tissue alterations using higher wavenumbers.22 Automated Raman systems for rapid in vivo biological tissue evaluation in less than 1 s have been proposed.16,21 Spectral differences between nonmelanoma and melanoma cancers in skin tissues have been studied by Raman spectroscopy.5,22–30 It has been proposed that Raman confocal microspectroscopy be employed to observe spectral differences in tissue ultra structures in biopsy fragments from normal and BCC in order to provide diagnosis of neoplasia.28–30 Raman spectroscopy has been employed to discriminate BCC from normal skin cancer in vitro through Artificial Neural Network Analysis and Principal Components Analysis algorithms,23,25 and through a simplified biochemical model using spectra of tissue constituents (collagen and cell fat features).31 A multimodal imaging spectroscopic approach (fluorescence, Raman, and 2nd harmonic generation) has been proposed to elucidate the morphochemistry of BCC.32 Recent studies indicated the applicability of Raman spectroscopy to clinically detect secure surgical boundaries in nonmelanoma skin tumor removal procedures.26 In the case of Raman spectra for discriminating MEL, investigators have used FT-Raman (1064 nm excitation) to discriminate between commonly found skin lesions which can be confused with melanoma (BCC, nevi, and keratosis).33 These studies have indicated a high sensitivity for differential diagnosis among MEL and pigmented nevus in vivo using 785 nm excitation,34 and among MELs from BCC and squamous cell carcinoma, with a maximum sensitivity and specificity of 100% using near-infrared Raman microspectroscopy.29 The amount of water in skin lesions also has been measured, indicating that BCC and MEL have higher water contents compared to normal tissues.35 Recently, a number of studies proposed that the absolute or relative concentrations of most relevant biochemicals and morphological structures present in a particular tissue sample could be estimated using the Raman spectra of such biochemicals or morphological structures linearly fitted to the spectra of tissue samples.6,9,11,13,14,18,19,31 Then tissue discrimination and disease grading could be performed by comparing the alterations in these compounds that occur in each tissue type, using a suitable discrimination technique. The application of such a spectral model, based on the biochemical constitution of altered skin compared to normal tissue, would help reveal the most pronounced spectral features responsible for the observed skin tissue spectra, and develop a diagnostic tool based on spectral changes which accompany morphological and biochemical changes. The objective of this work is to use near-infrared Raman spectroscopy to develop a spectral model based on the estimated Raman contribution of selected basal biochemical compounds including particular proteins, lipids, amino acids, and nucleic acids to the observed Raman signal obtained from normal and neoplastic (BCC and MEL) skin tissues in vitro, obtained by modeling a linear least-square fitting of the selected biochemicals. These contributions are then used in a discriminating model in order to group such tissues according to the differences in the estimated contribution of each biochemical, which can be related to the differences in tissue constitution. 2.Materials and MethodsThis study followed Brazilian guidelines for research with humans/human materials, and was approved by the Council on Ethics in Human Research (CEP)—Unicastelo. Skin tissue fragments of about 2 mm were withdrawn from the center of resected lesions obtained from excisional biopsies, snap frozen, and stored in liquid nitrogen () for spectroscopic study. Before collecting the near-infrared, dispersive Raman spectra, all samples were warmed to room temperature and kept moisturized with 0.9% saline solution. Saline solution is known not to interfere with spectral collection, since the concentration of the NaCl is very low, and the Raman band for the dissolved electrolytes present as mono-atomic ions is not Raman active.36 We used a portable near-infrared, dispersive Raman system (P-1 Raman system, Lambda Solutions, Inc. MA, USA), with an 830 nm excitation, adjustable laser power up to 350 mW, and spectral resolution of about in the range of 400 to . The spectrometer was connected to a Raman probe (Vector probe, Lambda Solutions, Inc. MA, USA) about 3 m long, with band pass and rejection pass filters. The , back thinned, deep depleted CCD was cooled (Peltier) down to to decrease thermal noise. For spectral collection, each humid tissue fragment was placed in a sample holder made of aluminum; then the probe was placed at a 10 mm distance perpendicular to the tissue surface. The signal scattered by each sample was then collected by the probe and coupled to the signal port of the P-1 spectrometer for dispersion and detection. The gross spectra were then stored. Each sample was referred for reading on the same day and experimental conditions (temperature and humidity). The Raman signal was collected in 5 and 10 s scans for all samples. By increasing the number of scans, we increased the signal-to-noise ratio (SNR) by the root square of the number of scans while not changing spectral resolution.37 The laser power was set to 200 mW for normal and BCC samples, and reduced to 50 mW for melanoma samples, in order to avoid thermal damage due to the strong absorption from melanin. The procedures of spectra calibration (pixel to Raman shift correlation and spectrometer spectral response correction) were performed using the software Matlab (The Mathworks, version 5.2), following a procedure described elsewhere.38 Background fluorescence was removed by a baseline correction function in commercially available software such as OriginPro. In this approach, straight lines are drawn at selected positions in the spectrum to create a baseline, and then these lines are subtracted from the gross spectrum. Cosmic rays were removed manually. After calibration and pre-processing, spectra were normalized according to the most intense band around , mean-centered, and plotted in the spectral range of 400 to . Two to five spectra were collected from each fragment, for a total of 47 samples with the following diagnostics confirmed by histopathology: 15 normal skin samples (N), 29 BCCs, and 4 MELs. We also collected spectra from one sample of keratosis, one sample of poroma, and one sample of fibrosis, which were withdrawn due to the small number of samples. Some melanoma spectra presented very low SNRs (due to background fluorescence) and were also withdrawn from the study. A total of 30 spectra from normal, 96 spectra from BCC, and 19 spectra from MEL tissues were considered for analysis. We developed a spectral model based on the relative Raman contribution of selected basal biochemical compounds responsible for Raman bands that are present in N, BCC, and MEL skin tissues. These biochemicals were chosen based on their probable occurrence in skin tissues, and likely responsibility for the spectral features that differentiate both neoplasias from normal sites. The biochemicals (Table 1) were bought from Sigma-Aldrich Brazil or donated from Terapêutica Farmácia de Manipulação, São José dos Campos, SP, Brazil, and most of the spectra were collected from the pure form (as received); some were diluted in water. The time exposure for collecting those spectra varied from 0.01 to 0.1 s for amino acids, 0.1 to 1 s for proteins, nucleic acids and lipids, and 1 to 2 s for carbohydrates and phospholipids. Laser power was set to 300 mW, exception for the pigments, when it was set to 50 mW. These spectra were also submitted to pre-processing and normalization according to the most intense band. Table 1List of the biochemicals used in the model and origin of them in the skin structure.
The spectral model was developed by calculating the relative Raman contribution of the selected biochemicals in each tissue fragment using the unique biochemical information (fingerprint) provided by the spectra for each pure compound. Fitting the spectra of tissue constituents to the spectra of skin tissues was performed using ordinary least-square analysis, according to the expression:6 where is the original spectrum, is the spectral matrix of selected tissue constituents, and is the matrix of their relative spectral contribution (fit parameter) predicted by the model. This expression can be used to provide a “best fit” of the spectral components or basis spectra found within the measured spectrum. The assumption is made that the spectral components selected are a linear superposition of the main spectral components of the spectra,6,14 as and any residual is minimized.6 To obtain the predicted relative spectral contribution of the biochemical in each tissue type, one can perform the following calculation using ordinary linear least-squares fitting:39Observation of the fitting residual enabled the quality of the fit to be observed. The fitting residual was calculated as follows: where the index is the spectrum intensity at each discrete Raman shift. Since not all constituents are relevant to the observed spectra, the model included primarily the biochemicals that presented Raman bands visually closer to the ones found in N, BCC, and MEL tissues which ultimately resulted in nonnegative mean relative spectral contributions for at least two tissue types.The Euclidean distance was employed to separate the dataset into classes according to the histopathology (discriminant analysis), by determining the least linear distance from a specific point to the center (mean) of the class to which it was thought to belong, and comparing the distance to the vicinity group. The Euclidean distance follows the expression:40 where is the vector of sample intensities (in our case it is the estimated ) and is the mean of the group. To choose which basal compound would give the best classification, we employed analysis of variance (ANOVA) with 5% significance level and chose the biochemical with the highest significance level. We then calculated the Euclidean distances of several binary combinations of compounds to discriminate a sample of one class with respect to the remaining classes. Sensitivity, specificity, and overall accuracy41 were calculated for each compound combination.The least-squares model was developed under Matlab 5.2 (Mathworks, version 5.2), as well as the calculations of the residuals and the Euclidean distances. 3.ResultsFigure 1 shows the average normalized Raman spectra of N, BCC, and MEL skin tissues in the range of 400 to . The observable Raman bands of skin can be assigned mainly to proteins/amino acids, lipids/phospholipids, and nucleic acids as shown in Table 2. Important spectral differences were found in the regions between 800 to and 1200 to , corresponding to bands assigned to nucleic acids, lipids, and, primarily, proteins. Almost all peaks showed statistically significant differences between tissue types (, ANOVA). Fig. 1Mean normalized Raman spectra of N, BCC, and MEL with vertical dotted lines labeling the peaks described in Table 2. Laser power: 150 mW, wavelength: 830 nm, spectral resolution: , integration time: 2 s, number of scans: 10. Spectra were offset for clarity. 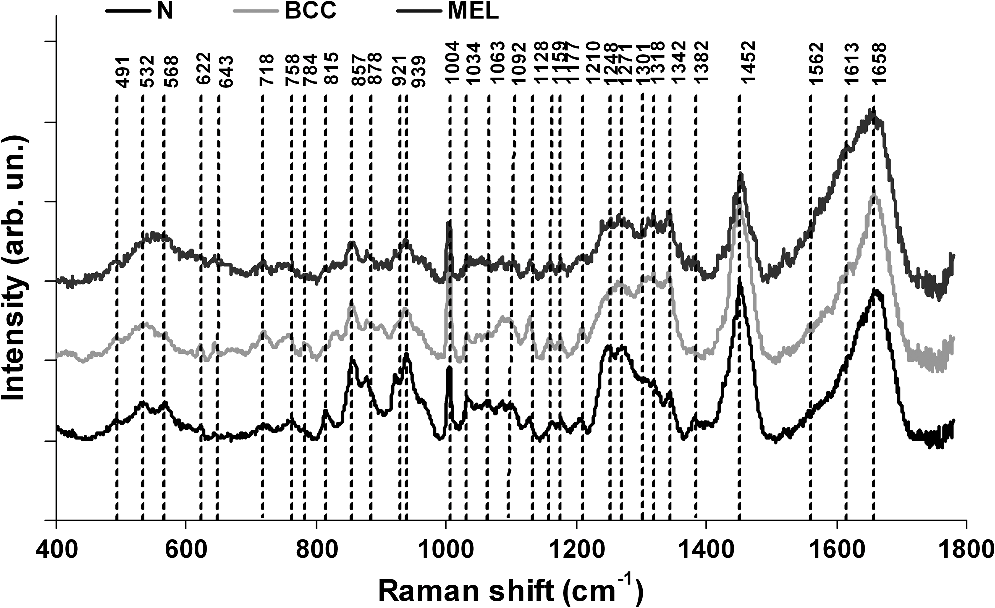 Table 2Peak positions of main Raman bands of N, BCC and MEL skin tissues with the respective tentative assignments.
The spectrum of normal skin had features of proteins present in the dermis (mainly actin, collagen, and elastin) that can be identified by bands at 857, 939, 1004, 1248, 1271, 1452, and , as well as several other weaker vibrations in the 400 to region. The bands at 1063, 1128, the region from 1270 to 1300, and at , could be attributed to the saturated fatty acids of ceramides in the epidermis, and the phospholipids sphyngomyelin and phosphatydilcholine in the cell membrane. The band at could also be attributed to phospholipids. Spectral features arising from unsaturated lipids (mainly triolein from adipocytes) in the skin appeared mainly at 1092, 1271, 1301, 1452, and . BCC skin had several spectral features in the same positions as normal skin, indicating similar biochemical constitution, with remarkable differences in the intensities in the 800 to and 1200 to ranges compared with normal. Also, small peaks in the 600 to region, and peaks at 1004, 1092 and were of higher intensity in BCC, indicating a higher lipid content, which could be relevant for spectral diagnosis. The melanoma spectrum was characterized by strong near-infrared fluorescence (not shown) from the melanin. Due to this fact, laser power was reduced to 50 mW to avoid tissue burning and CCD saturation. Despite the higher noise level of melanin spectra due to the strong melanin fluorescence, the spectral features were likely closer to the ones found in N tissues in the regions 600 to and 1200 to , with the peaks at 1092 and . In order to evaluate differences in the relative amount of the most relevant tissue biochemicals that were responsible for the Raman bands in normal and malignant skin tissues, a spectral model was developed based on the relative contribution of those biochemicals found in each tissue, by using the Raman spectra of pure compounds and calculating the fit parameter of all biochemicals within the tissue spectrum according to least-squares minimization following Eq. (2). Figure 2 shows the spectra of biochemicals that presented bands close to the ones found in spectra of normal and malignant skin tissues in which the fit parameter resulted in nonnegative contribution in at least two tissue types. Most spectra were collected from the biochemicals as they were purchased; phenylalanine and melanin were diluted in water. Fig. 2Raman spectra of the most relevant biochemicals used in the spectral model. Wavelength: 830 nm, spectral resolution: .  Figure 3 presents the calculated mean relative Raman contribution of the biochemicals according to each tissue type. It has been found a statistically significant difference in the fitting parameter of the selected biochemicals relative to tissue types (, ANOVA). In Fig. 4, one can observe the resulting spectral model, in which the basal spectra multiplied by the estimated fit parameter, were superimposed upon the mean spectra of N, BCC, and MEL. The corresponding fitting residual for each tissue mean spectra showed good agreement with the spectral model. Fig. 3Plot of the mean and standard deviation of the relative Raman contribution (fit parameter ) of each basal compound used in the model for each tissue type. 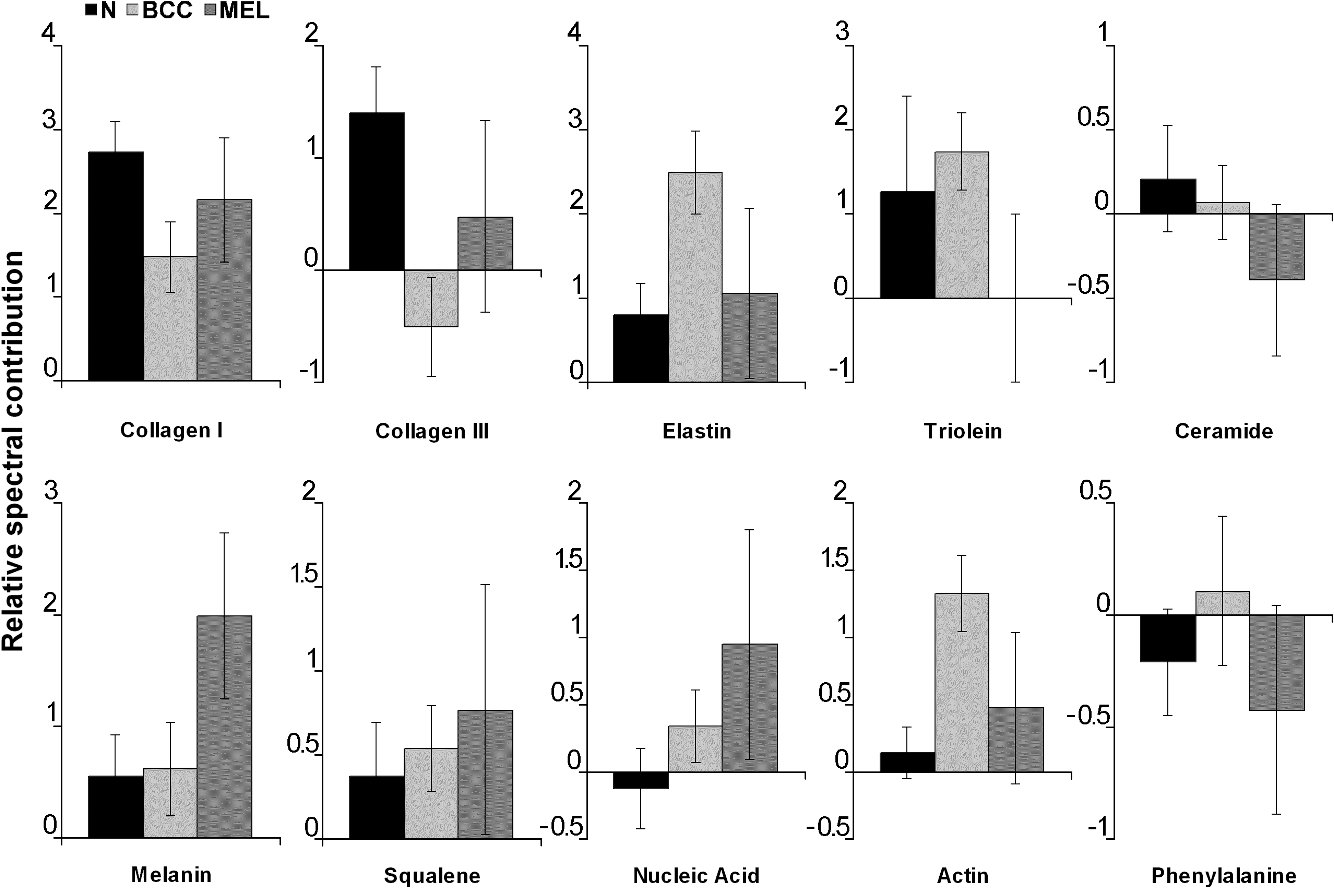 Fig. 4Plot of the mean Raman tissue spectra and the mean spectra of the model fit, with the mean residual spectrum (left) and the corresponding percentage of the residues of the fitting for each tissue fragment (right) for A: N, B: BCC, and C: MEL.  In order to develop a discrimination model for tissue classification in N, BCC, and MEL based on the estimated Raman contribution of the selected biochemicals, pairs of biochemicals with greater significance in their fit parameters for N and BCC (actin, collagen III, and elastin), for BCC and MEL (actin, melanin, and triolein), and for N and MEL (melanin and nucleic acid), were plotted on a binary scale and the Euclidean distances were calculated. Figure 5 shows the scatter plots for collagen III versus melanin, actin versus melanin and nucleic acid versus actin. Actin versus nucleic acid showed the highest discrimination capability. We also tested combinations of three basal compounds; Fig. 6 shows a 3-D scatter plot of collagen III versus elastin versus melanin. Table 3 shows the sensitivity, specificity, and accuracy of discrimination results using these biochemicals. The combination of collagen III, elastin, and melanin showed better discrimination among groups (Euclidean surfaces not plotted), and higher sensitivity and specificity values. Fig. 5Scatter plot of the fit parameter of actin, collagen III, melanin and nucleic acid predicted by the model. Separation of N, BCC, and MEL was done according to the mean Euclidean distance between groups.  Fig. 63-D scatter plot of the fit parameter of collagen III, elastin, and melanin estimated by the spectral model. The Euclidean distance separation surface is not shown. 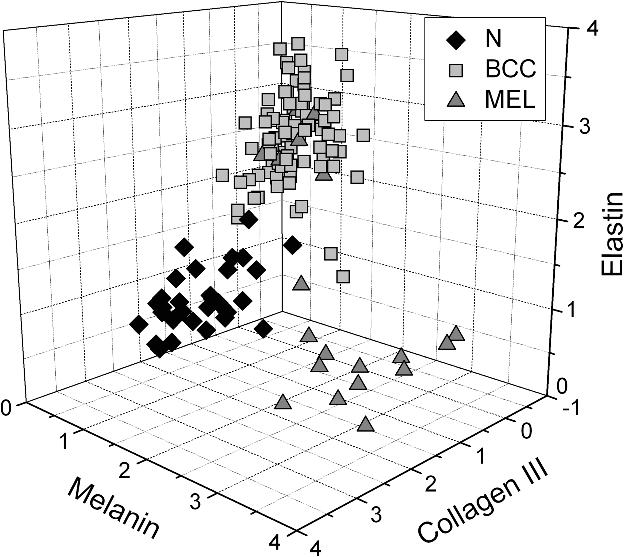 Table 3Results of the discrimination model in terms of absolute values and sensitivity, specificity, and accuracy. 4.DiscussionSeveral authors have proposed the use of spectral models to estimate the relative contribution of important biochemicals in Raman spectra of bio-tissues for cancer diagnosis.6,11,13,18,19,31 Haka et al.13 used a morphological/biochemical model to correlate changes in the amounts of fat (adipocytes), collagen, cholesterol, and calcium oxalate in the cell nucleus and cytoplasm, aiming at breast cancer diagnosis in vivo. Brennan III et al.14 used Raman spectra from human coronary arteries for in situ histochemical analysis, accessing the amounts of cholesterol, cholesterol esters, triglycerides, phospholipids, and calcium salts. Motz et al.11 used a Raman probe connected to a near-infrared Raman spectrometer to scan carotid arteries in vivo in order to access the biochemical constitution of plaques, including cholesterol, collagen, and adipocytes (adventitial fat) present in the sample, correlating the plaque composition with plaque vulnerability. Stone et al.6 diagnosed urological pathologies (bladder and prostate cancer) through Raman spectroscopy, by quantifying differences in actin, collagen, choline, triolein, oleic acid, cholesterol, and DNA, assessing the gross biochemical changes in each pathology. To biochemically evaluate bladder tissue, Lyng et al.18 compared the spectral features of cervical cancers to the pure spectra of the most relevant biochemicals, such as amino acids, nucleic acids, proteins, and lipids. De Jong et al.19 showed that spectra from nontumor tissue showed a higher collagen content, while spectra from tumor tissue were characterized by higher lipid, nucleic acid, protein, and glycogen. Huang et al.9 showed that albumin, nucleic acid, phospholipids, and histones were found to be the most significant features for construction of a diagnostic model for epithelial neoplasia of the stomach, giving rise to an overall accuracy of 93.7%. We have also implemented simplified biochemical/morphological models using spectra from tissue constituents obtained directly from tissues to discriminate BCC from normal tissues,31 and calcified and noncalcified atherosclerotic plaques from nonatherosclerotic human coronary arteries.47 These works demonstrated that major biochemicals could be used to discriminate between tissues according to pathological status. The spectral differences between BCC and MEL compared with N presented here are in good accord with the recent literature. Spectral changes in N and BCC revealed differences mainly in the amounts of proteins and lipids,22,25,26,28–30,33,34 which were confirmed by our recently presented simplified spectral model,31 and by the more complete model presented here. We found changes in the relative contribution of proteins depending on the lesion (collagens I and III were decreased, and elastin and actin were increased in BCC). This indicates a change in the molecular composition of tissue proteins, as suggested by Gniadecka et al.33 Actin expression plays a role in carcinoma cell organization and growth,48 and has been proposed as a marker of invasiveness in BCC.49 Telangiectatic vessels could contribute to the increase of elastin in BCC; as could their blood cells, with peaks at 1562 and .50 We also found an increased contribution of triolein to BCC spectra. Gniadecka et al.33 demonstrated that BCC and MEL had increases in the Raman bands corresponding to lipids (around ), and decreases in the bands for proteins (1500 to and 1310 to ). This could be explained by the fact that growing tumor cells release collagenase that destroys native collagen fibers,32 eroding the extracellular matrix.6 Also, BCC tissues present fat reservoirs which might function as a nutritional source for the fast-growing tumor,31 reflected in our spectral model as higher triolein content. Stone et al.6 found increases in actin and triolein, and a decrease in collagen in urological carcinoma lesions, corroborating our results. Melanomas exhibited very strong absorption and fluorescence from melanin, which caused tissue burning and a worsening in the SNR [Fig. 4(c)] when using 200 mW power (within the range used in many Raman studies). Due to this, the laser power was reduced to 50 mW to reduce the fluorescence background. However, we observed photobleaching by a visual diminishing in the fluorescence background during the spectrum acquisition of MELs. Neither fluorescence background nor melanin absorption in the near-infrared (800 to 1000 nm) are expected to change the spectral profile of skin and its biochemicals, since melanin absorption does not depend strongly on wavenumber.42 Nevertheless, it may affect the estimated fit parameter since melanin’s high absorption may saturate its Raman signal causing it not to increase linearly with melanin concentration. It is interesting to consider the behavior of the MEL tissues in terms of tissue proteins (collagen and elastin), which were higher than in BCC tissues, despite the high error bars due to lower SNR. In skin melanomas, the malignant changes in melanocytes start at the membrane level, which undergo degradation of basal membrane and subsequent invasion of dermis. The morphological characteristic of the dermis remains morphochemically unchanged,51 which could explain this higher protein level. We found that six MEL spectra were misclassified as BCC. These spectra exhibited lower fluorescence than the remaining ones, and presented spectral features intermediate between N and BCC. In MEL spectra, we found a higher intensity in the Raman band in the region between 1500 to , which could be attributed to the intense melanin band at around (Fig. 2).43 The spectral model revealed that melanin was higher in MEL compared with N and BCC, which was expected in these melanin-rich lesions. The relative contribution of nucleic acid was increased in BCC and even higher in MEL, suggesting higher replication rates for carcinoma and melanoma cells. Our spectral model revealed that actin, collagens I and III, elastin, and triolein were the most important biochemicals for describing overall spectral features in skin tissues; in particular, proteins from the cytoskeleton (actin and collagen III), cell nucleus (nucleic acid), and pigments (melanin) could discriminate BCC and MEL from normal tissues with high sensitivity and specificity. The spectral residuals found in our model (Fig. 4) were on average about 6.7%, 7.4%, and 10.4% for N, BCC, and MEL, respectively. The higher residuals for BCC and MEL could be attributed to differences in the stages of the neoplasia (for BCC) and to the lower SNR for pigmented lesions (for MEL). The choices of biochemicals used in the model were based mainly on their known presence in the tissue, and the contributions they would give to the observed tissue spectrum6 without mean negative fit parameter for at least two tissue types; exception for the phenylalanine, which was included in the model due to its unique spectral feature at , presented in all tissue types. Zhao et al.21 modeled spectra of normal volar forearm skin collected in vivo using oleic acid, palmitic acid, collagen I, ketatin, and hemoglobin. Either pure amino acids, fatty acids or membrane lipids were shown to be relevant to the model. Instead, use of spectra from proteins and triolein, the main lipid in cellular fat, were shown to better represent tissue characteristics. A higher residual in the spectral model was found mainly in the region between 800 to , and to some extent in the 1200 to region. This region is dominated by peaks of structural proteins (proline/hydroxyproline and amide III). It has been demonstrated that collagen bundles exhibit an anisotropic scattering depending on the alignment of the fibrils relative to the laser polarization, even without the use of an analyzer between the sample and the detector.52,53 Principally, the Raman bands for amide III (NH deformation of the N-H groups) and proline/hydroxyproline (C-C stretching) become strong when the alignment of the polarized laser is parallel to the fibril’s long axis.53 The band at (deformation of and bands) does not show preferential orientation; therefore is not affected by the orientation of the fiber.52 These spectral residuals could also be attributed to the lack of an important biochemical in the model, for instance, another protein such as myosin, or other cytoskeletal or structural proteins that could be present in tissue; or even differences between the spectra of pure compounds and ones embedded and (both morphologically and biochemically) functionalized in real tissues. Despite incremental in terms of Raman measurements of in vitro skin biopsy samples, some biochemicals used in this model have not been used before (such as melanin, actin, and ceramide) and those studies do not show diagnosis of all three tissues (N, BCC, and MEL) in the same model. The advantages of such a spectral model based on pure biochemicals are that it can easily be applied to any spectral data, without the need for a particular pre-processing. A prospective analysis using the new set of samples could be performed without the need to recalculate the parameters from a training dataset. This is because the Raman spectra of tissues can be considered a linear combination of the spectra of the basal biochemicals, and each biochemical is already a basis of the tissue spectral information.6,14 Different biochemicals have different Raman cross-sections; therefore, their individual spectra would appear with different intensities even if they are present at the same concentration. As a consequence, one cannot take as absolute the contribution or concentration of each compound to the observed tissue spectrum; rather the relative spectral contribution (fitting coefficients) for each constituent should be considered and compared across the different tissue types. Raman spectroscopy has the potential to become a technique for the biochemical analysis of skin cancer biopsies, or even in real time, in vivo and nondestructively using fiber optic Raman probes, differentially diagnosing BCC from MEL. Studies are under way in order to automate the data collection and evaluate the performance of the model at suspicious skin tissues in vivo, raising the possibility of a local, clinical diagnosis with rapid and reliable results during examinations, or even margin detection during surgery. AcknowledgmentsAuthors thank Barbara Neme Ribeiro and Ary Menegario Filho from Terapêutica Farmácia de Manipulação (São José dos Campos, SP, Brazil) for providing samples of some biochemicals. F. L. Silveira acknowledges FAPESP (São Paulo Research Foundation) for the Doctorate fellowship (Process no. 2010/11111). This work was supported by FAPESP (Grant no. 2009/01788-5). References“Estimate/2012—Cancer Incidence in Brazil,”
(2011) http://www.inca.gov.br/estimativa/2012/estimativa20122111.pdf Google Scholar
Proteja-se do câncer de pele, “Prevenção do Câncer de Pele,”
(2006) http://www1.inca.gov.br/inca/Arquivos/campanhas/CancerPele/folhetoPele.pdf Google Scholar
M. B. LeveneH. A. HayesR. M. Goldwyn,
“Cancer of the skin,”
Cancer, principles and practice of oncology, 1094
–1123 J. B. Lippincott Co., Philadelphia, PA
(1982). Google Scholar
M. J. Mastrangeloet al.,
“Cutaneous melanoma,”
Cancer, principles and practice of oncology, 1124
–1170 J. B. Lippincott Co., Philadelphia, PA
(1982). Google Scholar
M. Gniadeckaet al.,
“Molecular distinctive abnormalities in benign and malignant skin lesions: studies by Raman spectroscopy,”
Photochem. Photobiol., 66
(4), 418
–423
(1997). http://dx.doi.org/10.1111/php.1997.66.issue-4 PHCBAP 0031-8655 Google Scholar
N. Stoneet al.,
“The use of Raman spectroscopy to provide an estimation of the gross biochemistry associated with urological pathologies,”
Anal. Bioanal. Chem., 387
(5), 1657
–1668
(2007). http://dx.doi.org/10.1007/s00216-006-0937-9 ABCNBP 1618-2642 Google Scholar
P. Crowet al.,
“Assessment of fiberoptic near-infrared raman spectroscopy for diagnosis of bladder and prostate cancer,”
Urology, 65
(6), 112
–1130
(2005). http://dx.doi.org/10.1016/j.urology.2004.12.058 0090-4295 Google Scholar
C. Kendallet al.,
“Exploiting the diagnostic potential of biomolecular fingerprinting with vibrational spectroscopy,”
Faraday Discuss., 149 279
–290
(2011). http://dx.doi.org/10.1039/c005379A FDISE6 0301-7249 Google Scholar
Z. Huanget al.,
“In vivo detection of epithelial neoplasia in the stomach using image-guided Raman endoscopy,”
Biosensors Bioelectron., 26
(2), 383
–389
(2010). http://dx.doi.org/10.1016/j.bios.2010.07.125 BBIOE4 0956-5663 Google Scholar
N. D. Mageeet al.,
“Raman microscopy in the diagnosis and prognosis of surgically resected nonsmall cell lung cancer,”
J. Biomed. Opt., 15
(2), 026015
(2010). http://dx.doi.org/10.1117/1.3323088 JBOPFO 1083-3668 Google Scholar
N. D. Mageeet al.,
“Ex vivo diagnosis of lung cancer using a Raman miniprobe,”
J. Phys. Chem. B, 113
(23), 8137
–8141
(2009). http://dx.doi.org/10.1021/jp900379w JPCBFK 1520-6106 Google Scholar
A. S. Hakaet al.,
“Diagnosing breast cancer by using Raman spectroscopy,”
Proc. Natl. Acad. Sci. U S A, 102
(35), 12371
–12376
(2005). http://dx.doi.org/10.1073/pnas.0501390102 0370-0046 Google Scholar
A. S. Hakaet al.,
“In vivo margin assessment during partial mastectomy breast surgery using Raman spectroscopy,”
Cancer Res., 66
(6), 3317
–3322
(2006). http://dx.doi.org/10.1158/0008-5472.CAN-05-2815 CNREA8 0008-5472 Google Scholar
J. F. Brennan IIIet al.,
“Determination of human coronary artery composition by Raman spectroscopy,”
Circulation, 96
(1), 99
–105
(1997). http://dx.doi.org/10.1161/01.CIR.96.1.99 CIRCAZ 0009-7322 Google Scholar
G. V. Nogueiraet al.,
“Raman spectroscopy study of atherosclerosis in human carotid artery,”
J. Biomed. Opt., 10
(3), 031117
(2005). http://dx.doi.org/10.1117/1.1908129 JBOPFO 1083-3668 Google Scholar
J. T. Motzet al.,
“In vivo Raman spectral pathology of human atherosclerosis and vulnerable plaque,”
J. Biomed. Opt., 11
(2), 021003
(2006). http://dx.doi.org/10.1117/1.2190967 JBOPFO 1083-3668 Google Scholar
E. B. Hanlonet al.,
“Prospects for in vivo Raman spectroscopy,”
Phys. Med. Biol., 45
(2), R1
–R59
(2000). http://dx.doi.org/10.1088/0031-9155/45/2/201 PHMBA7 0031-9155 Google Scholar
F. M. Lynget al.,
“Vibrational spectroscopy for cervical cancer pathology, from biochemical analysis to diagnostic tool,”
Exp. Mol. Pathol., 82
(2), 121
–129
(2007). http://dx.doi.org/10.1016/j.yexmp.2007.01.001 EXMPA6 0014-4800 Google Scholar
B. W. D. De Jonget al.,
“Discrimination between nontumor bladder tissue and tumor by Raman spectroscopy,”
Anal. Chem., 78
(22), 7761
–7769
(2006). http://dx.doi.org/10.1021/ac061417b ANCHAM 0003-2700 Google Scholar
W. E. SmithG. Dent,
“The Raman experiment—Raman instrumentation, sample presentation, data handling and practical aspects of interpretation,”
Modern Raman spectroscopy—a practical approach, 30
–31 John Wiley & Sons, West Sussex, England
(2005). Google Scholar
J. Zhaoet al.,
“Integrated real-time Raman system for clinical in vivo skin analysis,”
Skin Res. Technol., 14
(4), 484
–492
(2008). http://dx.doi.org/10.1111/srt.2008.14.issue-4 0909-752X Google Scholar
A. Nijssenet al.,
“Discriminating basal cell carcinoma from perilesional skin using high wave-number Raman spectroscopy,”
J. Biomed. Opt., 12
(3), 034004
(2007). http://dx.doi.org/10.1117/1.2750287 JBOPFO 1083-3668 Google Scholar
S. FendelB. Schrader,
“Investigation of skin and skin lesions by NIR-FT-Raman spectroscopy,”
Fresenius J. Anal. Chem., 360
(5), 609
–613
(1998). http://dx.doi.org/10.1007/s002160050767 FJACES 0937-0633 Google Scholar
S. Naitoet al.,
“In vivo measurement of human dermis by 1064 nm-excited fiber Raman spectroscopy,”
Skin Res. Technol., 14
(1), 18
–25
(2008). http://dx.doi.org/10.1111/j.1600-0846.2007.00255.x 0909-752X Google Scholar
L. O. Nuneset al.,
“FT-Raman spectroscopy study for skin cancer diagnosis,”
Spectroscopy, 17
(2–3), 597
–602
(2003). http://dx.doi.org/10.1155/2003/104696 IJSNBB 1687-9457 Google Scholar
A. Nijssenet al.,
“Discriminating basal cell carcinoma from its surrounding tissue by Raman spectroscopy,”
J. Invest. Dermatol., 119
(1), 64
–69
(2002). http://dx.doi.org/10.1046/j.1523-1747.2002.01807.x JIDEAE 0022-202X Google Scholar
T. R. Hataet al.,
“Non-invasive Raman spectroscopic detection of carotenoids in human skin,”
J. Invest. Dermatol., 115
(3), 441
–448
(2000). http://dx.doi.org/10.1046/j.1523-1747.2000.00060.x JIDEAE 0022-202X Google Scholar
J. Choiet al.,
“Direct observation of spectral differences between normal and basal cell carcinoma (BCC) tissues using confocal Raman microscopy,”
Biopolymers, 77
(5), 264
–272
(2005). http://dx.doi.org/10.1002/(ISSN)1097-0282 BIPMAA 0006-3525 Google Scholar
C. A. Lieberet al.,
“Raman microspectroscopy for skin cancer detection in-vitro,”
J. Biomed. Opt., 13
(2), 024013
(2008). http://dx.doi.org/10.1117/1.2899155 JBOPFO 1083-3668 Google Scholar
C. A. Lieberet al.,
“In-vivo nonmelanoma skin cancer diagnosis using Raman microspectroscopy,”
Lasers Surg. Med., 40
(7), 461
–467
(2008). http://dx.doi.org/10.1002/lsm.v40:7 LSMEDI 0196-8092 Google Scholar
B. Bodaneseet al.,
“Differentiating normal and basal cell carcinoma human skin tissues in vitro using dispersive Raman spectroscopy: a comparison between Principal Components Analysis and simplified biochemical models,”
Photomed. Laser Surg., 28
(S1), S119
–S127
(2010). http://dx.doi.org/10.1089/pho.2009.2565 PLDHA8 1549-5418 Google Scholar
N. Vogleret al.,
“Multimodal imaging to study the morphochemistry of basal cell carcinoma,”
J. Biophotonics, 3
(10–11), 728
–736
(2010). http://dx.doi.org/10.1002/jbio.201000071 JBOIBX 1864-063X Google Scholar
M. Gniadeckaet al.,
“Melanoma diagnosis by Raman spectroscopy and neural networks: structure alterations in proteins and lipids in intact cancer tissue,”
J. Invest. Dermatol., 122
(2), 443
–449
(2004). http://dx.doi.org/10.1046/j.0022-202X.2004.22208.x JIDEAE 0022-202X Google Scholar
J. Zhaoet al.,
“Real-time Raman spectroscopy for non-invasive skin cancer detection—preliminary results,”
in Conf. Proc. IEEE Eng. Med. Biol. Soc.,
3107
–3109
(2008). Google Scholar
M. GniadeckaO. F. NielsenH. C. Wulf,
“Water content and structure in malignant and benign skin tumours,”
J. Mol. Struct., 661–662 405
–410
(2003). http://dx.doi.org/10.1016/j.molstruc.2003.08.030 JMOSB4 0022-2860 Google Scholar
M. BaumgartnerR. J. Bakker,
“Raman spectroscopy of pure and NaCl- containing synthetic fluid inclusions in quartz—a study of polarization effects,”
Miner. Petrol., 95
(1–2), 1
–15
(2009). http://dx.doi.org/10.1007/s00710-008-0028-z MIPEE9 0930-0708 Google Scholar
L. T. MainardiA. M. BianchiS. Cerutti,
“Digital Biomedical Signal Acquisition and Processing,”
The Biomedical Engineering handbook, 2nd ed.CRC Press LLC, Boca Raton, FL
(2000). Google Scholar
L. Silveiraet al.,
“Correlation between near-infrared Raman spectroscopy and the histopathological analysis of atherosclerosis in human coronary arteries,”
Lasers Surg. Med., 30
(4), 290
–297
(2002). http://dx.doi.org/10.1002/(ISSN)1096-9101 LSMEDI 0196-8092 Google Scholar
C. Moler,
“Least Squares,”
Numerical Computing with MATLAB: Electronic edition, The MathWorks Inc., Natick, MA
(2008). Google Scholar
E. J. CiaccioS. M. DunnM. Akay,
“Biosignal pattern-recognition and interpretation systems. Part 3 of 4. Methods of classification,”
IEEE Eng. Med. Biol., 13
(1), 129
–135
(1994). http://dx.doi.org/10.1109/51.265792 IEMBDE 0739-5175 Google Scholar
J. Duarteet al.,
“Near-infrared Raman spectroscopy to detect anti-Toxoplasma gondii antibody in blood sera of domestic cats: quantitative analysis based on partial least-squares multivariate statistics,”
J. Biomed. Opt., 15
(4), 047002
(2010). http://dx.doi.org/10.1117/1.3463006 JBOPFO 1083-3668 Google Scholar
S. H. Tsenget al.,
“Chromophore concentrations, absorption and scattering properties of human skin in-vivo,”
Opt. Express, 17
(17), 14599
–14617
(2009). http://dx.doi.org/10.1364/OE.17.014599 OPEXFF 1094-4087 Google Scholar
Z. Huanget al.,
“Raman spectroscopy of in vivo cutaneous melanin,”
J. Biomed. Opt., 9
(6), 1198
–1205
(2004). http://dx.doi.org/10.1117/1.1805553 JBOPFO 1083-3668 Google Scholar
A. Tfayaliet al.,
“Follow-up of drug permeation through excised human skin with confocal Raman microspectroscopy,”
Eur. Biophys. J., 36
(8), 1049
–1058
(2007). http://dx.doi.org/10.1007/s00249-007-0191-x EBJOE8 0175-7571 Google Scholar
N. Stoneet al.,
“Raman spectroscopy for identification of epithelial cancers,”
Faraday Discuss., 126 141
–157
(2004). http://dx.doi.org/10.1039/b304992b FDISE6 0301-7249 Google Scholar
Z. MovasaghiS. RehmanI. U. Rehman,
“Raman spectroscopy of biological tissues,”
Appl. Spectrosc. Rev., 42
(5), 493
–541
(2007). http://dx.doi.org/10.1080/05704920701551530 APSRBB 0570-4928 Google Scholar
M. B. Pereset al.,
“Classification model based on Raman spectra of selected morphological and biochemical tissue constituents for identification of atherosclerosis in human coronary arteries,”
Lasers Med. Sci., 26
(5), 645
–655
(2011). http://dx.doi.org/10.1007/s10103-011-0908-z 0268-8921 Google Scholar
A. Hall,
“The cytoskeleton and cancer,”
Cancer Metastasis Rev., 28
(1–2), 5
–14
(2009). http://dx.doi.org/10.1007/s10555-008-9166-3 CMRED4 0167-7659 Google Scholar
M. C. Uzquianoet al.,
“Metastatic basal cell carcinoma exhibits reduced actin expression,”
Mod. Pathol., 21
(5), 540
–543
(2008). http://dx.doi.org/10.1038/modpathol.3801051 MODPEO 0893-3952 Google Scholar
A. Bankapuret al.,
“Raman tweezers spectroscopy of live, single red and white blood cells,”
PLoS ONE, 5
(4), e10427
(2010). http://dx.doi.org/10.1371/journal.pone.0010427 1932-6203 Google Scholar
R. S. de Oliveira FilhoC. F. Neto, Melanoma cutâneo localizado e linfonodo sentinela, 12
–13 Lemar Editora, São Paulo, SP
(2003). Google Scholar
M. Jankoet al.,
“Anisotropic Raman scattering in collagen bundles,”
Opt. Lett., 35
(16), 2765
–2767
(2010). http://dx.doi.org/10.1364/OL.35.002765 OPLEDP 0146-9592 Google Scholar
A. BonifacioV. Sergo,
“Effects of sample orientation in Raman microspectroscopy of collagen fibers and their impact on the interpretation of the amide III band,”
Vib. Spectrosc., 53
(2), 314
–317
(2010). http://dx.doi.org/10.1016/j.vibspec.2010.04.004 VISPEK 0924-2031 Google Scholar
|


