
|
|
1.IntroductionRheumatoid arthritis (RA) is a chronic inflammatory disease that causes joint pain, progressive joint destruction, and functional disability, due to the combined effect of chronic synovitis and progressive joint damage. Treatment of disease in the first months of synovitis is important to inhibit radiographic progression. Therefore, it is important that RA should be treated and controlled as soon as possible after diagnosis and that this control should be maintained for as long as possible, consistent with patient safety. This new way of treatment is called tight control.1 Tight control seems to be a promising new paradigm for reaching the aim of low disease activity, or remission, in clinical trials and possibly daily practice, due to a predefined decision and measurement system. Over the last decade, the American College of Rheumatology (ACR) recommendations2,3 also have increasingly suggested earlier and more aggressive treatment. Regular follow-up visits are required to assess progress in suppression of inflammation. Several methods have been developed to provide a basis for reporting disease activity. These range from general health assessment questionnaires4 to joint count methods,5 blood tests,3 and combinations of these.6 A popular and well-validated example is the Disease Activity Score (DAS),7 which is adopted from clinical studies in daily clinical practice8 because of its ease of use. For use in individual cases, however, we observe a few disadvantages of the DAS score. Most importantly, the method relies on joint assessment by an individual operator. This is an inherently subjective process, leading to a relative large measurement error9 of 0.6, where cut-off points between low and moderate, and between moderate and high disease activity, are 3.2 and 5.1, respectively.10 Another disadvantage is that individual joint scores are binary, i.e., a joint is either swollen or not. A decrease in swelling is not taken into consideration. Existing modalities that can assess joint inflammation are ultrasound and magnetic resonance imaging (MRI). Both are used when joint inflammation measurements are critical. In particular, ultrasound is applied to individual joints, where the method works in the hands of a skilled operator. Expansion to multiple joints is time consuming and impractical. MRI is reliable and can give an overview of inflammation in all joints in a patient; however, this modality is too costly and too time consuming for routine monitoring of patients. Noninvasive optical methods offer several advantages over existing modalities. Optical contrast can be related to physiological parameters in the body, such as hematocrit and oxygenation in pulse oxymetry. At relevant wavelengths and intensities, optical radiation is completely harmless. The cost of optical methods is low compared to other modalities. A few academic groups have worked on optical imaging of joints like the group of Jiang,11 Beuthan,12 and Hielscher.13,14 In these reports, an increase in hemoglobin and a decrease in hemoglobin oxygenation are found in inflamed joints. This can be explained by a higher metabolic activity in diseased joints. Diffuse optical tomography of joints is a relatively complex method, where the joint is exposed to light of a specific wavelength (color) at a single position and the transmitted light is collected at multiple positions around the joint. This process is repeated for several illumination positions. From the resulting data, it is possible to reconstruct an image of the joint; however, scaling up to simultaneous evaluation of multiple joints is difficult. Recently a novel device based on fluorescence imaging has been presented, where the information obtained from the optical method is equivalent to existing modalities.15 This leads to the desire for a more objective and quantitative method for assessing joint inflammation that is suitable for showing multiple joint images. Our study presents a method where simple optical transmission measurements of joints are used. This method does not allow detailed reconstruction of joint images; however, this method is easily expandable to include all joints in both hands and wrists, which is necessary to provide an overview of joint inflammation and which can help to determine joint inflammation in a patient. Having an operator-independent tool to assess joint inflammation levels would enable a more efficient workflow, which is necessary to implement tight control. 2.Patients and MethodsThis is a cross-sectional observational study, conducted in a single center to evaluate the potential of optical attenuation measurements to establish joint inflammation levels for RA patients. This research was performed in compliance with the Helsinki Declaration, and all patients gave written informed consent. The number of enrolled patients is 79, included in 4 weeks. The patients’ characteristics are shown in Table 1. Table 1Study population.
Inclusion criteria: Exclusion criteria:
Patients diagnosed with RA were recruited from a list of patients with scheduled appointments for a regular follow-up visit to the outpatient clinic during the study. All consecutive patients that complied with the inclusion criteria and gave informed consent were enrolled in the study. During the regular visit, joint inflammation of the proximal interphalangeal (PIP) joint with the highest inflammation level was clinically ranked on a 1 to 5 scale by a rheumatologist or an experienced physician assistant. In this scale 1 indicates no inflammation, 2 possible/slight inflammation, 3 moderate inflammation, 4 major inflammation, and 5 severe inflammation. The clinical examiner was blinded from the optical measurements and the data analysis was performed offline to prevent bias. The PIP joints have been chosen in this study because the patients had RA and because of the shape of the device. Some patients volunteered to be measured twice, one PIP joint on the right hand as well as one PIP joint at the left hand, when the inflammation level was different between these joints. The instrument for the optical measurements consisted of a spherical surface, constructed from Delrin, where in a recessed area, the two 1-mm multimode optical fiber ends of a bifurcated fiber are positioned for illumination of the PIP joint and a reference area between the PIP joint and the DIP joint. The distance between the two fiber ends is 15 mm (center distance). The other side of the bifurcated fiber is connected to a white light source with a shutter (Avantes AvaLight HAL-S in long-life mode for enhanced red/near infrared emission). Two 1-mm multimode optical fibers collect the transmitted light and guide it to two spectrometers (Ocean Optics , symmetrical crossed Czerny-Turner spectrometer, 200 µm slit, grating, blaze wavelength 750 nm, wavelength range 500 to 1000 nm). The integration times for the spectrometers is set by a Labview-based computer program to adjust for differences in optical transmission of the subjects’ fingers. For the measurement with the hand scan, a pressure cuff (Hokanson SC10D), connected to a computer-controlled rapid cuff inflator system (Hokanson E20/AG101), was placed on the upper arm. The patients were guided to place their hands on a spherical surface, with their PIP joint over the optical fiber that illuminated the joint from the palmar side. The intermediate phalange was placed over a second illumination fiber. When the patient was comfortable, two optical fibers were placed on top of the PIP joint and intermediate phalange on the dorsal side of the hand. The measurement geometry is shown in Fig. 1. Fig. 1Measurement setup: hand placed on spherical surface, with the PIP joint over an illumination fiber and the intermediate phalange over another illumination fiber, which are both connected to a white light source (WL) and shutter (S). Two optical fibers are placed on the dorsal side for collection of transmitted light; these fibers are connected to two spectrometers (SPEC1&2).  These two fibers on the dorsal side collect light transmitted through the finger. The pressure cuff was inflated to 50 mm Hg to occlude the venous blood flow. A blood pressure measurement was not obtained from the subject. However, it was assumed that the arterial pressure in our subjects was higher than 50 mm Hg and that arterial inflow of blood would continue and an increased blood pool would build up in the hands of the patient. The increased blood pool leads to a decreased optical transmission in the finger, which can be recorded by the spectrometers. Throughout the measurement, the spectral transmission is continually recorded, where the capture rate of the spectra is limited by the integration time. Typically, a measurement of 5 min resulted in 600 to 3000 recorded spectra per spectrometer, mainly depending on the thickness of the subject’s finger. At the start of each measurement series, a shutter blocked the light source and the effect of ambient light on the detector was measured once. The ambient light spectrum was subtracted from each subsequent recorded spectrum. A single measurement followed a cycle of inflation and deflation of the pressure cuff:
From pilot data it is known that the time constant, which is necessary to increase the blood pool after inflating the cuff, is between 15 and 30 s. For this study, 1-min intervals have been chosen to fully capture the changes in the blood pool in the finger. 2.1.Statistical AnalysisThe null-hypothesis to be tested is: there is no difference in the optical attenuation spectra of inflamed and noninflamed joints. In this investigation the null-hypothesis will be rejected at -values equal to or lower than 0.05. To investigate whether there is a difference in the optical attenuation spectra of inflamed and noninflamed joints, cross-validated partial least-squares discriminant analysis (PLS-DA) was performed. Measurement data were pooled in two sets: 1. no inflammation: one [] and 2. moderate to severe inflammation: 3, 4, and 5 []. Before PLS-DA, the measurement data were processed using the following steps:
Using the spectral information and the reference data as obtained from the physical examination, a prediction model is built with PLS-DA to predict the inflammation level from the spectral data. This is described in the inverse problem in Eq. (1): where is the predicted level of inflammation, is the regression vector developed by PLS-DA, is a recorded spectrum where the index indicates a deflated pressure cuff, and indicates an inflated pressure cuff. The index WL is used for white light spectra, and PIP and IP indicate spectra taken at the PIP joint and the reference area between the PIP joint and the DIP joint respectively.To enable estimation of the performance of the model for predicting inflammation levels, an eight-split venetian-blinds cross-validation scheme was used. Cross-validation consists of a series of experiments, each of which involves the removal of a subset of measurements from the dataset (the validation set), construction of a model using the remaining measurements in the dataset (the training set), and subsequent application of the resulting model to the removed measurements. In this way, the model is tested with measurements that were not used to build the model. All multivariate analyses were performed using the PLS Toolbox for MatLab (The Mathworks, Inc., Natick, MA) by Eigenvector Research, Inc., Wenatchee, WA. The advantage of this method is that the resulting model can be used to predict inflammation levels in future measurements. 3.ResultsA total of 79 patients were enrolled in the study. The measurement setup was located in a room with windows facing south. The setup had no screens preventing light from external sources, such as sunlight, from falling on the hands and detectors. Since the contribution of ambient light is measured only once at the start of a measurement series, varying levels of ambient light during the measurement can render data from a patient unusable. This occurred for the first 16 joint measurements on 12 patients. These measurements have been removed from the dataset that is analyzed. This problem has been solved during the study by moving the equipment to another room with improved shielding from sunlight. No adverse events occurred during the study and no patient withdrew from the study. In general the study was well received by patients, who reported that the measurement was painless, especially compared to clinical assessment of swelling and joint tenderness. The data that have been obtained are not normally distributed. The group noninflamed joints (clinical assessment 1, ) in the dataset is larger than the group inflamed joints (clinical assessments 2, 3, 4, and 5, ). Before performing PLS-DA, we found significant differences using nonparametric, Wilcoxon Rank Sum testing in the optical spectra () that indicate a higher attenuation of light at wavelength of 810 nm in inflamed joints, suggesting that more blood was present in inflamed joints compared to noninflamed joints. Additionally the ratio between attenuation of light at a wavelength between 720 and 810 nm is lower in inflamed joints (), suggesting a lower oxygenation in these inflamed joints. Figure 2 shows examples of white-light-corrected transmission spectra of an inflamed and a noninflamed PIP joint and of the corresponding IP reference areas. Fig. 2Typical example of transmission spectra of PIP joints and corresponding IP reference areas for inflamed and noninflamed joints. Transmission spectra directly before the cuff was inflated (higher transmission) and transmission spectra obtained directly before the cuff was deflated (lower transmission) are shown.  We also observed that during the inflation cycle, the overall spectral intensity dropped more in inflamed joints, indicating that more blood accumulated in inflamed joints () and that blood accumulation was faster (14.5 s) in inflamed joints than in noninflamed joints (21.6 s) (). An example of this is shown in Fig. 3. A higher blood content, lower oxygenation, and stronger hemodynamics can be expected in inflamed joints thanks to the higher metabolism in inflamed areas. Fig. 3Typical difference in time traces at a wavelength of 810 nm for inflamed and noninflamed joints.  Figure 4 shows the correlation of the prediction model created with the PLS-DA method with clinical assessment of inflammation for the same joint. The correlation coefficient (), 95% CI [0.47, 0.75]. Fig. 4Correlation between optical joint inflammation measurements and clinical assessment: the vertical dots give the average predicted value for measurements for a specific inflammation level as assessed by clinical examination. The bars indicate the standard deviation for the different predicted inflammation values. 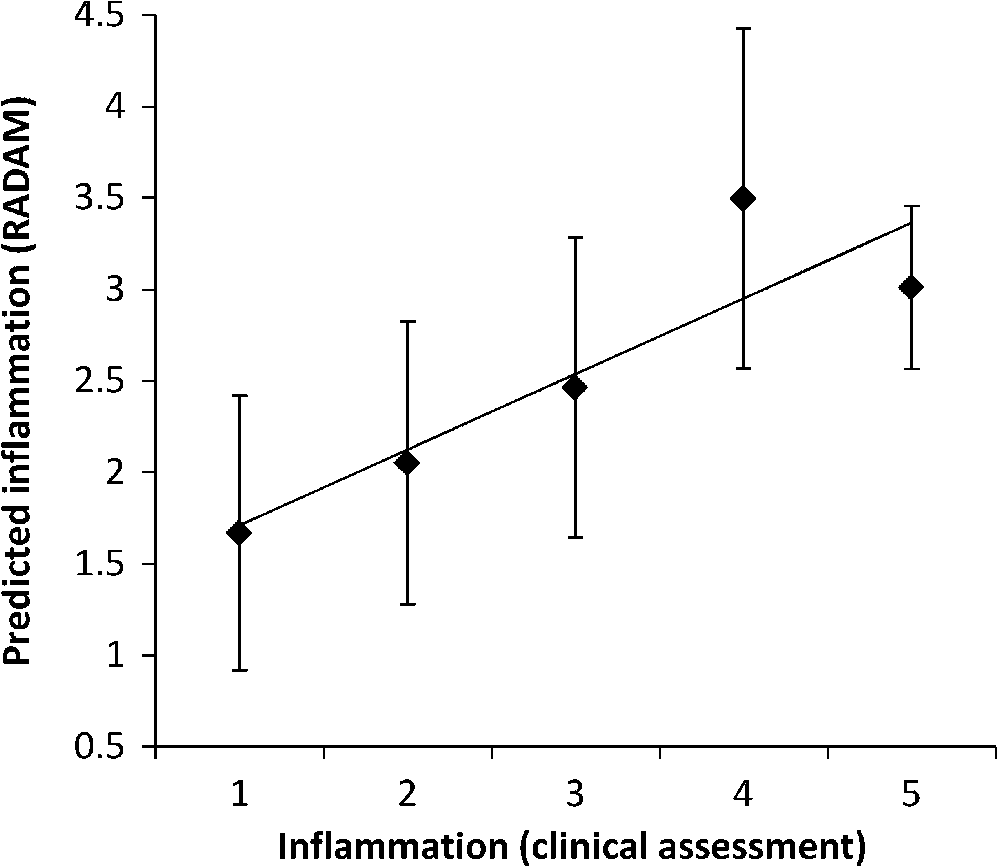 The performance of a three LV (latent variable) PLS-DA model is summarized in the ROC curve of Fig. 5. Here, the sensitivity, or the fraction of all predicted positives (inflammations) that actually are positive, is plotted against the (1-specificity), or the fraction of all predicted positives (inflammations) that actually are negative. The area under the ROC curve, a measure of accuracy of a diagnostic test, is 0.88. Fig. 5ROC curve for optical joint inflammation measurements using clinical assessment as a reference.  Within the PLS-DA analysis, the range of wavelengths that contribute the most to the regression vector, by selecting the largest amplitude, is between 810 and 830 nm. At a wavelength of 808 nm, oxyhemoglobin and deoxyhemoglobin have the same light absorption levels, while at 830 nm, the absorption of deoxyhemoglobin is higher compared to oxyhemoglobin. 4.DiscussionThe observed results are encouraging for this first study with a new experimental optical device, compared with the strength of the correlation of ultrasound () or MRI () with a single joint measurement.16,17 In our study, the physicians have been asked to not only report the presence of inflammation but to also grade the level of inflammation. The accuracy of this grading has not been investigated. Both grading errors and instrumentation errors will lead to a lower correlation coefficient. Consistency of physician-based joint counts have been debated and an inter-rater correlation as low18 as has been reported. The potential influence of the subjects’ blood pressure on the measurement results has not been investigated, and this may be a factor contributing to the measurement error. Different PIP joints have been used because most joints were not inflamed. In clinical practice, most RA patients are treated with disease-modifying antirheumatic drugs (DMARDs) or biological therapy leading to absence of inflammation. To have a range of inflammation levels in the dataset, the most severely inflamed joint has been used for each patient. When multiple PIP joints with the same inflammation level were present, the PIP2 has been chosen for the measurement because this joint is most conveniently measured on the device. Potential variations related to using different PIP joints are implicitly taken into account in the multivariate regression. In the next study, it would be desirable to use a more objective method, such as MRI, to provide the reference data. To prevent observational bias, it would be preferable for the next study to be blinded and other possible confounders have to be researched. A novel optical imaging device that assesses multiple joints at once, based on the measurement principle that was employed for a single joint in this study, is expected to provide measurement results that can be validated using accepted methods, such as Doppler ultrasound and MRI, as a reference. Including multiple joints would allow correlating the results with disease activity, as observed with existing tools, such as DAS28. Having the inflammation measurements on a relevant set of joints, such as all joints in hands and wrists, would provide rheumatologists with an objective tool to help in making treatment decisions. The device was easy to use and can be controlled by a nurse or assistant. Patients perceived the measurement as comfortable, according to their reports. The measurement was painless, especially compared to clinical assessment of swelling and joint tenderness. No (serious) adverse events were reported. We conclude that hemodynamic can be measured optically and that optical spectral transmission measurements correlate well with clinical assessment of joint inflammation. Further study using a multijoint device is necessary to demonstrate the feasibility, reproducibility, and usability of optical measurements in clinical practice. When this is positive, this new device can be applied to implement tight control aiming for low disease activity. AcknowledgmentsWe would like to acknowledge all patients who participated in the study, and also want to thank the Regional Rheumatic Centre Eindhoven for their support. The authors declare no conflict of interest. Philips Research Europe developed this new device, which has been tested at the Regional Rheumatic Centre. There was no further financial support. ReferencesM. F. Bakkeret al.,
“Tight control in the treatment of rheumatoid arthritis: efficacy and feasibility,”
Ann. Rheum. Dis., 66
(Suppl. 3), 56
–60
(2007). http://dx.doi.org/10.1136/ard.2007.078360 ARDIAO 0003-4967 Google Scholar
J. S. Smolenet al.,
“EULAR recommendations for the management of rheumatoid arthritis with synthetic and biological disease-modifying antirheumatic drugs,”
Ann. Rheum. Dis., 69
(6), 964
–975
(2010). http://dx.doi.org/10.1136/ard.2009.126532 ARDIAO 0003-4967 Google Scholar
K. G. Saaget al.,
“American College of Rheumatology 2008 recommendations for the use of nonbiologic and biologic disease-modifying antirheumatic drugs in rheumatoid arthritis,”
Arthritis Care Res., 59
(6), 762
–784
(2008). http://dx.doi.org/10.1002/art.23721 ARCREG 0893-7524 Google Scholar
J. F. Frieset al.,
“Measurement of patient outcome in arthritis,”
Arthritis Rheum., 23
(2), 137
–145
(1980). http://dx.doi.org/10.1002/(ISSN)1529-0131 ARHEAW 0004-3591 Google Scholar
D. M. Ritchieet al.,
“Clinical studies with an articular index for the assessment of joint tenderness in patients with rheumatoid arthritis,”
Q. J. Med., 37
(147), 393
–406
(1968). QJEPAY 0033-5541 Google Scholar
F. SalaffiM. PeroniG. F. Ferraccioli,
“Discriminating ability of composite indices for measuring disease activity in rheumatoid arthritis: a comparison of the chronic arthritis systemic index, disease activity score and Thompson’s articular index,”
Rheumatology, 39
(1), 90
–96
(2000). http://dx.doi.org/10.1093/rheumatology/39.1.90 RHEUBD 0080-2727 Google Scholar
M. L. L. Prevooet al.,
“Modified disease-activity scores that include 28-joint counts—development and validation in a prospective longitudinal-study of patients with rheumatoid-arthritis,”
Arthritis Rheum., 38
(1), 44
–48
(1995). http://dx.doi.org/10.1002/(ISSN)1529-0131 ARHEAW 0004-3591 Google Scholar
P. L. van Rielet al.,
“Association of HLA antigens, toxic reactions and therapeutic response to auranofin and aurothioglucose in patients with rheumatoid arthritis,”
Tissue Antigens, 22
(3), 194
–199
(1983). http://dx.doi.org/10.1111/j.1399-0039.1983.tb01191.x TSANA2 Google Scholar
J. FransenG. StuckiP. L. C.M. van Riel,
“Rheumatoid arthritis measures: disease activity score (DAS), disease activity score-28 (DAS28), rapid assessment of disease activity in rheumatology (RADAR), and rheumatoid arthritis disease activity index (RADAI),”
Arthritis Care Res., 49
(S5), S214
–S224
(2003). http://dx.doi.org/10.1002/(ISSN)1529-0131 ARCREG 0893-7524 Google Scholar
A. M. van GestelC. J. HaagsmaP. Riel,
“Validation of rheumatoid arthritis improvement criteria that include simplified joint counts,”
Arthritis Rheum., 41
(10), 1845
–1850
(1998). http://dx.doi.org/10.1002/(ISSN)1529-0131 ARHEAW 0004-3591 Google Scholar
L. J. Jianget al.,
“A perspective on medical infrared imaging,”
J. Med. Eng. Technol., 29
(6), 257
–267
(2005). http://dx.doi.org/10.1080/03091900512331333158 JMTEDN 0309-1902 Google Scholar
J. Beuthanet al.,
“RA diagnostics using laser-optical images and conventional X-rays (fused imaging),”
Med. Laser Appl., 22
(2), 127
–133
(2007). http://dx.doi.org/10.1016/j.mla.2007.03.004 Google Scholar
J. M. Laskeret al.,
“Dynamic optical imaging of vascular and metabolic reactivity in rheumatoid joints,”
J. Biomed. Opt., 12
(5), 052001
(2007). http://dx.doi.org/10.1117/1.2798757 JBOPFO 1083-3668 Google Scholar
A. H. Hielscheret al.,
“First clinical evaluation of sagittal laser optical tomography for detection of synovitis in arthritic finger joints,”
Ann. Rheum. Dis., 64
(2), 239
–245
(2005). http://dx.doi.org/10.1136/ard.2004.024224 ARDIAO 0003-4967 Google Scholar
S. G. Werneret al.,
“Inflammation assessment in patients with arthritis using a novel in vivo fluorescence optical imaging technology,”
Ann. Rheum. Dis., 71
(4), 504
–510
(2012). http://dx.doi.org/10.1136/annrheumdis-2010-148288 ARDIAO 0003-4967 Google Scholar
M. Backhauset al.,
“Arthritis of the finger joints: a comprehensive approach comparing conventional radiography, scintigraphy, ultrasound, and contrast-enhanced magnetic resonance imaging,”
Arthritis Rheum., 42
(6), 1232
–1245
(1999). http://dx.doi.org/10.1002/1529-0131(199906)42:6<1232::AID-ANR21>3.0.CO;2-3 ARHEAW 0004-3591 Google Scholar
E. Naredoet al.,
“Assessment of inflammatory activity in rheumatoid arthritis: a comparative study of clinical evaluation with grey scale and power Doppler ultrasonography,”
Ann. Rheum. Dis., 64
(3), 375
–381
(2005). http://dx.doi.org/10.1136/ard.2004.023929 ARDIAO 0003-4967 Google Scholar
C. A. E. Walshet al.,
“Consistency in assessing the Disease Activity Score-28 in routine clinical practice,”
Ann. Rheum. Dis., 67
(1), 135
–136
(2008). http://dx.doi.org/10.1136/ard.2007.076885 ARDIAO 0003-4967 Google Scholar
|


