
|
|
1.IntroductionAcetic acid has been used for decades as an aid for the detection of precancerous cervical lesions. Regions of the tissue that become white upon application of acetic acid are more likely to be precancerous. More recently acetic acid has been shown to have potential for the detection of neoplastic lesions associated with Barrett’s esophagus yielding a significant increase in the rate of detection of neoplastic lesions.1 Acetic acid, and acetic acid indigocarmine mixtures have also been reported to enhance the diagnosis, and margin location, respectively, of gastric cancers.2,3 Acetic acid may also be useful for the detection of oral cancer.4 Despite the increasing use of acetic acid, the mechanism of acetowhitening is not understood and the biological factors necessary for acetowhitening are not known. Human papilloma virus (HPV) infection is a major etiological factor in cervical carcinoma and oral HPV infection is reported to be strongly associated with oropharyngeal cancer.5 The association of HPV with neoplasia and Barrett’s esophagus is controversial.6,7 Given these associations of HPV with cancers for which acetic acid application is being used or tested, the possible association of acetowhitening with HPV infection is of interest. HPV infection rates have been found to be the same in women with and without acetowhitening of the uterine cervix. However, the type of HPV infection is different in the patients with acetowhite lesions. Oncogenic HPV phenotypes are much more prevalent in patients with acetowhite lesions.8 The causative link between cancerous and precancerous lesions and acetowhitening is unclear. The diagnostic usefulness of acetowhitening may be caused by a change in expression of nuclear or cytoplasmic proteins due to oncogenic changes. Whether or not a viral infection is a necessary part of the oncogenic progression is not known. The idea of nuclear proteinprecipitation is a commonly stated cause of acetowhitening9 and this idea is consistent with the fact that metaplastic or healing tissue, which have increased nuclear protein, can both display acetowhitening.10 Alternatively, cytokeratin expression has been hypothesized to be an essential requirement for acetowhitening.11 Acetowhitening is an increase in the amount of reflected light from cells at or near the tissue surface. There is evidence that changes in the cytoplasm upon acetic acid application contribute to acetowhitening.12 Backscattering of light from the nucleus is strongly enhanced after the application of 6% acetic acid.13–15 This effect occurs in both normal and cancerous cells or tissue specimens.14,15 Possibly the difference in acetowhitening between normal and cancerous tissue is related to the dynamics of acetowhitening. Normal cells have been shown to return to normal after the removal of acetic acid much faster than cancerous cells in vitro.16 In order to better understand the changes in light scattering that lead to acetowhitening we have measured wide angle side scattering in two cancerous cell lines and correlated side scattering images with fluorescent images of the cell nuclei and with brightfield images. 2.Methods2.1.Cell CultureThe tumorigenic fibroblast cell line, MR1, which does not contain cytokeratins was used. The cell line has both myc and ras mutations, the latter of which lead to its tumorigenicity.17 The cervical carcinoma cell line, SiHa, was also used, which contains the oncogenic human papallomavirus, HPV-16. MR1 rat fibroblast cells and SiHa human epithelial cells were each maintained in monolayer culture using standard mammalian cell culture at 37°C. Details of the cell culture and harvesting for flow cytometry have been previously published.18 2.2.Cell Staining and Exposure to Acetic AcidHoechst 33342 (H1399) was used to stain the nuclei. It is a live cell stain which binds the minor groove of double stranded DNA. This binding increases the fluorescence quantum yield by about a factor of 10 (according to the product information). The unbound spectra is pH dependent. We found that nuclear fluorescence intensity increases when acetic acid is present. MitoTracker Orange CMTMRos (M7510) was used to stain mitochondria. This dye concentrates in the mitochondria of live cells. LysoSensor Green DND-189 (L-7535) was used for staining lysosomes. This dye has a pKa of and accumulates in acidic organelles as the result of protonation which also results in an increase in fluorescence intensity. All dyes were purchased from Invitrogen (Eugene, OR). Before staining, MR1 and SiHa cells were suspended in DMEM and complete media, respectively, at a concentration of . All cell staining was performed at room temperature with the room lights off. The cells were first incubated in 16 μM Hoechst 33342 for 15 min. Subsequently, the cells were incubated in 80 nM LysoSensor dye for 5 min. Next, the cell suspension was incubated with 292 nM MitoTracker Orange CMTMRos for 5 min. To remove any unbound dyes, 10 mL PBS was added to the cell suspension, the cells were centrifuged for 5 min at (Beckman CS-6R Centrifuge, Beckman Coulter, Inc., Hialeah, FL) and the supernatant was removed. The cell pellet was gently resuspended in 150 μL DMEM or complete media and treated again with Hoechst 33342 dye (4.8 μM). Roughly 5 min after the staining was complete, 50 μL acetic acid (AA) 2.4% was added to some samples resulting in a final acetic acid concentration of 0.6%. After adding the AA the cells were kept in incubator at 37°C. Roughly 5 min after the AA was added the cells were analyzed by flow cytometry. 2.3.Flow Cytometry ImageryFlow cytometry imaging was performed using an flow cytometer (Amnis Corporation, Seattle, WA). A schematic of the instrument and details of data collection have been previously published.18 The most important aspects for this work are that a 0.75 NA, collection objective with a 4-μm depth of field was used for data collection, and that all images were obtained at 90 deg from the incident excitation except the brightfield image which was obtained in the standard straight through geometry. The 0.75 NA of the microscope objective meant that light was collected over an angle range of centered at 90 deg. Light scattering was measured at 785 nm with a linearly polarized laser. The polarization of the 785 nm laser beam is normally in the plane containing the excitation and light collection pathways. Data were also taken with the polarization rotated 90 deg. This was achieved by inserting a waveplate followed by a linear polarizer into the beam path of the 785 nm laser. Compensation (e.g., correcting for the fluorescence of LysoSensor in the Hoechst channel) was initially performed using the semi-automated procedure provided in the IDEAS Software that requires data from individually stained samples.19 For five of our 12 acetic acid containing samples the automated compensation routine was not adequate and manual compensation was performed. (There was no correlation between the need for manual compensation and either cell type or excitation light polarization.) Images of single, in focus cells were selected for analysis. The data sets of cells not exposed to acetic acid are identical to those in Ref. 18. 2.4.Quantifying Side Scatter from the Nucleus and CytoplasmFor each cell, masks were used to define the outline of the cell and the outline of the nucleus. The details of how these masks were defined is described in Sec. 3.1, where images of the cells are shown. The following analysis of the images is slightly different than that used in Ref. 18. In that paper, we corrected the scattering of the cells (which were not exposed to acetic acid) for the fact that staining with Hoechst caused a statistically significant increase in scattering. No statistically significant increase in scattering was seen for Hoechst staining of acetic acid exposed cells. To have a standard method of data analysis and because the increase in scattering upon acetic acid exposure is much greater than that of Hoechst staining, no corrections were done to account for increased scattering with Hoechst staining. The microscope objective used in these experiments has a depth of field of 4 μm. The MR1 and SiHa cells are about 12 and 13 μm in diameter, respectively. Consequently, all of the side scattered light may not be collected and/or some of the collected light is out of focus. To quantitate our results further, results for two models of light collection are calculated both of which assume spherical cells.
The radius of each cell, , is estimated from the images by calculating the area, , of the brightfield image using the cell mask and then calculating from the formula . The volume of the cell can then be calculated as . This calculation assumes the cells are spherical which is a good approximation as can be seen from the cells in Fig. 1. The nuclei, however, are not as spherical. Using the (projected) image area of the nucleus will in some cases overestimate the size of the nucleus and in other cases underestimate it. By averaging the radii calculated using the masks generated from nuclei images, a good approximation to the average radii of an equal volume sphere can be obtained for each experiment. Fig. 1(a) to (c) Images of a SiHa cell not exposed to acetic acid. (d) to (f) Images of a SiHa cell exposed to 0.6% acetic acid. The scales on the and axes are in microns. Side scatter intensity is presented on the same log scale for (b) and (e). Hoechst intensity was much greater for acetic acid exposed cells as seen by comparing the intensity scales of (f) and (c).  The top and middle of Fig. 2 are illustrations of a nucleus of radius , and cell of radius , respectively. Both illustrations include a 4-μm thick slice, and the optical light collection axis is vertical in the figure. If scattered light is only collected from a 4-μm thick slice of the cell, then the measurement volume defined by the nuclear mask is . The nuclear volume within this measurement volume is given by in Eq. (1), where is the volume of the nucleus, is the radius of the nucleus, and , when the radius is given in microns. [The volume of a spherical cap is given by .] The total side scattering from the nucleus can then be calculated using Eq. (2), where is the intensity of scattering in an area of the side scattering image corresponding to the nuclear mask and the length unit is microns. The last fraction in Eq. (2) accounts for the fact that a small part of the measurement volume was not the nucleus andFig. 2(a) Illustration of a nucleus, showing the radius and a 4-μm thick slice from which light was collected in the “slice model.” The height of an end cap, , is also shown. (b) Illustration of a cell showing the diameter and a 4-μm thick slice from which light was collected in the “slice model.” (c) A nucleus containing section through the middle of a cell. The nucleus with radius, , is shown and the cell diameter is . For all illustrations, the incident light is from the top of the page.  The volume of the cytoplasm is . The cytoplasmic volume of a 4-μm thick section of the center of the cell is given by Eq. (3), where is the radius of the cell and when the cell radius is given in microns. The total side scattering from the cytoplasm is then given by Eq. (4), where is the total intensity of side scattering in the cellular mask andEquations (2) and (4) are results for the slice model and were used to calculate the percentage of scattering for the nucleus and for the cytoplasm. One caveat to the above calculation is that on average the radius calculated from the projected area will likely overestimate the volume if the object is not spherical. (This result has been proven for convex solids. The surface area of the solid is equal to the projected area times 4.20 The sphere of volume, has the same surface area. A sphere is the three-dimensional solid with the largest volume to surface area ratio. Therefore, the volume of the convex solid is overestimated when using our sphere model.) By assuming that the nuclei are oblate spheroids (i.e., oblate ellipsoids of revolution), an estimate of this effect can be made. The overestimation of volume was 1% and was corrected for in the calculations. In the total model, we assume all scattered light is collected, however, light from the ends of the cell may be out of focus, since the cells are usually more than 10 μm in diameter and the depth of focus of the light collection objective is 4 μm. The volume of a cell seen in cross section as Hoechst stained is shown in the bottom of Fig. 2. Due to defocussing, some of the scattered light from the ends of the cells shown in the bottom of Fig. 2 will show up in the images as light outside of the region shown. To properly account for this effect, the point spread function as a function of displacement along the axis of the collection objective is needed. This information can be approximated by examining the radii of the brightfield images of defocussed cells and knowledge of the distribution of displacements of particles running through the instrument (i.e., variation in the hydrodynamic focussing position.) Using this information, the defocussing of the plain perpendicular to collection axis containing a dotted line was estimated to spread the scattering intensity into an area with a radii 0.4 μm too large. The data were corrected for this defocussing. and are the amount of light scattering from the area of the nuclear and cellular masks, respectively, corrected for defocusing. ( is greater than by only a few percent.) The side scatter intensity from the region of the side scatter image corresponding to Hoechst staining (i.e., the nuclear mask) is from both the nucleus and the cytoplasm. This volume can be described as a cylinder with two spherical caps where the dotted lines in Fig. 2 are the ends of the cylinder. A calculation of the volume is given by Eq. (6), where is the length of the cylinder andThe intensity of light scattering from the cytoplasm per volume, , can be determined using the intensity of scattered light from the area of the cell images not stained with Hoechst and is given in Eq. (7). The fraction of total side scattering from the cytoplasm can then be calculated by multiplying by the cytoplasmic volume and dividing by the total measured scattering. The intensity of light scattering from the nucleus per volume, is given by Eq. (8) and was used to calculate the percent of total side scattering from the nucleus 2.5.Number of ExperimentsFor cells exposed to acetic acid, three separate preparations of MR1 cells were measured with the standard instrument light polarization and three separate preparations of MR1 cells were measured with the light polarization rotated 90 deg. Analogous experiments were done for SiHa cells resulting in 12 separate experiments using cells exposed to acetic acid. The measurements without acetic acid were described earlier.18 They were analogous except that one extra experiment using MR1 cells and the standard instrument polarization was performed for a total 13 experiments using cells not exposed to acetic acid. For each experiment, the presented results are for at least 1100 cells. 3.Results3.1.Example ImagesExample brightfield, log of side scatter, and Hoechst images are shown in Fig. 1 for two SiHa cells. Images of a cell not exposed to acetic acid are on the top row, while images from a cell exposed to 0.6% acetic acid are on the bottom row. The yellow lines show the outline of the masks used to define each cell for the calculations described below. For all cells, these masks were generated using the default mask provided by the Amnis system software and eroding 3 pixels around the circumference of the mask. The masks were reduced in size because visual examination of the images showed that the default mask was bigger than the cell and/or bigger than the side scattering image. The red lines on the Hoechst images are each the outline of the mask defining the nucleus. For each cell, the nuclear mask outline was drawn to include all pixels with intensity values in the upper 80% of the range of pixel intensities of Hoechst fluorescence for that cell. The black lines are each the outline of a region defined by the Hoechst mask just described with areas removed for which LysoSensor fluorescence was in the upper 65% of the range found for that cell. Some of the changes between these two cells are representative of changes accompanying acetic acid exposure. The brightfield images of the acetic acid exposed cells were different from those of the nonacetic acid exposed cells. For SiHa cells, there were often features related to the nucleus perimeter in the brightfield image as is true for Fig. 1(d). For the MR1 cells, this effect was less pronounced, but still noticable for some cells. The side scattering was more intense for cells exposed to acetic acid as is seen in the example of Fig. 1. 3.2.Effects of Staining and Acetic Acid ApplicationIn previous work, we reported that cells stained with Hoechst or cells stained with all three stains had increased side-scattering compared to unstained cells.18 This effect was not significant when the cells were treated with acetic acid. We also reported a small decrease in the size of SiHa cells as well as a very small decrease in nuclear size when all three stains were applied. None of these effects were significant when acetic acid was applied to the cells. The only significant change in cell or nuclear size with staining and treatment with acetic acid was a 2% increase in cell area of MR1 cells when stained with Hoechst only. This result was not significant when all three stains were used. A significance level of 0.05 was used for all calculations. In conclusion, there are no significant effects of staining the cells with Hoechst, LysoSensor, and MitoTracker when the cells were also exposed to acetic acid. Acetic acid has been reported to swells cells and tissue.21,22 Therefore, cell images were examined to determine whether there were differences in the size of cells exposed to acetic acid versus those that were not exposed to acetic acid. The average cell area was computed from the brightfield images for each experiment and then the mean cell size for each of the acetic acid and nonacetic acid experiments were calculated for each cell type resulting in the calculation of 4 means and 4 corresponding standard deviations. These results are shown in Fig. 3 along with nuclear cross sectional areas. There was no significant difference in the size of the MR1 cells treated with acetic acid compared with those not treated with acetic acid. This result is slightly surprising as we have measured transient cell swelling in MR1 cells 5 min after application of 0.3% acetic acid (unpublished data). There was a significant increase in the size of the SiHa cells (). There was no significant difference in nuclear size with 0.6% acetic acid treatment for either cell type. Fig. 3(a) Average cell cross sectional areas based on the masks analogous to the yellow masks outlined in Fig. 1. (b) Average nuclear cross sectional areas based on the masks analogous to the red ones outlined in Fig. 1. Error bars are standard deviations.  The fluorescent stains used in this work were designed for use near neutral pH. Examination of fluorescent images indicated that MitoTracker Orange is not specific for mitochondria in the cells exposed to acetic acid. The overlap of MitoTracker Orange and Hoechst is much greater for the cells exposed to acetic acid than for unexposed cells. Consequently, MitoTracker fluorescence is not analyzed in this paper. LysoSensor Green DND-189 has a pKa of . The pH of the media used for SiHa and MR1 cells with the addition of 0.6% acetic acid was measured to be 4.0 and 3.8, respectively. The exact pH inside the cells is not known, however, there is clearly a general decrease in cellular pH and the specificity of LysoSensor for the normally acetic organelles is not known. The overlap of LysoSensor and Hoechst fluorescence, however, did not increase in the acetic acid exposed cells. 3.3.Changes in Light Scattering when Acetic Acid is AppliedThe application of acetic acid to tissue causes acetowhitening which is at least in part an increase in light scattering from cells near the tissue surface. Figure 4 shows that side scattering is much greater for the cells in 0.6% acetic acid. The increase depends on whether the incident light was polarized parallel or perpendicular to the scattering plane. (The scattering plane is defined as a plane containing both the incident light path and the collection light path.) To understand whether the increases in scattering were due to changes in the nucleus or the cytoplasm, we calculated the scattering of the cytoplasm relative to that of the whole cell, normalized by the relative areas. In Eqs (9) to (11), and are the areas of the cell and nuclear masks examples of which are shown in Fig. 1 and and are the scattering intensities in the area of the side scattering images defined by these masks Fig. 4(a) Side scattering measured with the light polarization in the scattering plane. (b) Percent increase in scattering for the two cell types and two light polarizations used. 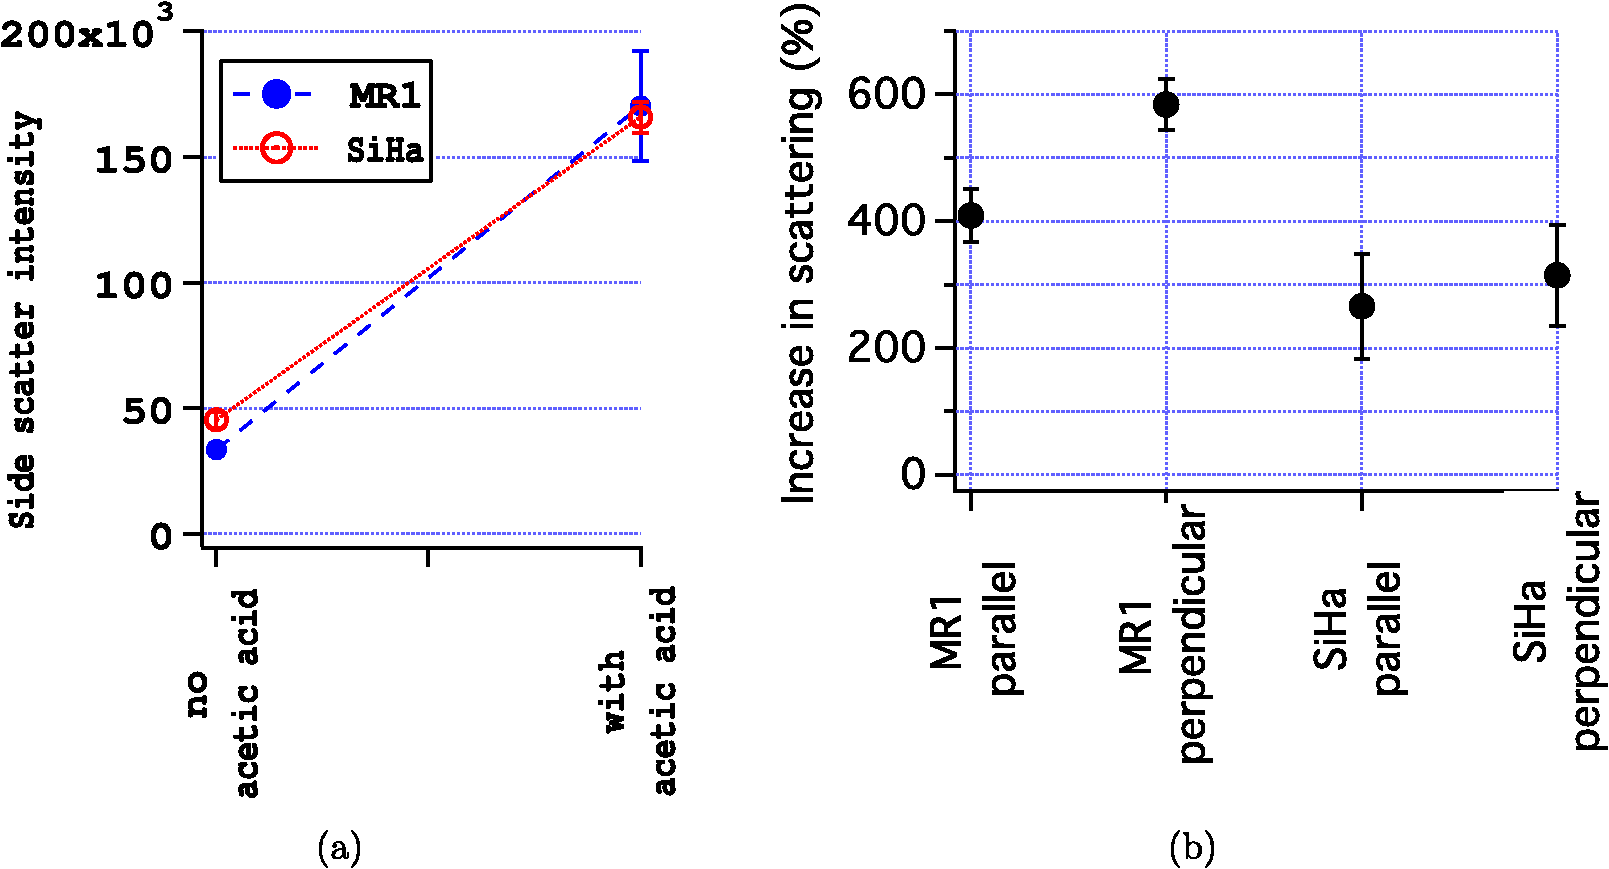 Figure 5 shows the relative efficiency of scattering from the cytoplasm. The side scattering efficiency of the cytoplasm drops when acetic acid is added. Therefore, the relative side scattering efficiency of the nucleus increases. This simple analysis of the data does not take into account the spherical shape of the cell but assumes the cell is cylindrical and that there is no overlap of cytoplasm and nucleus along the axis of light collection. In the following analysis, these assumptions are not made. Nonetheless, the new analysis does not change the qualitative result that acetic acid increases the side scattering efficiency of the nucleus more than the side scattering efficiency of the cytoplasm. Fig. 5Scattering efficiency (defined as integrated intensity per image area) of the cytoplasm relative to that of the cell.  The microscope objective used in these experiments has a depth of field of 4 μm. The MR1 and SiHa cells are about 12 and 13 μm in diameter, respectively. Consequently, all of the side scattered light may not be collected and/or some of the collected light is out of focus. To quantitate our results further, two models of light collection were used both of which assume spherical cells.
The percent of scattering from the nucleus is shown in Fig. 6 for both models and for both cell types. Figure 6(a) are the results for MR1 cells. The percent of scattering from the nucleus increases when acetic acid is present from about 40%–45% to 50%–55% using the slice model. In the total model, the changes are even greater. Figure 6(b) are the results for SiHa cells. The changes are smaller for the SiHa cells. The percent of scattering from the nucleus increases, but not as dramatically as for the MR1 cells. Fig. 6The contributions of the nuclear and cytoplasmic regions to the total side scattering for two different models of light collection. (a) MR1 cells and (b) SiHa cells.  Some differences in the results with the slice model and the total model for MR1 cells are consistent with scattering from organelles being ascribed to the nucleus in the slice model. Scattering efficiencies of the nucleus were calculated using either masks covering the entire nucleus or covering only areas of the nucleus where there was no LysoSensor fluorescence. These calculations were done analogously to those for the cytoplasm described in Eqs. (9) to (11). For MR1 cells, the scattering efficiencies were about 8% higher for the masks covering the entire nucleus, indicating that stronger scattering was occurring from LysoSensor stained areas. For the SiHa cells, there was no difference in the scattering efficiencies for the two masks, meaning either that the light scattering from the Hoechst stained regions was purely from the nucleus (since the SiHa cells are larger) or that scattering efficiency was similar for LysoSensor and Hoechst stained areas. The results of Fig. 6 clearly show that the nuclear scattering increases more than cytoplasmic scattering. The data in Figs. 4 and 6 can be combined to estimate how much scattering from the nucleus and cytoplasm increase, respectively. The results are given in Table 1. Table 1Percent increase in scattering upon 0.6% acetic acid application.
4.DiscussionCytokeratin 10 expression has been hypothesized to be required for acetowhitening.11 The strong increase in light scattering for MR1 cells which do not express cytokeratins demonstrates that cytokeratins are not critical for acetowhitening. To test the hypothesis that nucleoprotein precipitation is the cause of acetowhitening,10 the increase in side scattering in the cytoplasmic and nuclear regions of the cells was quantified. In all cases there were significant increases in both nuclear and cytoplasmic scattering. Nucleoprotein precipitation may account for the increase in scattering in the nucleus upon acetic acid application, but it does not account for the changes in the cytoplasm. The strong increase in light scattering by MR1 cells demonstrates that acetowhitening can occur in vitro without HPV being present. This result is consistent with a clinical study showing that 14% of patients presenting with acetowhite lesions did not have HPV.8 In the same study, 87% of patients without acetowhite lesions had HPV. There may not be any connection between acetowhitening and HPV. An alternative hypothesis is that acetowhitening occurs in response to changes caused by high-risk HPV types as well as other changes in tissue, such as metaplasia. Our results demonstrate that wide angle side scattering increases from both the nucleus and the cytoplasm regardless of which model of light collection (slice or total) we use in analyzing the data (Table 1). The calculated increases in nuclear scattering upon acetic acid addition are less in the “slice model” than the “total model” possibly because some of the scattering attributed to the nucleus was actually from the cytoplasm. Having some of the cytoplasmic scattering attributed to the nucleus also means that the slice model may overestimate the scattering from the nucleus in Fig. 6. Nonetheless, use of the two models provides limits on the results and demonstrates that the qualitative results are not model dependent. The true results are likely in between those of the slice model and the total model; closer to those of the total model. A striking result when the “total model” of light collection is used is that scattering from nuclei of MR1 cells increases by a factor of 8 or 18 depending on whether the incident light is parallel or perpendicular to the scattering plane. In the slice model, a similar dependence on polarization was seen. This dependence on polarization provides information on the size of the scattering centers generated or changed by acetic acid application. Light scattering from a distribution of large particles () is independent of polarization.23 However, light scattering from small particles is greater when the polarization is perpendicular to the scattering plane (see for example Ref. 24). Therefore, the acetic acid must have caused an increase in either the number or refractive index of scattering centers that are much smaller than the wavelength of light in the nuclei of MR1 cells. The increase in light scattering from the nuclei in SiHa cells is less and does not show a dependence on light polarization. Therefore, some of the mechanisms of acetowhitening may be different between these two cell lines. Angular dependent scattering from isolated nuclei, isolated mitochondria, as well as from the cytoplasmic fraction have been previously reported for SiHa cells with and without 0.3% acetic acid.12 The increase in scattering was small or insignificant at small angles for all three suspensions. For the nuclei and cytoplasmic fraction, the change in scattering increases with angle to about 90 deg and then stays nearly constant. The increase in scattering for the acetic acid containing suspensions was greater for the cytoplasmic fraction than for the nuclear fraction. For the mitochondrial suspension, the increase in scattering with 0.3% acetic acid was small at all angles. The results for isolated cell components may not completely mimic the changes of those components in the cell. The nucleus has the ability to regulate its own pH which is typically slightly higher than that of the cytoplasm25 and under acidic conditions, the nuclear pH may not drop as much as the cytoplasmic pH.26 In our work presented here, changes in nuclear and cytoplasmic scattering were measured in intact cells and the results demonstrate that the change in nuclear light scattering when acetic acid is present is greater than that of the cytoplasm. Confocal images of SiHa cells and cervical tissue before and after the application of 6% acetic acid using 808 nm excitation have also been reported.15 In both the cells and excised tissue, an increase in backscattering was seen from the nucleus. In some of the excised tissue specimens, a slight increase in cytoplasmic scattering was also noted. In our work using SiHa cells, the increase in side scattering was less than a factor of two different between the nucleus and the cytoplasm for the slice model and less than a factor of 3 different in the total model (Table 1). Our work did not measure backscattering, but rather measured wide (97 deg) angle side scatter. Potentially, this is the cause of the discrepancy in results. Alternatively, the difference in results could be caused by the difference in acetic acid concentrations used. In this work, we used 0.6% acetic acid, in vivo 3% to 5% acetic acid is typically applied to the cervix. The epithelium of the cervix, like all epithelia, is a barrier that regulates the flow of molecules. The ectocervix is comprised of stratified squamous epithelium. The top layer of the epithelium is comprised of glycogen containing, cornified cells.27 Some cornified epithelial layers provide significant protection to the underlying epithelial cells,28 however, we have not been able to find proof of this for the specific case of the cervical epithelium. A few cell layers down tight junctions between cells restrict the movement of molecules passing between the cells.27 The concentration of acetic acid is likely much less in the lower layers of the epithelium. This view is supported by modeling of acetic acid in the epithelium.29 While we do not know the exact concentration of acetic acid in the epithelium, we do know that fairly low concentrations of acetic acid can cause permanent damage to cells in vitro. We performed measurements of the ability of MR1 and SiHa cells to continue growing in vitro after application of acetic acid which demonstrated that after only 5 min in 0.3% acetic acid, the ability of these cells to grow was greatly reduced (unpublished data). Similarly, Wu and Qu12 used 0.3% and 0.6% acetic acid in their work and reported that permanent cell damage occurred when concentrations of 1.2% or more was used. Therefore, we chose a concentration of acetic acid that was expected to provide a large affect, but not immediately kill the cells. When comparing the concentration of acetic acid used in this work to that used in vivo, another important factor is that the buffering capicity of cellular tissue is likely very different from that of cell culture. There are many more cells in a given volume and fluid movement in the epithelium and blood flow under the epithelium may also provide additional pH buffering. A low concentration of acetic acid in vitro may have effects on cells similar to those that occur when a higher concentration of acetic acid is used in vivo. In vivo, the concentration of acetic acid in tissue is likely changing over time as the acetic acid is diluted both by passive and active processes. The effect of acetic acid on cells, depends on how long cells have been exposed and at what concentration. Here we studied a static exposure to acetic acid. Studies of other concentrations and exposure times will be needed to determine if the nucleus and cytoplasm respond similarly to other conditions. Our results are for 785 nm excitation. This wavelength is sometimes used in optical diagnostics, but it is not visible except at very high intensities. The acetowhitening seen by clinicians is from light scattering at shorter, visible wavelengths. The results presented here will change slightly at the shorter wavelengths. The intensity of light scattering from particles much smaller than the wavelength of light being used goes as . Therefore, more light scattering would be expected from particles that are a few 10’s of nm or less in size. For MR1 cells, which demonstrated an increase in small scattering centers in the nucleus upon acetic acid application, the increase in nuclear scattering might be even more pronounced. Acetic acid application is sensitive but not specific for high grade squamous epithelial lesions (HSIL) of the cervix which are a precancerous lesion requiring treatment. In one study, 93% of women with HSIL had acetowhite lesions. However, 74% of women without HSIL also had acetowhite lesions.30 The same paper reports that sensitivity is best when the presence of an acetowhite lesion rather than detailed colposcopic grading is used to decide whether to biopsy. To avoid unnecessary biopsies and their associated costs and patient stress, improvements in the techniques for choosing when and where to biopsy are needed. Measurements of the changes in light scattering over time after acetic acid application are being investigated as a means to improve biopsy choice.29 However, colposcopic examination of a patient in real-time versus examination of a still image has been reported to have no clinically meaningful difference.30 5.ConclusionsA better understanding of how acetic acid causes acetowhitening and what properties of a cell or tissue cause acetowhitening can potentially lead to new or improved techniques to biopsy only precancerous or cancerous lesions in a wide variety of tissues. Combining our results with information in the literature we reach the following conclusions.
AcknowledgmentsWe thank Hongzhao Tian for performing the cell culture. This work was supported by National Institutes of Health grant CA071898 and by the Los Alamos National Flow Cytometry Resource funded by the National Center for Research Resources of NIH (Grant P41-RR01315). ReferencesG. Longcroft-Wheatonet al.,
“Acetic acid spray is an effective tool for the endoscopic detection of neoplasia in Barrett’s esophagus,”
Clin. Gastroenterol. Hepatol., 8
(10), 843
–847
(2010). http://dx.doi.org/10.1016/j.cgh.2010.06.016 CGHLAW 1542-3565 Google Scholar
K. Yagiet al.,
“The study of dynamic chemical magnifying endoscopy in gastric neoplasia,”
Gastrointest. Endosc., 62
(6), 963
–969
(2005). http://dx.doi.org/10.1016/j.gie.2005.08.050 GAENBQ 0016-5107 Google Scholar
Y. Kawaharaet al.,
“Novel chromoendoscopic method using an acetic acid- indigocarmine mixture for diagnostic accuracy in delineating the margin of early gastric cancers,”
Dig. Endosc., 21
(1), 14
–19
(2009). http://dx.doi.org/10.1111/den.2009.21.issue-1 0915-5635 Google Scholar
K. Bhalanget al.,
“The application of acetic acid in the detection of oral squamous cell carcinoma,”
Oral Surg. Oral Med. Oral Pathol. Oral Radiol. Endod., 106
(3), 371
–376
(2008). http://dx.doi.org/10.1016/j.tripleo.2008.01.017 Google Scholar
G. D’Souzaet al.,
“Case-control study of human papillomavirus and oropharyngeal cancer,”
N. Engl. J. Med., 356 1944
–1956
(2007). http://dx.doi.org/10.1056/NEJMoa065497 NEJMAG 0028-4793 Google Scholar
A. Iyeret al.,
“Human papilloma virus is detectable in Barrett’s esophagus and esophageal carcinoma but is unlikely to be of any etiologic significance,”
J. Clin. Virol., 50
(3), 205
–208
(2011). http://dx.doi.org/10.1016/j.jcv.2010.11.015 JCVIFB 1386-6532 Google Scholar
S. RajendraJ. K. Robertson,
“Similar immunogenetics of Barrett’s oesophagus and cervical neoplasia: is HPV the common denominator?,”
J. Clin. Pathol., 63
(1), 1
–3
(2009). http://dx.doi.org/10.1136/jcp.2009.067447 JCPAAK 0021-9746 Google Scholar
L. Rocha-Zavaletaet al.,
“Molecular evaluation of the prevalence of oncogenic human papillomavirous genotypes in cervical acetowhite lesions,”
Intervirology, 45
(2), 111
–114
(2002). http://dx.doi.org/10.1159/000063234 IVRYAK 0300-5526 Google Scholar
A. Singeret al., Singer and Monaghan’s Cervical and Lower Genital Tract Precancer: Diagnosis and Treatment, 38 2nd ed.John Wiley & Sons, Limited, Malden, Mass
(2000). Google Scholar
A. B. MacLean,
“Acetowhite epithelium,”
Gynecol. Oncol., 95
(3), 691
–694
(2004). http://dx.doi.org/10.1016/j.ygyno.2004.08.006 GYNOA3 Google Scholar
P. Maddoxet al.,
“Cytokeratin expression and acetowhite change in cervical epithelium,”
J. Clin. Pathol., 47
(1), 15
–17
(1994). http://dx.doi.org/10.1136/jcp.47.1.15 JCPAAK 0021-9746 Google Scholar
T. T. WuJ. Y. Qu,
“Assessment of the relative contribution of cellular components to the acetowhitening effect in cell cultures and suspensions using elastic light-scattering spectroscopy,”
Appl. Opt., 46
(21), 4834
–4842
(2007). http://dx.doi.org/10.1364/AO.46.004834 APOPAI 0003-6935 Google Scholar
T. Collieret al.,
“Near real time confocal microscopy of amelanotic tissue: dynamics of acetowhitening enable nuclear segmentation,”
Opt. Express, 6
(2), 40
–48
(2000). http://dx.doi.org/10.1364/OE.6.000040 OPEXFF 1094-4087 Google Scholar
A. F. Zuluagaet al.,
“Contrast agents for confocal microscopy: how simple chemicals affect confocal images of normal and cancer cells in suspension,”
J. Biomed. Opt., 7
(3), 398
–403
(2002). http://dx.doi.org/10.1117/1.1481047 JBOPFO 1083-3668 Google Scholar
R. A. Drezeket al.,
“Laser scanning confocal microscopy of cervical tissue before and after application of acetic acid,”
Am. J. Obstet. Gynecol., 182
(5), 1135
–1139
(2000). http://dx.doi.org/10.1067/mob.2000.104844 AJOGAH 0002-9378 Google Scholar
T. T. Wuet al.,
“Study of dynamic process of acetic acid induced- whitening in epithelial tissues at cellular level,”
Opt. Express, 13
(13), 4693
–4973
(2005). http://dx.doi.org/10.1364/OPEX.13.004963 OPEXFF 1094-4087 Google Scholar
L. A. Kunz-SchughartA. SimmW. Mueller-Kleiser,
“Oncogene-associated transformation of rodent fibroblasts is accompanied by large morphologic and metabolic alterations,”
Oncol. Rep., 2
(4), 651
–661
(1995). OCRPEW 1021-335X Google Scholar
O. C. MarinaC. K. SandersJ. R. Mourant,
“Correlating light scattering with internal cellular structures,”
Biomed. Opt. Express, 3
(2), 296
–312
(2012). http://dx.doi.org/10.1364/BOE.3.000296 BOEICL 2156-7085 Google Scholar
W. E. Ortynet al.,
“Sensitivity measurement and compensation in spectral imaging,”
Cytometry A, 69
(8), 852
–862
(2006). http://dx.doi.org/10.1002/(ISSN)1552-4930 1552-4922 Google Scholar
V. Vouk,
“Projected area of convex bodies,”
Nature, 162
(4113), 330
–331
(1948). http://dx.doi.org/10.1038/162330a0 NATUAS 0028-0836 Google Scholar
D. O. HammondD. SeckingerC. Keefe,
“Effects of dilute acetic acid on cancer cytology. I. effects on normal tissue,”
J. Reprod. Med., 25
(3), 97
–100
(1980). JRPMAP Google Scholar
S. Pallagattiet al.,
“A new ray in the diagnosis of oral lesions,”
Indian J. Dent. Res., 22
(6), 810
–815
(2011). Google Scholar
T. M. JohnsonJ. R. Mourant,
“Polarized wavelength-dependent measurements of turbid media,”
Opt. Express, 4
(6), 200
–216
(1999). http://dx.doi.org/10.1364/OE.4.000200 OPEXFF 1094-4087 Google Scholar
G. C. Salzman,
“Light scatter: detection and usage,”
Curr. Protoc. Cytom, 9 1.13.1
–1.13.8
(1999). Google Scholar
O. SeksekJ. Bolard,
“Nuclear pH gradient in mammalian cells revealed by laser microspectrofluorimetry,”
J. Cell Sci., 109
(Pt. 1), 257
–262
(1996). JNCSAI 0021-9533 Google Scholar
A. Masudaet al.,
“Regulation of cytoso–nucleus pH gradients by exchange mechanism in the nuclear envelope of neonatal rat astrocytes,”
Brain Res., 807
(1–2), 70
–77
(1998). http://dx.doi.org/10.1016/S0006-8993(98)00737-9 BRREAP 1385-299X Google Scholar
C. D. BlaskewiczJ. PudneyD. J. Anderson,
“Structure and function of intercellular junctions in human cervical and vaginal mucosal epithelia.,”
Biol. Reprod., 85
(1), 97
–104
(2011). http://dx.doi.org/10.1095/biolreprod.110.090423 BIREBV 0006-3363 Google Scholar
A. E. KalininA. V. KajavaP. M. Steinert,
“Epithelial barrier function: assembly and structural features of the cornified cell envelope,”
BioEssays, 24
(9), 789
–800
(2002). http://dx.doi.org/10.1002/(ISSN)1521-1878 BIOEEJ 0265-9247 Google Scholar
C. BalasG. PapoutsoglouA. Potirakis,
“In vivo molecular imaging of cervical neoplasia using acetic acid as biomarker,”
IEEE J. Sel. Topics. Quantum Electron., 14
(1), 29
–42
(2008). http://dx.doi.org/10.1109/JSTQE.2007.913396 IJSQEN 1077-260X Google Scholar
L. S. Massadet al.,
“The accuracy of colposcopic grading for detection of high-grade cervical intraepithelial neoplasia,”
J. Low Genit. Tract. Dis., 13
(3), 137
–144
(2009). http://dx.doi.org/10.1097/LGT.0b013e31819308d4 Google Scholar
|
|||||||||||||||||||||||||||||


