
|
|
1.IntroductionTissue optics has been widely utilized in laser-based therapeutic and diagnostic techniques.1–5 However, the turbidity of biological tissues, which imposes limitation on light penetration depth, has severely affected its biomedical application. Recent progress in engineered tissue optics provides a useful means to enhance light penetration into turbid tissues, which allows reversibly altering the light scattering and absorption properties of turbid biological tissues in a controllable manner.6–9 This approach, for example, leads to enhanced signal detection in optical coherence tomography (OCT).10 Tissue optical clearing, which uses hyperosmotic agents [optical clearing agents (OCA)] to modify biological tissue’s scattering property and refractive index, holds great promise in reducing light scattering in turbid biological tissues and enhancing optical penetration depth.11–14 Three hypothesized mechanisms of tissue optical clearing induced by hyperosmotic agents have been proposed: (1) dehydration of tissue constituents; (2) partial replacement of the interstitial fluid by the immersion substance; and (3) structural modification or dissociation of structured proteins, such as collagen.7,8,15–17 The first and second mechanisms are supposed to be the primary factors that contribute to the refractive indices’ match of tissue components. OCT, as an advanced high-resolution structural imaging technology based on low coherence interferometry, has shown great promise in noninvasive real-time diagnosis.18–20 Breast cancer is the most frequently diagnosed cancer and the leading cause of cancer death in females worldwide, according to 1.38 million new cancer cases and 4,58,400 deaths in 2008.21,22 A noninvasive and effective diagnostic technique is urged for early breast cancer detection and OCT technology can be the possible means. Because of the pathological changes of cancer tissue’s morphology and structure, the diversity of permeability and optical property occurs between normal tissue and cancerous tissue. Based on the differences in permeability and optical property, OCT technology can be used to distinguish cancerous tissues from normal tissues. This method has been demonstrated by previous studies,23–25 and has also been applied for breast cancer detection.26,27 Glucose (G) is one of the most commonly used OCAs which have been widely used to investigating the permeability of biological tissues. Mannitol (M) is a hyperosmotic agent with similar molecular weight to glucose. The optical clearing efficacy and the potential in cancer diagnostic of these agents have been investigated in our previous study.27 However, the low permeation efficiency of hyperosmotic agents in biological tissues limits its practical implementation. To improve the permeability of biological tissues, a number of different chemical and physical methods have been proposed, such as chemical enhancer,28 electroporation,29 iontophoresis,30 microneedle,31 sonophoresis (ultrasound),32 etc. Despite the widespread use of ultrasound (US) in transdermal drug delivery (TDD), there are few studies to apply ultrasound on inner tissue optical clearing. Recently, Zhong et al. reported that sonophoresis, as a noninvasive physical method, exhibited an enhancing breast tissue clearing effect when applied with glycerol and the results indicated that this method was feasible.33 The application of ultrasound can result in cavitation, thermal and mechanical effects in biological tissues, and thus enhances the permeation of OCA.34 Nevertheless, more studies are needed to make sure of the synergistic effect of ultrasound with hyperosmotic agents in different tissues, which will contribute to finding an optimal OCA and make optical clearing technique more practical. In order to find a more efficient way to enhance the diffusion of glucose and mannitol in inner tissues, we investigated the optical clearing efficacy of 20% G and 20% M in human breast cancer tissue (BC) and normal breast tissue (NB) in vitro with the synergistic treatment of ultrasound. The diffusion process of the agents in breast cancer tissue and normal breast tissue were monitored with a spectral domain OCT during the experiment. This research may improve the capability of OCT utilized in cancer detection and help patients with breast cancer by providing prompt diagnosis. 2.Materials and Methods2.1.Experimental SetupThe experiments were performed with a spectral domain OCT system (SD-OCT). The optical source used in this system is a low-coherence broadband super luminescent diode with a wavelength of and an output power of 5 mW. The SD-OCT system provides an axial resolution of 12 µm and a transverse resolution of 15 µm in free space, determined by the focal spot size of the probe beam. The signal-to-noise ratio of the OCT system is measured to be 120 dB. Two-dimensional (2-D) images are obtained by scanning the incident beam over the sample surface in the lateral direction and in-depth (A-scan) scanning by the interferometer. The acquisition time per OCT image is about 180 ms, corresponding to an A-scan frequency of 2000 Hz. A computer is used to control the OCT system with a data acquisition software written in Lab View 7.2-D. OCT images obtained in the experiment were stored in the computer for further processing. In this experiment, a sonicator (DM-F608, Dimyth Beauty Equipment Manufacture, Guangzhou, China) with a frequency of about 1 MHz and an intensity of was used for ultrasound application. Sonicator with this frequency is usually used for cosmetic treatments and TDD. In order to avoid any thermal effect, a transducer with a diameter of about 0.8 cm was used with a pulsed mode (500 ms pulses applied every second). During sonication, the ultrasound probe was immersed in the topical applied physiological saline with sufficient contact pressure. The temperature of the specimens was measured periodically with a thermocouple (Digithermo, VWR Scientific, PA, USA). No significant increase in temperature () was observed during ultrasound exposure. 2.2.Samples and AgentsExcised surgical specimens were collected from ten female patients. All the breast tissues were stored in a refrigerator at until measurement. During the experiment, histology samples were grouped into two critical cases: normal breast tissues and ductal carcinoma (the most common breast cancer) tissues. Before experiment, glucose and mannitol solution with the same concentration of 20% () were prepared using standard method. The materials with lateral dimension of approximately were prepared in freezing state. All the samples were divided into eight groups, as showed in Table 1, and each group contain six specimens. At the beginning, samples were unfrozen in physiological saline at room temperature for 30 min. In order to get a baseline, the selected region of each sample was monitored about 8 to 10 min by OCT system before applying hyperosmotic agents and ultrasound. In the sonophoresis experiments, ultrasound was applied for 10 min at each sample before surface applying hyperosmotic agents. With the administration of hyperosmotic agents, the samples were immediately monitored with 2-D OCT functional imaging for the next 2 h at 22°C. Each sample was used only once. Table 1Groups and treatment in this experiment.
2.3.MethodsIn order to characterize the changes of optical properties in the breast tissues during the experiment, the attenuation coefficients of each group were calculated from the 2-D OCT image, as it carries the information of the reflected light intensity distribution in depth of the tissue. The reflected light intensity depends on the tissue’s optical property, i.e., the absorption coefficient () and scattering coefficient (), or called total attenuation coefficient () which equals the sum of scattering coefficient (), and absorption coefficient (). For collimated light propagation in relatively transparent tissues, it is assumed that the reflected light intensity distribution follows Beer’s Law where with is the light intensity at the depth from tissue surface and is the incident light intensity, and the depth from tissue surface. In the OCT system case, Eq. (1) is transformed to be35,36 where , and are the reflected light intensity at the selected depth and , respectively. The factor of two in the exponential accounts for the light passing through the tissue twice after being backscattered. Therefore, can be obtained theoretically from the OCT signal intensity measurements at two different depths:An averaged optical intensity profile that represents the reflected light intensity distribution in depth is obtained by averaging the 2-D image laterally over 1 mm, which is wide enough for speckle noise suppression. As noise is inevitable in the measurement, a best-fit exponential curve is applied to the averaged intensity profiles of each group. The permeability coefficients of hyperosmotic agents in the breast tissue were calculated with the OCT signal slope (OCTSS) method.37,38 The permeability coefficient is obtained by analyzing the changes of OCTSS in a selected region during the diffusion process of hyperosmotic agents. A linear region with minimal fluctuation in the averaged OCT signal profile is selected and its physical thickness () is measured (assuming the refractive index of 1.4). The OCTSS of the linear region for each image is computed with a Matlab program. The increasing concentration of hyperosmotic agents in the selected region induces the decrease of the scattering, which is clearly reflected in the OCTSS graph. The diffusion time () is measured from the point where the OCTSS started to decrease to the point at which a reverse process takes place. The permeability coefficient () is calculated by dividing the thickness of the linear region () by the diffusion time ():37 3.Result and DiscussionContinuous monitoring of the tissues during the 2 h permeation experiments were performed by 2-D OCT imaging for each group. With the same condition and procedure, six independent experiments were carried out for each group. Figures 1(a) and 2(a) are the typical OCT images of normal breast tissue and breast cancer tissue, respectively. Figures 1(b) and 2(b) are the averaged intensity profiles extracted from Figs. 1(a) and 2(a). By analyzing Figs. 1 and 2, it is obvious that the structure of normal breast tissue is more homogeneous than that of breast cancer tissue. Besides, the OCT signal intensity in breast cancer tissue is about 10 percent lower than that in normal breast tissue. It means that the scattering in the tumor tissue is stronger than that in normal breast tissue. The difference in optical property between normal breast tissue and breast cancer tissue may be induced by the morphological and structural differences between the two types of tissues, such as larger nuclei, the higher nuclear-to-cytoplasmic ratio in tumor cells, and the higher regional tumor cell density of the tumor tissues.23 Fig. 1(a) The typical OCT image of normal breast tissue and (b) the averaged OCT signal profile versus depth extracted from the selected region in OCT image (a).  Fig. 2(a) The typical OCT image of breast cancer tissue and (b) the averaged OCT signal profile versus depth extracted from the selected region in OCT image (a).  The attenuation coefficients of each group at different time were calculated from the data of the best exponential fit curve corresponding to the averaged intensity profiles. The selected region is from the depth of 110 µm () to the depth of 280 µm (), where the OCT signal distribution is relatively smooth. Figure 3 presents the attenuation coefficients of normal breast tissue at 0, 5, 15, 30, 45, and 60 min after topical applying 20% G, in which the magenta bar stand for the ultrasound treated group and the yellow bar represent untreated group. Figure 4 shows the changes of the attenuation coefficients in breast cancer tissue treated with 20% G and 20% G/US, respectively. The attenuation coefficients of normal breast tissue are for 20% G and for 20% G/US at 0 min, but it changed to be for 20% G and for 20% G/US at 45 min when the diffusion process reached the stable state. As to breast cancer tissue, the attenuation coefficients are for 20% G and for 20% G/US at 0 min, while at 30 min, it is for 20% G and for 20% G/US. By analyzing these data, it is obvious that the attenuation coefficients in the same kind of breast tissues are almost equal at the beginning no matter whether treated with ultrasound or not (). However, a significant difference in the attenuation coefficients occurs between the groups treated with ultrasound and that without during the agents’ diffusing process (). The attenuation coefficient was reduced by about 52% in normal breast tissue after 45 min treatment of 20% G; while with the treatment of 20% G/US, the attenuation coefficient was decreased by approximately 66%. The similar result was also observed in skin tissue.39 This phenomenon could be induced by the cavitation effect of ultrasound, which has been demonstrated in TDD experiments.34 This effect not only makes biological tissues more permeable but also promotes more hyperosmotic agents penetrating into tissues. Therefore, the refractive indices of the tissue components match better, which reflects in a low attenuation coefficient. Ultrasound has shown the similar effect as a penetration enhancer in the 20% M penetration experiment whose data are not shown. The results have demonstrated that ultrasound has a positive effect on the optical clearing of tissues, and there is a significant difference in the attenuation coefficients between normal breast tissue and tumor tissue (). Fig. 3The attenuation coefficients of normal breast tissue at 0, 5, 15, 30, 45 and 60 min after topical applying 20%G, in which the yellow bar represent the control group and the magenta bar stand for the ultrasound treated group. 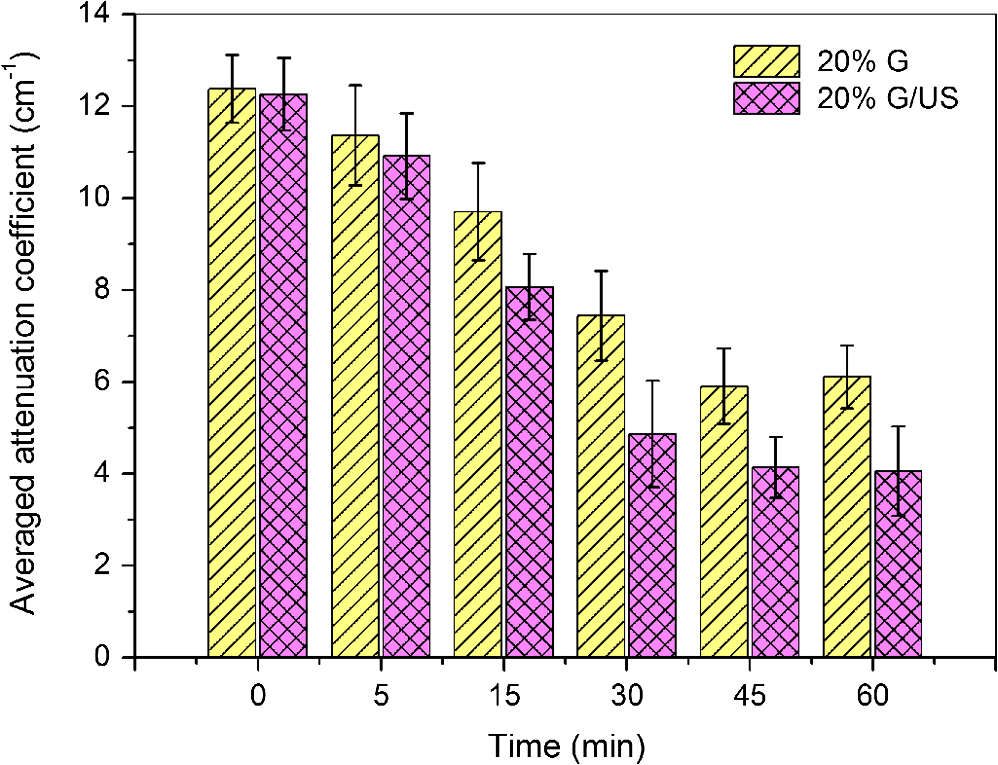 Fig. 4The attenuation coefficients of breast cancer tissue at 0, 5, 10, 20, 30 and 45 min after topical applying 20% glucose, in which the yellow bar represent the control group and the magenta bar stand for the ultrasound treated group.  For further study of the effect of ultrasound as an important penetration enhancer, the permeability coefficient, as an important parameter for tissue optical clearing, was also calculated using OCTSS method. The OCTSS was calculated in the range of about 200 µm at depth of approximately 150 µm away from the tissue surface. Figures 5 and 6 present the changes of OCTSS over time for breast tissues treated with 20% G/US and 20% M/US, respectively. The OCTSS decreased prominently during the diffusion process after the treatment of ultrasound. The decreasing of the OCTSS means that more photons get into the tissues and the scattering inside the tissues is reduced with the diffusion of the agents. In Fig. 5(a), glucose solution reached the monitored region at approximately 12 min after treated with ultrasound and took another 28 min for it to complete diffusion in normal breast tissues; while it only took 11 min to completely diffuse though the whole region for the breast cancer tissues with the same condition [Fig. 5(b)]. Although both being treated with ultrasound, the diffusion of 20% M in the breast cancer tissue just used about 16 min to diffuse through the selected region, while it took about 34 min in normal breast tissue. Consequently, the diffusion process in breast cancer tissue is much faster than that in normal breast tissue, which is consistent well with our former studies.26,27 The permeability coefficients of all groups are shown in Table 2. The results of this study indicated that the permeability coefficient of hyperosmotic agents in the same kind of breast tissues after treating with ultrasound is larger than that without ultrasound (). The permeability coefficient of 20% M in normal breast tissues was enlarged 36% by ultrasound; and in breast cancer tissue, ultrasound has enlarged the permeability of 20% M by about 59%. Compared with the permeability coefficients of the breast tissue without ultrasound, which has been present in our previous study,27 one can conclude that the agents’ diffusion process has been dramatically accelerated by the sonophoresis. This is consistent with the previous findings that ultrasound can improve the permeability of biological tissues.40–42 Moreover, there is a significant difference in permeability coefficients between breast cancer tissues and normal breast tissues with the same treatment (). Fig. 5OCT signal slope as a function of time recorded from (a) normal breast tissue and (b) cancerous tissue during 20% glucose diffusion process, both with the treatment of ultrasound.  Fig. 6OCT signal slope as a function of time recorded from (a) normal breast tissue and (b) cancerous tissue during 20% mannitol diffusion process, both with the treatment of ultrasound.  Table 2The permeability coefficient of each group for breast tissues.
4.ConclusionIn this study, we have demonstrated the efficacy of glucose and mannitol in low concentration as OCA in breast tissues. In addition, the results indicates that there is a dramatic difference in optical property between normal breast tissue and breast cancer tissue. Due to the difference in structure and morphology, the attenuation coefficient in breast cancer tissues is larger than that in normal breast tissues. Most importantly, we have done particular research on the influence of ultrasound to the diffusion process as an important penetration enhancer. Results suggest that sonophoresis can accelerate the diffusion process of hyperosmotic agents and improve the effect of optical clearing. Therefore, it has a potential to become a useful tool for the enhancement of tissues’ permeability and optical clearing. AcknowledgmentsThis work was supported by the National Natural Science Foundation of China (Grant No. 60778047), the Natural Science Foundation of Guangdong Province (Grant No. 06025080), the Key Science and Technology Project of Guangdong Province of China (Grant No. 2005B50101015 and Grant No. 2008B090500125), and the Key Science and Technology Project of Guangzhou City of China (Grant No. 2008Z1-D391). ReferencesL. T. Perelman,
“Optical diagnostic technology based on light scattering spectroscopy for early cancer detection,”
Expert Rev. Med. Devices, 3
(6), 787
–803
(2006). http://dx.doi.org/10.1586/17434440.3.6.787 1743-4440 Google Scholar
S. A. Boppartet al.,
“Intraoperative assessment of microsurgery with three-dimensional optical coherence tomography,”
Radiology, 208
(1), 81
–86
(1998). RADLAX 0033-8419 Google Scholar
R. L. P. van Veenet al.,
“Intraoperatively assessed optical properties of malignant and healthy breast tissue used to determine the optimum wavelength of contrast for optical mammography,”
J. Biomed. Opt., 9
(6), 1129
–1136
(2004). http://dx.doi.org/10.1117/1.1803547 JBOPFO 1083-3668 Google Scholar
K. Sokolovet al.,
“Polarized reflectance spectroscopy for pre-cancer detection,”
Technol. Cancer Res. Treat., 3
(1), 1
–14
(2004). 1533-0346 Google Scholar
N. Agrawalet al.,
“Wavelet transform of breast tissue fluorescence spectra—a technique for diagnosis of tumors,”
IEEE J. Sel. Top. Quantum Electron., 9
(2), 154
–161
(2003). http://dx.doi.org/10.1109/JSTQE.2003.813318 IJSQEN 1077-260X Google Scholar
V. V. Tuchinet al.,
“Light propagation in tissues with controlled optical properties,”
Proc. SPIE, 2925 118
–142
(1996). http://dx.doi.org/10.1117/12.260832 PSISDG 0277-786X Google Scholar
A. T. Yehet al.,
“Reversible dissociation of collagen in tissues,”
J. Invest. Dermatol., 121 1332
–1335
(2003). http://dx.doi.org/10.1046/j.1523-1747.2003.12634.x JIDEAE 0022-202X Google Scholar
A. T. YehJ. Hirshburg,
“Molecular interactions of exogenous chemical agents with collagen—implications for tissue optical clearing,”
J. Biomed. Opt., 11
(1), 014003
(2006). http://dx.doi.org/10.1117/1.2166381 JBOPFO 1083-3668 Google Scholar
E. A. GeninaA. N. BashkatovV. V. Tuchin,
“Tissue optical immersion clearing,”
Expert Rev. Med. Devices., 7
(6), 825
–842
(2010). http://dx.doi.org/10.1586/erd.10.50 1743-4440 Google Scholar
R. K. Wang,
“Tissue clearing as a tool to enhance imaging capability for optical coherence tomography,”
Proc. SPIE, 4619 22
–25
(2002). http://dx.doi.org/10.1117/12.470494 PSISDG 0277-786X Google Scholar
V. V. Tuchin,
“Optical clearing of tissue and blood using immersion method,”
J. Phys. D, 38
(15), 2497
–2518
(2005). http://dx.doi.org/10.1088/0022-3727/38/15/001 JPAPBE 0022-3727 Google Scholar
J. Jianget al.,
“Penetration kinetics of dimethyl sulphoxide and glycerol in dynamic optical clearing of porcine skin tissue in vitro studied by Fourier transform infrared spectroscopic imaging,”
J. Biomed. Opt., 13
(2), 021105
(2008). http://dx.doi.org/10.1117/1.2899153 JBOPFO 1083-3668 Google Scholar
R. V. Kuranovet al.,
“In vivo study of glucose-induced changes in skin properties assessed with optical coherence tomography,”
Phys. Med. Biol., 51
(16), 3885
–3900
(2006). http://dx.doi.org/10.1088/0031-9155/51/16/001 PHMBA7 0031-9155 Google Scholar
I. V. Larinaet al.,
“Enhanced OCT imaging of embryonic tissue with optical clearing,”
Laser Phys. Lett., 5
(6), 476
–479
(2008). http://dx.doi.org/10.1002/(ISSN)1612-202X 1612-2011 Google Scholar
C. G. Rylanderet al.,
“Dehydration mechanism of optical clearing in tissue,”
J. Biomed. Opt., 11
(4), 041117
(2006). http://dx.doi.org/10.1117/1.2343208 JBOPFO 1083-3668 Google Scholar
R. K. Wang,
“Role of mass diffusion and water desorption on optical clearing of biological tissue immersed with the hyperosmotic agents,”
Proc. SPIE, 5330 160
–166
(2004). http://dx.doi.org/10.1117/12.530081 PSISDG 0277-786X Google Scholar
J. Hirshburget al.,
“Collagen solubility correlates with skin optical clearing,”
J. Biomed. Opt., 11
(4), 040501
–040503
(2006). http://dx.doi.org/10.1117/1.2220527 JBOPFO 1083-3668 Google Scholar
A. M. Sergeevet al.,
“In vivo endoscopic OCT imaging of precancer and cancer states of human mucosa,”
Opt. Express, 1
(13), 432
–440
(1997). http://dx.doi.org/10.1364/OE.1.000432 OPEXFF 1094-4087 Google Scholar
N. V. Iftimiaet al.,
“Spectral-domain low coherence interferometry/optical coherence tomography system for fine needle breast biopsy guidance,”
Rev. Sci. Instrum., 80
(2), 024302
(2009). http://dx.doi.org/10.1063/1.3076409 RSINAK 0034-6748 Google Scholar
P. H. TomlinsR. K. Wang,
“Theory, developments and applications of optical coherence tomography,”
J. Phys. D Appl. Phys., 38
(15), 2519
(2005). http://dx.doi.org/10.1088/0022-3727/38/15/002 0022-3727 Google Scholar
A. Jemalet al.,
“Global cancer statistics,”
CA Cancer J. Clin., 61
(2), 69
–90
(2011). http://dx.doi.org/10.3322/caac.v61:2 CAMCAM 0007-9235 Google Scholar
J. Ferlayet al.,
“Estimates of worldwide burden of cancer in 2008: GLOBOCAN 2008,”
Int. J. Cancer, 127
(12), 2893
–2917
(2010). http://dx.doi.org/10.1002/ijc.v127:12 IJCNAW 1097-0215 Google Scholar
M. G. Ghosnet al.,
“Permeability of hyperosmotic agent in normal and atherosclerotic vascular tissues,”
J. Biomed. Opt., 13
(1), 010505
(2008). http://dx.doi.org/10.1117/1.2870153 JBOPFO 1083-3668 Google Scholar
Q. L. Zhaoet al.,
“Quantifying glucose permeability and enhanced light penetration in ex vivo human normal and cancerous esophagus tissues with optical coherence tomography,”
Laser Phys. Lett., 8
(1), 71
–77
(2011). http://dx.doi.org/10.1002/lapl.v8.1 1612-2011 Google Scholar
X. Guoet al.,
“Quantification of glucose diffusion in human lung tissues by using Fourier domain optical coherence tomography,”
Photochem. Photobiol., 88
(2), 311
–316
(2012). http://dx.doi.org/10.1111/php.2012.88.issue-2 PHCBAP 0031-8655 Google Scholar
H. Q. Zhonget al.,
“Quantification of glycerol diffusion in human normal and cancer breast tissues in vitro with optical coherence tomography,”
Laser Phys. Lett., 7
(4), 315
–320
(2010). http://dx.doi.org/10.1002/lapl.v7:4 1612-2011 Google Scholar
Z. G. Zhuet al.,
“Investigation of the permeability and optical clearing ability of different analytes in human normal and cancerous breast tissues by spectral domain OCT,”
J. Biophoton., 5
(7), 536
–543
(2012). 69JVNM 1864-063X Google Scholar
A. C. WilliamsB. W. Barry,
“Penetration enhancers,”
Adv Drug Delivery Rev., 56
(5), 603
–618
(2004). Google Scholar
M. R. Prausnitzet al.,
“Electroporation of mammalian skin: A mechanism to enhance transdermal drug delivery,”
Proc. Natl Acad. Sci. U.S.A., 90
(22), 10504
–10508
(1993). http://dx.doi.org/10.1073/pnas.90.22.10504 0370-0046 Google Scholar
E. H. Choiet al.,
“The pretreatment effect of chemical skin penetration enhancers in transdermal drug delivery using iontophoresis,”
Skin Pharmacol. Appl. Skin Physiol., 12
(6), 326
–335
(1999). http://dx.doi.org/10.1159/000029894 SPAPFF 1422-2868 Google Scholar
S. Henryet al.,
“Microfabricated microneedles: a novel approach to transdermal drug delivery,”
J. Pharm. Sci., 87
(8), 922
–925
(1998). http://dx.doi.org/10.1002/(ISSN)1520-6017 JPMSAE 0022-3549 Google Scholar
S. MitragotriD. BlankschteinR. Langer,
“Ultrasound mediated transdermal protein delivery,”
Science, 269
(5225), 850
–853
(1995). http://dx.doi.org/10.1126/science.7638603 SCIEAS 0036-8075 Google Scholar
H. Q. Zhonget al.,
“Enhancement of permeability of glycerol with ultrasound in human normal and cancer breast tissues in vitro using optical coherence tomography,”
Laser Phys. Lett., 7
(5), 388
–395
(2010). http://dx.doi.org/10.1002/lapl.v7:5 1612-2011 Google Scholar
I. LavonJ. Kost,
“Ultrasound and transdermal drug delivery,”
Drug Discovery Today, 9
(15), 670
–676
(2004). http://dx.doi.org/10.1016/S1359-6446(04)03170-8 DDTOFS 1359-6446 Google Scholar
O. StumppA. J. WelchT. E. Milner,
“Feasibility of extracting tissue optical properties from amplitude OCT data during optical skin clearing,”
Proc. SPIE, 5695 83
–92
(2005). http://dx.doi.org/10.1117/12.585996 PSISDG 0277-786X Google Scholar
X. XuR. K. WangA. El Haj,
“Investigation of changes in optical attenuation of bone and neuronal cells in organ culture or three-dimensional constructs in vitro with optical coherence tomography: relevance to cytochrome oxidase monitoring,”
Eur. Biophys. J., 32
(4), 355
–362
(2003). http://dx.doi.org/10.1007/s00249-003-0285-z EBJOE8 0175-7571 Google Scholar
M. G. GhosnV. V. TuchinK. V. Larin,
“Nondestructive quantification of analyte diffusion in cornea and sclera using optical coherence tomography,”
Invest. Ophthalmol. Visual Sci., 48
(6), 2726
–2733
(2007). http://dx.doi.org/10.1167/iovs.06-1331 IOVSDA 0146-0404 Google Scholar
K. V. Larinet al.,
“Quantification of glucose diffusion in arterial tissues by using optical coherence tomography,”
Laser Phys. Lett., 4
(4), 312
–317
(2007). http://dx.doi.org/10.1002/(ISSN)1612-202X 1612-2011 Google Scholar
X. XuQ. ZhuC. Sun,
“Assessment of the effects of ultrasound-mediated alcohols on skin optical clearing,”
J. Biomed. Opt., 14
(3), 034042
(2009). http://dx.doi.org/10.1117/1.3156827 JBOPFO 1083-3668 Google Scholar
G. MerinoY. N. KaliaR. H. Guy,
“Ultrasound-enhanced transdermal transport,”
J. Pharm. Sci., 92
(6), 1125
–1137
(2003). http://dx.doi.org/10.1002/(ISSN)1520-6017 JPMSAE 0022-3549 Google Scholar
K. Tachibanaet al.,
“Induction of cell-membrane porosity by ultrasound,”
Lancet, 353
(9162), 1409
(1999). http://dx.doi.org/10.1016/S0140-6736(99)01244-1 LANCAO 0140-6736 Google Scholar
J. LiuT. N. LewisM. R. Prausnitz,
“Non-invasive assessment and control of ultrasound-mediated membrane permeabilization,”
Pharm. Res., 15
(6), 918
–924
(1998). http://dx.doi.org/10.1023/A:1011984817567 PHREEB 0724-8741 Google Scholar
|
|||||||||||||||||||||||||||||||||||||


