
|
|
1.IntroductionThe lymphatic vasculature exists in nearly all tissues of the body and plays essential roles in maintaining fluid balance through fluid and protein clearance of the interstitium, in immune cell trafficking, and in lipid transport. Lymphatic vessels achieve these desired functions through two main types of vessels; initial lymphatics and the collecting lymphatics. Initial lymphatics are blind-ended structures comprised of one endothelial cell layer with specialized junctional complexes.1–3 Initial lymphatics feed into the larger collecting lymphatics that have a smooth muscle media, allowing them to be contractile.4,5 They also contain unidirectional valves6 dividing the vessel into segments called lymphangions. The collecting vessels’ contractile ability, along with the unidirectional valves, result in a pumping mechanism that provides an active transport system to move lymph back into circulation. It has been shown that this mechanism is regulated through alterations in both intraluminal pressure7 and wall shear stress, such that increases in wall shear stress imposed through elevated flow inhibit contraction.8 Dietary lipid uptake and transport after a meal is one of the primary functions of the lymphatic system,9 yet very little is known about the mechanisms through which the lymphatics fulfill these roles. Previous studies have shown that after a meal, lipids are broken up into fatty acids and transported into intestinal enterocytes where they are esterified into triglycerides and packaged into hydrophilic lipoproteins called chylomicrons. Once formed, the chylomicrons are then taken up by the lacteals and transported through the lymphatic system to the venous circulation.9–13 A mouse model of lymphatic vasculature dysfunction, which resulted in lymphatic leakage, was reported to manifest signs of adult onset obesity,14 thus suggesting compromised lymphatic lipid transport may be a contributing factor to the onset of obesity. Until recently, the lymphatics have been treated as a passive system for the collection and transport of chylomicrons in lymph, without considering their active role in transport.15 Lymph flow rates, however, have been shown to affect chylomicron transport,16 and lymph flow rate increases after lipid absorption.17 What remains less clear is the exact relationship and molecular underpinnings that modulate lymphatic pump function in the context of the drastic changes in lipid uptake and lymph flow/formation that occur during the normal dietary functions of the intestine. This information is a vital link in understanding the significance of the lymphatic system in the context of lipid-related diseases and the implications of lymphatic pump failure on the progression and severity of these pathologies. Several models have previously been reported in the literature studying lipid uptake and transport through lymphatics. A tissue-engineered model recapitulates the absorptive properties of the intestinal lymphatic interface using both cells differentiated into enterocytes and lymphatic endothelial cells cultured on opposite sides of a porous membrane,18 but the model does not allow the study of the active role of the lymphatic pump. Various animal models have previously been used to investigate lymphatic development and function including the canine,19 sheep,20–22 rat,23–26 mouse,27,28 and zebrafish.29,30 Most commonly, rats have been used to quantify lipid absorption31 which involves the collection of systemic blood to quantify lipoprotein concentrations. Studies over the past two decades have mostly used Bollman’s technique32 for collecting lymph from the mesenteric thoracic duct. Passive collection through the duct could alter the transport time of chylomicrons since these vessels are normally working against a pressure gradient that is no longer present during this preparation. Thus, there is a need for a method for quantifying lipid concentrations that both has minimal effect on the lymphatic vessel and is able to simultaneously provide quantifiable lymphatic pump function measurements. With the advancement in imaging hardware, computational power, and image processing algorithms, it is now possible to use these tools to reliably perform in situ lymphatic pump function measurements of lymph flow rate and contraction with reliable accuracy.33–35 In addition, by combining fluorescence imaging of a fluorescent long chain fatty acid analogue,14,18,36 BODIPY FL , one can investigate direct correlations between lymphatic pump function and lipid uptake, and determine the extent to which lipoproteins modulate lymphatic function and in turn the consequences of lymphatic dysfunction on to lipid transport and homeostasis. We, thus, developed a highly sensitive dual-channel optical imaging system capable of acquiring high-speed bright-field video and fluorescence images simultaneously, along with preprocessing and quantitative processing algorithms to extract relative lipid concentrations, vessel pump function metrics, and lymph flow rates, providing the capability to quantitatively elucidate the role of lymphatics in lipid transport. 2.Materials and Methods2.1.Dual-Channel Optical Imaging SystemA custom-built optical set-up provides dual-channel imaging of both high-speed bright-field video and fluorescence images simultaneously (Fig. 1). This is achieved through optically dividing the microscope light path into two bands, one for fluorescence (495–550 nm) and the other for bright-field (). Two light sources are used to illuminate the vessel. A halogen light source built into the microscope (AxioScope, Carl Zeiss Microscopy, Thornwood, NY) offers transmission illumination and a mercury arc lamp (X-Cite, Lumen Dynamics, Ontario, Canada) provides reflective illumination. A band pass excitation filter centered at is positioned in the filter cube within the AxioScope (Zeiss). A 495 nm long pass dichroic (Zeiss), also within the cube, allows for reflected light to pass through while restricting the excitation wavelength. A dual phototube adapter (Zeiss) allows us to divide the light path between two ports by using a 560 nm long pass dichroic (T555LPXR, Chroma, Bellows Falls, VT). A emission band pass filter (HQ530/40m, Chroma, Bellows Falls, VT) is placed before the fluorescence camera (PIXIS 1024 B, Princeton Instruments, Trenton, NJ). An adjustable 60 N to C-mount adapter (Zeiss) provides us with the flexibility of aligning the camera in the plane perpendicular to the light path in addition to adjusting focus and angular rotation. A 580 nm long pass filter (HQ580lp, Chroma, Bellows Falls, VT) with an optical density (OD) of 5 intercepts the halogen light path and only allows wavelengths greater than 580 nm to pass. A 10x water immersion objective (Zeiss) with a numerical aperture (NA) of 0.3 is used to achieve the required magnification. Fig. 1A dual-channel optical system. Both a fluorescence and halogen light source are used to illuminate the vessel. A long pass filter (580 nm LP) is used to attenuate wavelengths below 580 nm. An excitation band-pass filter ( BP) is used for the fluorescence light source. A dichroic (550 nm LP) effectively splits the wavelengths into two channels; for the bright-field channel and for fluorescence. An emission band pass filter () is placed in front of the fluorescence camera. An adjustable adapter allows focusing of the two cameras independently. (a) Representative bright-field image from high-speed video of the vessel. (b) Representative fluorescence image of the same vessel. BODIPY , an orally delivered fluorescent long chain fatty acid analogue, is used as our fluorophore. 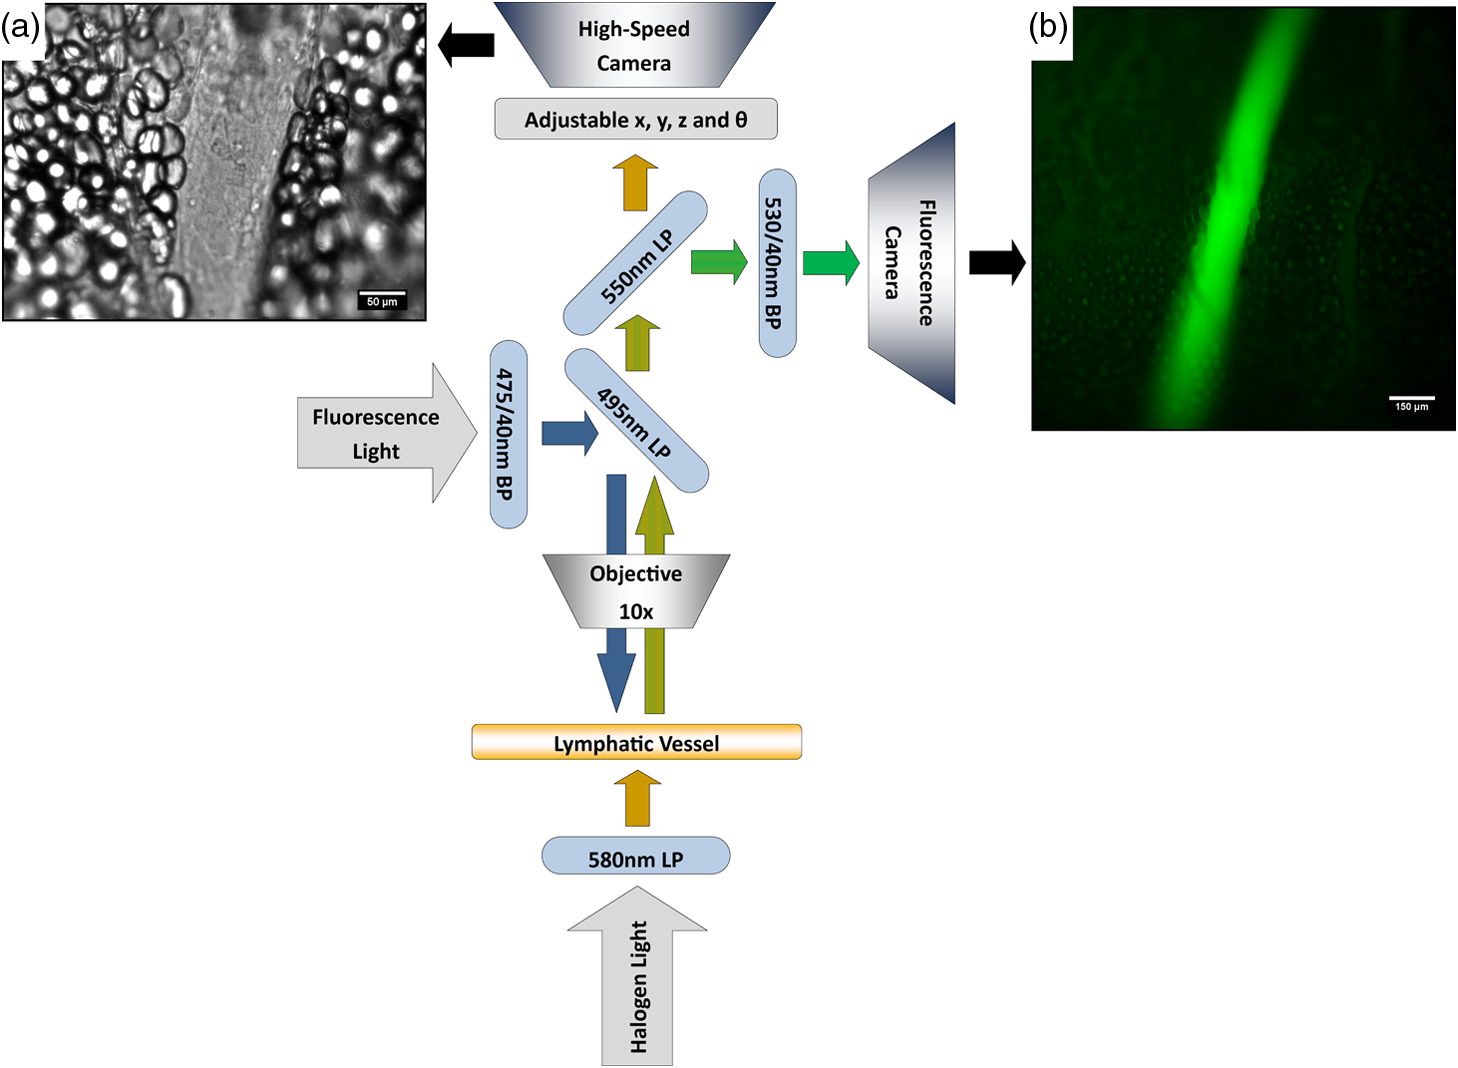 A high-speed CMOS video camera (Falcon Dalsa VGA300 HG, Teledyne Dalsa, Billerica, MA) allows a frame capturing rate of up to 300 fps with a resolution of and provides images of individual lymphocytes flowing in the lymph. The 12-bit fluorescence camera utilizes a back-illuminated CCD that is cooled to which eliminates thermal noise and provides high sensitivity, allowing the detection of small changes in fluorescence intensity. 2.2.Tissue Phantom PreparationA 147 μm diameter channel fabricated in polydimethylsiloxane (PDMS; SYLGARD 184, Dow Corning, Midland, MI) served as a mock lymphatic vessel to quantify the minimum detectable concentration of BODIPY FL (Life Technologies, Grand Island, NY) with the system and the fluorescence camera’s linearity within a given concentration range of BODIPY (Excitation: 490 nm, Emission: 520 nm) in a bovine albumin (MP Biomedicals, Auckland, New Zealand) solution. A copper wire running through two holes in a polystyrene petri-dish was used as a PDMS mold. A (elastomer to base) PDMS mixture was poured into the mold after removing air bubbles and cured overnight at 60°C. The wire was then pulled out to create a hollow cylindrical channel, thus mimicking a collecting lymphatic vessel in both dimensions and optical clarity. 2.3.Integrated Image Acquisition PlatformUsing third-party toolkits (R Cubed Software, Lawrenceville, NJ and BitFlow, Woburn, WA) for both cameras, an integrated image acquisition application was written using LabVIEW (National Instruments, Austin, TX) to streamline the acquisition process with minimal user input. The interface provides a live feed of the high speed video and fluorescence images throughout the experiment. The user can specify the duration of a high-speed video segment, the integration time of the fluorescence camera, and the interval at which to capture for both cameras. Both video sequences and fluorescence images are time-stamped for later processing. High-speed video is captured at 250 fps using a Neon-CLB PCIe frame grabber (Bitflow, Woburn, MA) and is saved as an uncompressed AVI file. The program uses four memory buffers which together with RAID 0 hard disks and an 8-core central processing unit (CPU) configuration allows direct streaming of high-speed video frames to the hard drive without the RAM limitation of the camera or the computer reported previously.35 This allows the user to capture an unlimited duration of high-speed video that is only limited by available hard disk space. Fluorescence images are captured at an interval of 5 s with an integration time of 100 ms, which provides enough sensitivity to image low levels of fluorescence while minimizing blur due to motion artifacts. Images are stored as uncompressed 16-bit TIFF files. 2.4.Animal PreparationA male Sprague-Dawley (SD) rat (Charles River, Wilmington, MA) was chosen to facilitate comparative studies of lymphatic contractility to previous studies performed on the same strain. The animal was housed in an American Association for Accreditation of Laboratory Animal Care facility. At 9 weeks of age, a rat weighing 311 g was fasted the night before the experiment for 15 h while water was available ad libitum. After fasting, a solution of 0.5 mL of olive oil (Great Value, Walmart, GA) and 100 μg of BODIPY FL reconstituted in 20 μL of Dimethyl Sulfoxide (DMSO; Fisher Scientific, Pittsburgh, PA) was delivered via gavage. After waiting 1.5 h to allow for digestion, the rat was sedated with an intramuscular (IM) injection of Diazepam (, Hospira, Lake Forest, IL) and then anesthetized through an IM injection of a cocktail containing Fentanyl (Sigma Aldrich, St. Louis, MO) and Droperidol (Sigma Aldrich, St. Louis, MO) which has been previously observed to have minimal effect on lymphatic vessel contractility. Supplemental IM booster doses at half the initial dose were administered as needed. After preparing a surgical area around the abdominal cavity, a 2 cm incision was made at the midline starting at 1 cm below the Xiphoid process. A segment of the small intestine distal to the duodenum was exteriorized and stabilized in a groove between two acrylic plates, thus exposing the mesentery over an imaging window covered with a glass slide (Fig. 2). An albumin physiological salt solution (APSS; in mM: 145.0 NaCl, 4.7 KCl, 2.0 , 1.2 , 1.2 , 5.0 glucose, 2.0 sodium pyruvate, 0.02 EDTA, 3.0 MOPS, and BSA) (all reagents from Sigma, St. Louis, MO and BSA from ICP Bio, New Zealand) with pH adjusted to at 38°C was temperature controlled at 36°C to 39°C and flowed at a rate of to bathe the mesentery. The APSS bath recapitulates the oncotic extracellular environment found around the mesentery. The temperature of the rat was maintained through circulating hot water flowing in silicone tubing underneath the animal within the custom designed imaging board while body temperature was monitored and recorded with a rectal thermometer (Kent Scientific, Torrington, Connecticut). A lymphatic vessel was then located and placed over the imaging window allowing the imaging session to begin. Imaging was performed for a total of 70 min. All animal procedures were performed in accordance with the Georgia Institute of Technology Internal Animal Care and Use Committee and complied with the National Institutes of Health Guide for the Care and Use of Laboratory Animals. At the end of the experiment, the rat was euthanized. Fig. 2The surgical set-up. (a) The small intestine is stabilized in a loop via a two-piece clamp thus exposing the mesentery. The base of the platform is a glass slide which forms the imaging window. (b) A custom designed imaging board that allows us to image the mesentery while bathing it in a circulating albumin physiological salt solution (APSS). The animal sits on a heated platform, which maintains the animal’s core body temperature. The board is screwed into the microscope stage to insure long term field-of-view stability by limiting slight board movements.  2.5.Post-Acquisition Image Processing2.5.1.Lipid intensityUtilizing the fluorescence images, we defined a region of interest (ROI) in the middle of the vessel and quantified the mean pixel intensity over time to track the relative intensity of BODIPY . The ROI spatially averages the fluorescent pixels in the plane and is typically drawn as a square to encompass a maximum area within the vessel. A cross-correlation (CC) algorithm was implemented to track the same vessel region in every frame to compensate for vessel motion artifacts. Intensity values were averaged over a 35 s period (7 frames), which allows for sufficient imaging of the physiological changes in lipid concentration that occur on a much longer timescale, allowing us to correct for focus fluctuations due to motion artifacts. 2.5.2.Motion compensationIntestinal peristalsis greatly increases after a meal,37 which when coupled with the rat’s respiration, introduces significant motion artifacts. While most researchers perform lymphatic pump function measurements on a fasted rat to minimize these effects,34 the purposes of this study required the development of a multitemporal motion compensation algorithm that can be used to preprocess the video for subsequent analysis. Area-based methods are preferably applied when the images do not have many prominent details and the distinctive information is provided by graylevels/colors rather than by local shapes and structure.38 An area-based intensity-based 2D CC image registration method was chosen over other methods as it was the least prone to changes due to loss of focus. A template window was drawn on the initial frame in the video sequence and the CC coefficient was calculated for the subsequent frames to find the best possible match above a correlation index threshold of 0.1. Such a low correlation is seen when the vessel is significantly out of the plane of focus. An image with correlation index is not processed and instead is left as is. This does not affect diameter and velocity readings as those two algorithms ignore large frame shifts due to their inherent use of small CC windows for their processing. Once the best match was located, the image was offset in the plane to overlap the original template window. The variability in adipocyte (fat cells) patterns in a given field-of-view (FOV) ensures accurate CC comparisons even when the image goes temporarily out of focus due to -plane motion. The size of the frame in both the horizontal and vertical dimensions was kept constant by compensating with a black border. The video sequence was then rotated to align the vessel horizontally in preparation for diameter and lymphocyte velocity tracking. 2.5.3.Diameter tracingsFor quantifying lymphatic pump metrics, an accurate diameter tracing algorithm was developed. In addition to the inherent low contrast, adipocytes accumulate around lymphatic vessels causing the vessel wall to become obscure and in most cases lose its sharp edge characteristics; thus, common automatic edge detection algorithms did not prove to be accurate. This led us to use a 2D CC method based on previously published techniques33 [Fig 3(a)]. The user manually selects the two vessel walls in the first image of the sequence. The algorithm then draws a window around each of the vessel walls and sets the two windows as reference templates. To track the movement of these windows, the template windows (solid green line) in a frame were correlated to search windows (dashed red line) in a subsequent frame and the maximum correlation coefficient calculated indicates the new position of the wall. The template window was centered on the current location of the vessel wall while the search window was larger and centered on the same coordinates in a subsequent frame. Typically, the template window is , while the search window is . The dimensions of these windows can be adjusted dynamically in the program in order to decrease computational time (by making the windows smaller) or to account for high contraction amplitudes in highly contractile vessels (by making the search windows larger). The diameter of the vessel was the distance separating the centers of the two windows and is tracked in every frame to give the diameter tracings over time. Fig. 3Post-acquisition image processing algorithms. (a) Diameter tracing algorithm. Green boxes (solid line) represent the template windows. Red boxes (dashed line) are the correlation search windows. The diameter d is the distance separating the centers of the two template windows as they are located across sequential frames. (b) Lymphocyte velocity tracking algorithm. The green box (solid line) is the template window which is cross-correlated with the search window, yellow box (dashed line), the red box is the new template window location. is the time separating two frames. The average velocity of lymphocytes is .  2.5.4.Lymphocyte velocity trackingWhile various demonstrated flow tracking systems are currently in use, each has its advantages and disadvantages. Laser speckle for example can measure speed but cannot differentiate the direction of flow39 which is problematic given the oscillatory flow conditions in lymphatic vessels. Scanning laser image correlation (SLIC) might provide the ability to measure individual lymphocytes and distinguish particles flowing at various velocities in the field of view. While SLIC has been demonstrated in microfluidic channels and in zebrafish, it has yet to be adapted for use in larger animal models such as rats.40 Therefore, a video based particle velocity algorithm was adapted from previous work33,41 [Fig. 3(b)] to track lymphocytes moving within the lumen of the vessel. The diameter tracings were used to set the spatial limit such that the template height was 80% of the average vessel diameter, the width was 50 pixels and centered at the midline of the vessel. This provided an adequate area to encompass several lymphocytes within the template window. In order to enhance the difference in correlation indices across the search area. Two consecutive frames were subtracted to remove static features in the vessel which resulted in an apparent frame temporal separation () of 8 ms instead of the expected 4 ms resulting from an acquisition speed of 250 fps. Lymphocyte velocity was calculated as: The algorithm was verified using 15 μm polystyrene microspheres (Polysciences, Warrington, PA) attached to a glass slide. The size of the beads is comparable to lymphocyte diameters which range from 9 to 16 μm.42 A custom .NET program was written to control a Zeiss AxioObserver Z1 motorized stage and move the slide at fixed velocities. High-speed video sequences were captured using the same imaging hardware and under the same magnification () as our in situ experiment and compared to the known velocity values. 2.5.5.Fourier analysisA fast Fourier transform (FFT) amplitude spectrum was obtained for the diameter and velocity signals. Although the sampling rate was 250 fps, the resulting diameter and velocity signals are discontinuous with an inconsistent sampling period since the algorithm does not report back a diameter value when the image is highly out of focus. In addition, if there are too few lymphocytes to make an accurate velocity reading the velocity tracking algorithm will return a blank value. Thus, before any processing was made, the signals were interpolated using linear interpolation then low pass filtered (Butterworth with cut-off of 5 Hz) to remove high frequency measurement noise. The FFT amplitude spectrum was then obtained. All Fourier analysis was carried out with Mathworks MATLAB 2012a. 2.6.Quantifying Correlation Between Triglyceride Concentration and BODIPY Fluorescence in Lymph2.6.1.AnimalsMale SD rats weighing 250–350 g (Harlan, Indianapolis, IN) were individually housed in a temperature-controlled () vivarium on a 12-h light, 12-h dark cycle. Standard chow (LM-485 Mouse/Rat Sterilizable Diet, Harlan Laboratories) and water were provided ad libitum (except, where noted). All animal procedures were performed in accordance with the University of Cincinnati Internal Animal Care and Use Committee and complied with the National Institutes of Health Guide for the Care and Use of Laboratory Animals. 2.6.2.Lymph fistula surgery and lymph collectionRats were fasted for 24 h prior to surgery, but retained free access to water. Rats were anesthetized with isoflurane, then the superior mesenteric lymphatic duct was cannulated with polyvinyl chloride tubing (0.5 mm ID, 0.8 mm OD; Tyco Electronics, Castle Hill, Australia) according to the method of Bollman et al.32 with slight modifications.43 The lymph cannula was secured with cyanoacrylate glue (Krazy Glue, Columbus, OH). Intraduodenal cannulation was performed by inserting a silicone feeding tube (1.02 mm ID, 2.16 mm OD; VWR International, West Chester, PA) approximately 2 cm beyond the pylorus into the duodenum via a fundal incision of the stomach. The tube was secured by a purse-string ligature in the stomach and sealed by a drop of cyanoacrylate glue to prevent leakage. The lymph cannula and the intraduodenal feeding tube were exteriorized through the right flank. After surgery, the animals were placed in Bollman restraint cages and allowed to recover overnight; the animals were kept in a temperature-regulated chamber at 28°C to prevent hypothermia and received a continuous intraduodenal infusion of 5% glucose-saline solution (145 mM NaCl, 4 mM KCl and 0.28 M glucose) at for 6–7 h. Rats then received continuous infusion of saline (0.15 M NaCl) at overnight prior to lipid infusion to compensate for fluid and electrolyte loss due to lymphatic drainage. After overnight recovery, fasting lymph was collected on ice for 30 min prior to the start of the intraduodenal infusion. Rats received intraduodenal infusion of 3 mL of Liposyn III 20% concentration (Hospira) with 100 μg of BODIPY (Life Technologies, Grand Island, NY) reconstituted in 20 μL of Dimethyl Sulfoxide (DMSO; Fisher Scientific, Pittsburgh, PA). Lymph was collected on ice for 30 min intervals for 4 h min post-infusion. At the end of the lymph collection period, rats were euthanized. 2.6.3.Measurement of triglyceride and BODIPY in lymphLymphatic triglyceride concentrations were determined using a commercially available kit (Randox TG, Randox Laboratories Ltd., Crumlin, Northern Ireland, UK). Lymph samples were shipped on ice overnight from Cincinnati, OH to Atlanta, GA and BODIPY fluorescence was measured using a multimode fluorescence plate reader (DTX 880, Bechman Coulter, Indianapolis IN). 2.7.Quantitative Descriptors for Lymphatic Pump FunctionFrom the diameter and velocity tracings the following metrics were calculated: 2.7.1.Constriction wall velocityThe velocity of the wall during vessel constriction for each contractile cycle averaged over the entire length of the video segment: where EDD is the end diastolic diameter, ESD is the end systolic diameter, and is the constriction time.2.7.2.Dilation wall velocityThe velocity of the wall during vessel expansion for each contractile cycle averaged over the entire length of the video segment. 2.7.3.Volume flow rateThe lymphocyte velocity () calculated using the algorithm lies between the spatially averaged velocity () and the maximum velocity () assuming Poiseuille flow in a cylindrical tube. Since particles tend to locate themselves in the center of a tube it can be assumed that is closer to . Experimentally, a reasonable approximation was found to be .33 Under these assumptions, a volumetric flow rate is obtained: where is the diameter of the vessel when the lymphocyte velocity is measured.2.7.4.Stroke volumeIs defined as the total expected volume displaced during a contraction cycle of a lymphangion assuming an average lymphangion length and proper valve closure to prevent backflow: where EDD is the end diastolic diameter, ESD is the end systolic diameter, is the typical length of a rat lymphangion and is assumed to be 1 mm.442.7.5.Ejection fractionThe fraction of end-diastolic volume ejected during a single phasic lymphatic contraction was calculated as: where EDD is the end diastolic diameter and ESD is the end systolic diameter.2.7.6.Fractional pump flowAn index of minute lymph pump flow45 calculated as: where EF is the ejection fraction and CF is the contraction frequency measured in Hz.3.Results3.1.Optical System Sensitivity to BODIPYOur characterization experiments confirm the quantum yield of BODIPY exhibits a 7-fold increase when mixed with albumin (Fig. 4). The increase in quantum yield quickly plateaus at an albumin concentration below that typically measured in lymph48 suggesting fluctuations in fluorescence due to changes in albumin concentration are minimized. This increase in quantum yield is most often caused by alteration of the fluorophore de-excitation pathway, essentially increasing the probability of a radiative event.49 Considering the limitations of this method, we calculate the minimum detectable concentration of BODIPY to be at 100 ms integration time (Fig. 5) with the primary limiting factor being light leakage from the transmission halogen light source through the 580 nm LP filter with OD of 5. A 100 ms integration time was used for all the experiments presented in this study. Fig. 4Fluorescence intensity in the presence of albumin. BODIPY fluorescence intensity increased by approximately 7 fold when bound to albumin. Once bound, fluorescence is stable with the increase in albumin concentration. Error bars represent mean standard deviation (SD). 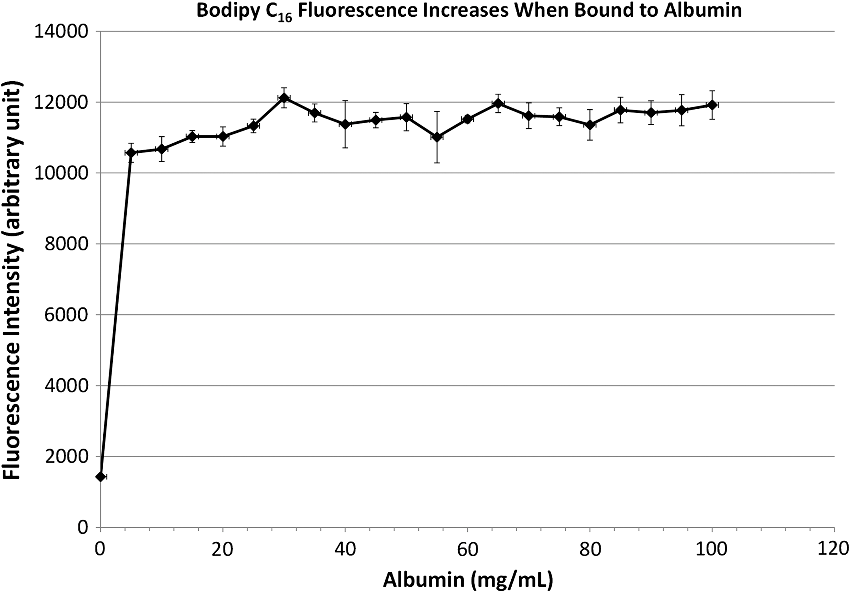 Fig. 5Performance characteristics of the fluorescence camera, the PIXIS. (a) A calibration curve shows the linearity of the PIXIS fluorescence camera and allows it to be used for quantitative fluorescence. (b) Minimum detectable BODIPY concentration at 3 dB signal-to-noise ratio (SNR) is in albumin solution.  3.2.Correlation of BODIPY Fluorescence and Triglyceride ConcentrationIn order to quantify the extent to which BODIPY might be indicative of actual in vivo Triglyceride (TG) concentration, we collected lymph from rats () over a 4-h period. Rats were infused with a lipid emulsion along with BODIPY . It was found that the fluorescence trend correlates well with actual TG concentration (Fig. 6) with a linear regression () value of approximately 0.83. Fig. 6BODIPY fluorescence correlates well with TG concentration. (a) TG concentration and BODIPY fluorescence in rat lymph. Lymph samples were collected at 30 min intervals for 4 h. TG concentration was quantified using a commercially available kit and fluorescence intensity values were obtained using a fluorescence plate reader. TG and fluorescence peak at around 2 h after the start of intraduodenal lipid infusion. (b) BODIPY fluorescence versus TG concentration with a linear regression () value of almost 0.83. . Error bars represent mean standard deviation (SD).  3.3.Image Processing Performance3.3.1.Motion compensationThe motion compensation algorithm significantly stabilized the high-speed video captured during intestinal peristalsis (Fig. 7). A randomly chosen 60-s video segment was used to obtain performance characteristics. The standard deviation for the displacement of the original unstabilized video was 9 pixels with a maximum displacement of 45 pixels while that of the stabilized video was 0.4 and 3.5 pixels respectively [Fig. 7(a)]. The normalized correlation index of a window that was fixed in the FOV was calculated for the video segment. The standard deviation for the displacement of the original unstabilized video was 0.27 with a minimum correlation index of 0 (the contents of the window completely leave the area), while that of the stabilized video was 0.05 and 0.63, respectively [Fig. 7(b)]. The motion compensation algorithm developed can be easily applied to any video sequence. Fig. 7Motion compensation algorithm performance metrics. (a) Original versus stabilized pixel displacement. The displacement of a template window was tracked as it moved in the field of view using 2D cross correlation. The standard deviation for the original unstabilized video was 9 pixels while that of the stabilized was 0.4 pixels. (b) Original versus stabilized normalized cross correlation values. The correlation index was tracked over time for a template window fixed in the field of view. The standard deviation of the normalized correlation index for the original unstabilized image was 0.28 while that of the stabilized was 0.05.  3.3.2.Diameter tracingsManual measurements were carried out every one second of video by the user drawing a line connecting the vessel walls and measuring that distance. The manual measurements were then compared to the automated tracings (Fig. 8). The average error rate between manual and algorithmic tracings was found to be around 3.3% and is likely a result of user subjectivity on the manual selection of where a vessel wall starts or ends. Diameter tracings obtained provide the basis for various parameters used to quantify lymphatic pump function (Table 1). Fig. 8Verification of diameter tracing algorithm. Two different vessels with varying morphology and sizes are displayed. Black markers indicate manual measurements where the user drew a line connecting the vessel walls and the distance was measured. Error rate between manual versus algorithmic tracings was 3.3%. 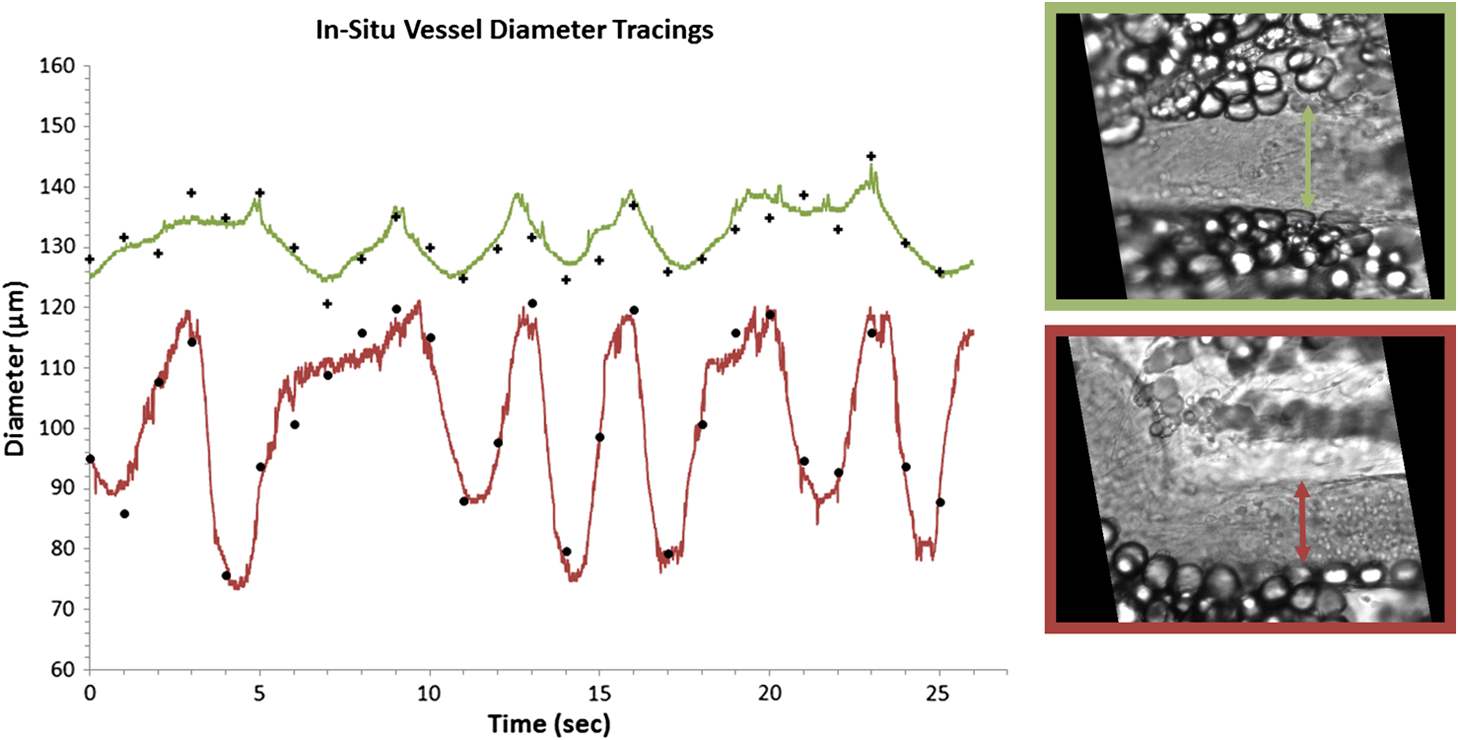 Table 1Diameter related quantifiable parameters for characterizing BODIPY uptake and lymphatic pump function.
Note: AD: average diameter, CF: contraction frequency, DC: diameter change, EDD: end-diastolic diameter, ESD: end-systolic diameter, CWV: constriction wall velocity, DWV: dilation wall velocity. 3.3.3.Velocity trackingThe algorithm has a 97% accuracy for measuring particle velocity in the range of lymphocyte velocities in the mesentery lymphatics reported in literature41 (Fig. 9). The motorized stage being used produced some inherently small jerky movements when moving at low speeds, this accounted for the somewhat jumpier than expected algorithm accuracy verification readings. Volume flow rates (VFR) and wall shear stress (WSS) can be calculated from lymphocyte velocities as described previously41 assuming Poiseuille flow in a cylindrical tube (Table 2). Fig. 9Accuracy of the lymphocyte velocity tracking algorithm. Validation measurements were carried out by placing 15 μm beads on a slide and a motorized stage was programmed to move at certain velocities. Within the velocity range previously published the algorithm has close to a 97% accuracy rate in determining the velocity.  Table 2Lymphocyte velocity related quantifiable parameters for characterizing BODIPY uptake and lymphatic pump function.
NOTE: MLV: Measured Lymphocyte Velocity, LV: Lymphocyte Velocity, VFR: Volume Flow Rate, WSS: Wall Shear Stress, FPF: Fractional Pump Flow, EF: Ejection Fraction, SV: Stroke Volume, LO: Lymphatic Output, ELO: Effective Lipid Output. All image processing algorithms and instructions for use are available upon request. 4.Discussion4.1.Alternative Imaging SystemsMiura et al. measured relative changes in lipid concentration in the mesentery lymph using gray level ratios obtained by analyzing video images and were able to correlate them to an increase in lymphatic contraction frequency.17 While some qualitative conclusions can be made, the sensitivity to changes in lipid concentration falls into a few discrete gray level values. The system is also limited by the fact that initial small changes in lipid uptake would not be detectable. However, using a back-illuminated 12-bit CCD along with BODIPY allows us to quantify changes in lipid concentrations as low as . With regard to quantifying lymphatic function, several systems are currently being used;45,50–53 however, our set-up provides us with the capability of capturing an unlimited duration of high-speed video allowing us to carry out measurements without any blind spots if the experimentalist wishes to do so. In addition, our motion compensation algorithm provides an integral tool for studies in the rat mesentery model, as unlike other systems, we do not need to fast our animal before an imaging experiment. This is also important since peristalsis is thought to provide an extrinsic mechanism for driving lymph flow,54 thus studies designed that intentionally minimize motion artifact by limiting peristalsis might actually be underestimating lymph flow rates in the mesentery. The system presented in this paper is both sensitive and able to provide us with various quantifiable data (Tables 1 and 2) that comprehensively describe lymphatic pump function and lymph flow in the context of lipid uptake and transport. 4.2.Determining Intrinsic versus Extrinsic FactorsLymph flow is a consequence of various active (intrinsic) and passive (extrinsic) forces. The phasic contraction of lymphangions accounts for the dominant intrinsic pumping mechanism. Extrinsic factors include the driving force of lymph formation, influences of cardiac and arterial pulsations, contractions of skeletal muscles in proximity to the lymphatic vessels, central venous pressure fluctuations, gastrointestinal peristalsis, and respiration.55 Because of this complexity, the velocity peaks due to the actions of passive lymph pumps often are not synchronized with intrinsic contractile activity of lymphangions [Figs. 10(a), 10(b), and 10(c)], flow profiles in lymphatic vessel are extremely variable and bidirectional.56 By tracking both flow and contraction simultaneously during the absorptive process, we can quantity the significance of both the extrinsic and intrinsic pump on lymph flow. One such indicator for describing the dominant pumping is the volume flow rate to lymphatic output ratio (VFR/LO). The VFR is the measured flow in the vessel obtained through lymphocyte tracking, while the LO is what is expected due to the intrinsic contractility of the lymphangion. In fasted rats, this average ratio was 0.71,41 while for the lipid fed rat shown here, the average ratio was 11.64, indicating a dominance of extrinsic factors. This is most likely due to lymph formation serving as a dominant extrinsic factor,17 but more studies are warranted to determine the exact mechanism. Our system does, however, have the ability to distinguish between the expected flow rate due to vessel pumping and the actual flow rate, even in the context of lipid absorption and substantial intestinal peristalsis. In addition, obtaining a frequency spectrum of the underlying velocity and contraction frequencies (Fig. 11) clearly shows that the fundamental frequencies of contraction and flow are independent, with flow having a higher fundamental frequency than contraction, further showing that extrinsic factors play a major role. Fig. 10Correlating lipid uptake with lymphatic pump function. (a, b, c) Diameter tracings superimposed on velocity profiles for three time points at minutes 12, 28 and 57. (d) Estimated BODIPY concentration plot over a 68 minute period giving us relative lipid concentrations in the lymphatic vessel. (e) Sample fluorescence image used for pixel intensity measurements. (f) A single frame from a bright-field high-speed video segment used to extracting diameter and velocity data.  Fig. 11Fourier analysis of representative diameter and velocity tracings. (a) at 12 min [Fig. 10(a)]. (b) at 28 minutes [Fig. 10(b)] at 57 min [Fig. 10(c)]. Fundamental frequencies for diameter and velocity tracings are different (see numerical labels), indicating that extrinsic factors might potentially be the dominant mechanism of transport as opposed to lymphatic contraction.  4.3.Quantifying Intestinal UptakeWe have chosen BODIPY FL (4,4-Difluoro-5,7-Dimethyl-4-Bora-3a,4a-Diaza-s-Indacene-3-Hexadecanoic acid), a fluorescently labeled 16-carbon-chain fatty acid, to quantify lipid uptake. BODIPY is an ideal choice due to having a high quantum yield and solvent photostability. The lymphatic transport characteristics of BODIPY have been previously validated using a coculture lacteal in vitro model18,57 and have also been previously reported to be taken up into lymphatics in vivo after administration via gavage.14,18 Because this fluorescent lipid analogue is a long-chain free fatty acid (LCFA), it is absorbed by the villi lining the small intestine and packaged along with the triglycerides present in the olive oil cocktail to form fluorescent chylomicrons and correlates well with actual TG concentrations in lymph (Fig. 6). BODIPY is exclusively taken up by lymphatics and is not detectable in the mesenteric blood circulation18 and is metabolized as an 18-carbon fatty acid due to the presence of two extra carbons in the fluorophore.58 Once the chylomicrons enter the mesenteric lymphatic, an increase in fluorescence intensity is observed [Fig. 10(d)]. While BODIPY was chosen for this particular application, any fluorophore in the green fluorescent protein (GFP) excitation/emission range can be used to quantify uptake by the mesentery lymphatics. There has been growing interest in targeting lymphatics with orally delivered drugs or vaccines as such a route would avoid first-pass metabolism by the liver and could also provide access to mesenteric lymph nodes.59,60 Fluorescently labeling these delivery systems would allow investigators to not only access lymphatic absorption of the drug, but would also provide insight into whether or not the delivery results in unwanted consequences on lymphatic function, thus limiting its delivery to the systemic circulation. It could also provide insight into the mechanisms behind the enhancement of lymphatic uptake seen when drugs are delivered to a subject with elevated system levels of triglyceride rich lipoproteins.61 Understanding the effects of metabolic differences between patients on oral drug absorption are essential for developing proper dosing strategies for these individuals. 4.4.Significance in Studying DiseaseMalformations of mesentery lymphatics result in various clinical pathologies.62 Protein-losing enteropathies, for example, are characterized by the progressive loss of protein from bowel due to elevated lymphatic pressure, lymphatic congestion, and nonulcerative mucosal disease as well as inflammatory and ulcerative diseases. Primary intestinal lymphangiectasia (PIL) is one important form of protein-losing enteropathy. PIL is a disorder characterized by dilated intestinal lacteals which presumably cause lymph leakage into the small bowel lumen. Comparing VFR and BODIPY fluorescence in this diseased state to a healthy state will provide quantitative data to the extent of leakage, and potentially disease severity. A low-fat diet associated with medium-chain triglyceride supplementation is the cornerstone of PIL medical management. The absence of fat in the diet prevents chyle engorgement of the intestinal lymphatic vessels thereby preventing their rupture with its ensuing lymph loss. Medium-chain triglycerides are absorbed directly into the portal venous circulation and avoid lacteal overloading.63 Using a long chain fluorescent fatty acid analogue such as BODIPY can be used to better understand how the contribution of loading the lacteals contributes to the disease by investigating the active role that the collecting lymphatic vessel plays to clear the extra load. Even before PIL symptoms develop, patients have shown delayed transport of lipid from the intestine, suggesting that lymphatic lipid transport function is compromised at an early stage of the disease.62 In addition, inflammatory bowl diseases such as Crohn’s disease (CD) present themselves with several lymphatic abnormalities.64 Lymphatic contractile activity was shown to be impaired in an isolated vessel model of gut inflammation, suggesting that lymphatic function might be compromised in inflammatory diseases such as CD.65 While alleviating the lipid burden on lymphatics is clinically beneficial in many of these intestinal disorders, the exact mechanisms of lymphatic failure and the interplay between the lipid absorption process and lymphatic function is unclear. The imaging system described here has the capability to address many of these issues in a unique fashion. The parameters obtainable in Tables 1 and 2, along with Fourier analysis and further signal processing analysis (Fig. 11) will pave the way to understanding various disease states and quantitatively elucidating how mesentery lymphatic function changes in response to disease. 5.ConclusionIn an effort to better understand the role of lymphatics in lipid related diseases, we developed a dual-channel in situ optical imaging system capable of quantifying lipid uptake and various parameters describing lymphatic pump function. We have demonstrated that the system has high sensitivity to low levels of an orally administered fluorescent fatty acid analogue and the ability to process the hundreds of thousands of images that are generated in a given experiment to quantify both flow and vessel contraction. The image processing techniques implemented allow all of this to be done even in the presence of the significant motion artifacts that occur as a consequence of intestinal peristalsis during fat absorption, providing a comprehensive tool to study lipid related diseases in the context of lymphatic transport. AcknowledgmentsThe authors are grateful for the various contributions by Dr. Laura O’Farrell and Jeffery Kornuta, as well as to our funding sources; the NIH Cellular and Tissue Engineering Training Grant (CTeng), NSF Georgia Tech Student Teacher Enhancement Program (STEP), and NIH Grant R00 HL091133. ReferencesL. V. Leak,
“The structure of lymphatic capillaries in lymph formation,”
Fed. Proc., 35
(8), 1863
–1871
(1976). Google Scholar
P. Baluket al.,
“Functionally specialized junctions between endothelial cells of lymphatic vessels,”
J. Exp. Med., 204
(10), 2349
–2362
(2007). http://dx.doi.org/10.1084/jem.20062596 JEMEAV 0022-1007 Google Scholar
J. Trzewiket al.,
“Evidence for a second valve system in lymphatics: endothelial microvalves,”
FASEB J., 15
(10), 1711
–1717
(2001). http://dx.doi.org/10.1096/fj.01-0067com FAJOEC 0892-6638 Google Scholar
D. HeldenJ. Zhao,
“Lymphatic vasomotion,”
Clin. Exp. Pharmacol. Physiol., 27
(12), 1014
–1018
(2000). http://dx.doi.org/10.1046/j.1440-1681.2000.03368.x CEXPB9 0305-1870 Google Scholar
P.-Y. von der WeidD. C. Zawieja,
“Lymphatic smooth muscle: the motor unit of lymph drainage,”
Int. J. Biochem. cell biol., 36
(7), 1147
–1153
(2004). http://dx.doi.org/10.1016/j.biocel.2003.12.008 IJBBFU 1357-2725 Google Scholar
M. C. MazzoniT. C. SkalakG. W. Schmid-Schönbein,
“Structure of lymphatic valves in the spinotrapezius muscle of the rat,”
Blood Ves., 24
(6), 304
–312
(1987). http://dx.doi.org/10.1159/000158707 BLVSAB 0303-6847 Google Scholar
A. R. HargensB. W. Zweifach,
“Contractile stimuli in collecting lymph vessels,”
Am. J. Physiol., 233
(1), H57
–H65
(1977). AJPHAP 0002-9513 Google Scholar
A. A. Gashevet al.,
“Regional variations of contractile activity in isolated rat lymphatics,”
Microcirculation, 11
(6), 477
–492
(2004). http://dx.doi.org/10.1080/10739680490476033 MCCRD8 0275-4177 Google Scholar
P. TsoJ. a Balint,
“Formation and transport of chylomicrons by enterocytes to the lymphatics,”
Am. J. Physiol., 250
(6 Pt 1), G715
–G726
(1986). AJPHAP 0002-9513 Google Scholar
T. G. Redgrave,
“Chylomicron metabolism,”
Biochem. Soc. Trans., 32
(Pt 1), 79
–82
(2004). http://dx.doi.org/10.1042/BST0320079 BCSTB5 0300-5127 Google Scholar
C. M. MansbachF. Gorelick,
“Development and physiological regulation of intestinal lipid absorption. II. Dietary lipid absorption, complex lipid synthesis, and the intracellular packaging and secretion of chylomicrons,”
Am. J. Physiol. Gastr. Liver Physiol., 293
(4), G645
–G650
(2007). http://dx.doi.org/10.1152/ajpgi.00299.2007 Google Scholar
J. B. Dixon,
“Mechanisms of chylomicron uptake into lacteals,”
Ann. NY Acad. Sci., 1207
(Suppl. 1), 52
–57
(2010). http://dx.doi.org/10.1111/nyas.2010.1207.issue-s1 ANYAA9 0077-8923 Google Scholar
M. Hussainet al.,
“A proposed model for the assembly of chylomicrons,”
Atherosclerosis, 148
(1), 1
–15
(2000). http://dx.doi.org/10.1016/S0021-9150(99)00397-4 ATHSBL 0021-9150 Google Scholar
N. L. Harveyet al.,
“Lymphatic vascular defects promoted by Prox1 haploinsufficiency cause adult-onset obesity,”
Nat. Genet., 37 1072
–1081
(2005). http://dx.doi.org/10.1038/ng1642 NGENEC 1061-4036 Google Scholar
E. M. Straarupet al.,
“Lymphatic transport in rats of interesterified oils containing conjugated linoleic acids,”
Lipids, 40
(7), 677
–684
(2005). http://dx.doi.org/10.1007/s11745-005-1430-0 LPDSAP 0024-4201 Google Scholar
P. TsoV. PittsD. N. Granger,
“Role of lymph flow in intestinal chylomicron transport,”
Am. J. Physiol., 249
(1 Pt 1), G21
–G28
(1985). Google Scholar
S. MiuraE. SekizukaH. Nagata,
“Increased lymphocyte transport by lipid absorption in rat mesenteric lymphatics,”
Am. J. Physiol., 253
(5 Pt 1), G596
–G600
(1987). AJPHAP 0002-9513 Google Scholar
J. B. DixonS. RaghunathanM. A. Swartz,
“A tissue-engineered model of the intestinal lacteal for evaluating lipid transport by lymphatics,”
Biotechnol. Bioeng., 103
(6), 1224
–1235
(2009). http://dx.doi.org/10.1002/bit.v103:6 BIBIAU 0006-3592 Google Scholar
W. Olszewskiet al.,
“Experimental lymphedema in dogs,”
J. Cardiovasc. Surg., 9
(2), 178
–183
(1968). JCVSA2 0021-9509 Google Scholar
A. Hayashiet al.,
“Increased intrinsic pumping of intestinal lymphatics following hemorrhage in anesthetized sheep,”
Circ. Res., 60 265
–272
(1987). http://dx.doi.org/10.1161/01.RES.60.2.265 CIRUAL 0009-7330 Google Scholar
N. McHaleT. Adair,
“Reflex modulation of lymphatic pumping in sheep,”
Circ. Res., 64 1165
–1171
(1989). http://dx.doi.org/10.1161/01.RES.64.6.1165 CIRUAL 0009-7330 Google Scholar
T. Naitoet al.,
“New method for evaluation of lung lymph flow rate with intact lymphatics in anaesthetized sheep,”
Acta. Physiol., 188
(2), 139
–149
(2006). http://dx.doi.org/10.1111/aps.2006.188.issue-2 APACAB 0001-6756 Google Scholar
M. Muthuchamyet al.,
“Molecular and functional analyses of the contractile apparatus in lymphatic muscle,”
FASEB J., 17
(8), 920
–922
(2003). http://dx.doi.org/10.1096/fj.02-0626fje FAJOEC 0892-6638 Google Scholar
S. D. Zawiejaet al.,
“Impairments in the intrinsic contractility of mesenteric collecting lymphatics in a rat model of metabolic syndrome,”
Am. J. Physiol. Heart Circ. Physiol., 302
(3), H643
–H653
(2012). http://dx.doi.org/10.1152/ajpheart.00606.2011 Google Scholar
H. G. Bohlenet al.,
“Phasic contractions of rat mesenteric lymphatics increase basal and phasic nitric oxide generation in vivo,”
Am. J. Physiol. Heart Circ. Physiol., 297
(4), H1319
–H1328
(2009). http://dx.doi.org/10.1152/ajpheart.00039.2009 Google Scholar
P. M. LynchF. A. DelanoG. W. Schmid-Schönbein,
“The primary valves in the initial lymphatics during inflammation,”
Lymph. Res. Biol., 5
(1), 3
–10
(2007). http://dx.doi.org/10.1089/lrb.2007.5102 LRBYAD 1539-6851 Google Scholar
T. V. Karlsenet al.,
“Transcapillary fluid balance consequences of missing initial lymphatics studied in a mouse model of primary lymphoedema,”
J. Physiol., 574
(Pt 2), 583
–596
(2006). http://dx.doi.org/10.1113/jphysiol.2006.108308 JPHYA7 0022-3751 Google Scholar
H. Y. Limet al.,
“Hypercholesterolemic mice exhibit lymphatic vessel dysfunction and degeneration,”
Am. J. Pathol., 175
(3), 1328
–1337
(2009). http://dx.doi.org/10.2353/ajpath.2009.080963 AJPAA4 0002-9440 Google Scholar
T. KarpanenS. Schulte-Merker,
“Zebrafish provides a novel method for lymphatic vascular research,”
The Zebrafish: Disease Models and Chemical Screens, 223
–238 Academic Press, Massachusetts
(2011). Google Scholar
K. Yanivet al.,
“Live imaging of lymphatic development in the zebrafish,”
Nat. Med., 12
(6), 711
–716
(2006). http://dx.doi.org/10.1038/nm1427 1078-8956 Google Scholar
G. A. Edwardset al.,
“Animal models for the study of intestinal lymphatic drug transport,”
Adv. Drug. Deliver. Rev., 50
(1–2), 45
–60
(2001). http://dx.doi.org/10.1016/S0169-409X(01)00148-X ADDREP 0169-409X Google Scholar
J. BollmanJ. CainJ. Grindlay,
“Techniques for the collection of lymph from the liver, small intestine, or thoracic duct of the rat,”
J. Lab. Clin. Med., 33 1349
–1352
(1948). JLCMAK 0022-2143 Google Scholar
J. B. Dixonet al.,
“Image correlation algorithm for measuring lymphocyte velocity and diameter changes in contracting microlymphatics,”
Ann. Biomed. Eng., 35
(3), 387
–396
(2007). http://dx.doi.org/10.1007/s10439-006-9225-2 ABMECF 0090-6964 Google Scholar
T. J. Aklet al.,
“Mesenteric lymph flow in adult and aged rats,”
Am. J. Physiol. Heart Circ. Physiol., 301
(5), H1828
–H1840
(2011). http://dx.doi.org/10.1152/ajpheart.00538.2011 Google Scholar
J. B. Dixonet al.,
“Measuring microlymphatic flow using fast video microscopy,”
J. Biomed. Opt., 10
(6), 064016
(2005). http://dx.doi.org/10.1117/1.2135791 JBOPFO 1083-3668 Google Scholar
J. P. OtisS. A. Farber,
“Imaging vertebrate digestive function and lipid metabolism in vivo,”
Drug Discov. Today Dis. Model., xxx 6
–11
(2012). http://dx.doi.org/10.1016/j.ddmod.2012.02.008 Google Scholar
A. C. GuytonJ. E. Hall, Textbook of Medical Physiology, Saunders, Philadelphia, PA
(2011). Google Scholar
B. ZitováJ. Flusser,
“Image registration methods: a survey,”
Image Vision Comput., 21
(11), 977
–1000
(2003). http://dx.doi.org/10.1016/S0262-8856(03)00137-9 IVCODK 0262-8856 Google Scholar
J. D. Briers,
“Laser Doppler, speckle and related techniques for blood perfusion mapping and imaging,”
Physiol. Meas., 22
(4), 35
–66
(2001). http://dx.doi.org/10.1088/0967-3334/22/4/201 PMEAE3 0967-3334 Google Scholar
M. J. RossowW. W. MantulinE. Gratton,
“Scanning laser image correlation for measurement of flow,”
J. Biomed. Opt., 15
(2), 026003
(2010). http://dx.doi.org/10.1117/1.3365946 JBOPFO 1083-3668 Google Scholar
J. B. Dixonet al.,
“Lymph flow, shear stress, and lymphocyte velocity in rat mesenteric prenodal lymphatics,”
Microcirculation, 13
(7), 597
–610
(2006). http://dx.doi.org/10.1080/10739680600893909 MCCRD8 0275-4177 Google Scholar
G. Rozenberg, Microscopic Haematology: A Practical Guide for the Haematology Laboratory, 100 Informa Healthcare, London, UK
(2002). Google Scholar
L. Yanget al.,
“Effect of ezetimibe on incretin secretion in response to the intestinal absorption of a mixed meal,”
Am. J. Physiol-Gastr. Liver Physiol., 299
(5), 1003
–1011
(2010). http://dx.doi.org/10.1152/ajpgi.00294.2010 Google Scholar
D. C. Zawiejaet al.,
“Distribution, propagation, and coordination of contractile activity in lymphatics,”
Am. J. Physiol., 264
(4 Pt 2), 1283
–1291
(1993). AJPHAP 0002-9513 Google Scholar
T. NagaiE. A. BridenbaughA. A. Gashev,
“Aging-associated alterations in contractility of rat mesenteric lymphatic vessels,”
Microcirculation, 18
(6), 463
–473
(2011). http://dx.doi.org/10.1111/micc.2011.18.issue-6 MCCRD8 0275-4177 Google Scholar
E. RahbarJ. E. Moore,
“A model of a radially expanding and contracting lymphangion,”
J. Biomech., 44
(6), 1001
–1007
(2011). http://dx.doi.org/10.1016/j.jbiomech.2011.02.018 JBMCB5 0021-9290 Google Scholar
R. Burton-OpitzR. Nemser,
“The viscosity of lymph,”
Am. J. Physiol., 45
(1), 25
–29
(1917). AJPHAP 0002-9513 Google Scholar
N. E. Milleret al.,
“Secretion of adipokines by human adipose tissue in vivo: partitioning between capillary and lymphatic transport,”
Am. J. Physiol-Endoc. M., 301
(4), 659
–667
(2011). https://doi.org/10.1152/ajpendo.00058.2011 Google Scholar
J. R. LakowiczB. R. Masters, Principles of Fluorescence Spectroscopy, Springer, NY
(2008). Google Scholar
J. W. Breslinet al.,
“Vascular endothelial growth factor-C stimulates the lymphatic pump by a VEGF receptor-3-dependent mechanism,”
Am. J. Physiol-Heart Circ. Physiol., 293
(1), H709
–H718
(2007). Google Scholar
T. J. Aklet al.,
“Measuring contraction propagation and localizing pacemaker cells using high speed video microscopy,”
J. Biomed. Opt., 16
(2), 026016
(2011). http://dx.doi.org/10.1117/1.3544512 JBOPFO 1083-3668 Google Scholar
F. Zhanget al.,
“Preclinical lymphatic imaging,”
Mol. Imaging Biol., 13
(4), 599
–612
(2011). http://dx.doi.org/10.1007/s11307-010-0421-y Google Scholar
M. WeilerT. KassisJ. B. Dixon,
“Sensitivity analysis of near-infrared functional lymphatic imaging,”
J. Biomed. Opt., 17
(6), 066019
(2012). http://dx.doi.org/10.1117/1.JBO.17.6.066019 JBOPFO 1083-3668 Google Scholar
G. W. Schmid-Schonbein,
“Microlymphatics and lymph flow,”
Physiol. Rev., 70
(4), 987
–1028
(1990). PHREA7 0031-9333 Google Scholar
A. A. Gashev,
“Lymphatic vessels: pressure- and flow-dependent regulatory reactions,”
Ann. NY Acad. Sci., 1131 100
–109
(2008). http://dx.doi.org/10.1196/nyas.2008.1131.issue-1 ANYAA9 0077-8923 Google Scholar
A. A. Gashev,
“Basic mechanisms controlling lymph transport in the mesenteric lymphatic net,”
Ann. NY Acad. Sci., 1207
(Suppl), 16
–20
(2010). http://dx.doi.org/10.1111/nyas.2010.1207.issue-s1 ANYAA9 0077-8923 Google Scholar
A. E. ThumserJ. Storch,
“Characterization of a BODIPY-labeled fluorescent fatty acid analogue. Binding to fatty acid-binding proteins, intracellular localization, and metabolism,”
Mol. Cell. Biochem., 299
(1–2), 67
–73
(2007). http://dx.doi.org/10.1007/s11010-005-9041-2 MCBIB8 0300-8177 Google Scholar
J. D. CartenM. K. BradfordS. A. Farber,
“Visualizing digestive organ morphology and function using differential fatty acid metabolism in live zebrafish,”
Dev. Biol., 360
(2), 276
–285
(2011). http://dx.doi.org/10.1016/j.ydbio.2011.09.010 DEBIAO 0012-1606 Google Scholar
N. L. TrevaskisW. N. CharmanC. J. H. Porter,
“Lipid-based delivery systems and intestinal lymphatic drug transport: a mechanistic update,”
Adv. Drug Deliver. Rev., 60
(6), 702
–716
(2008). http://dx.doi.org/10.1016/j.addr.2007.09.007 ADDREP 0169-409X Google Scholar
J. A. Yáñezet al.,
“Intestinal lymphatic transport for drug delivery,”
Adv. Drug. Deliver. Rev., 63
(10–11), 923
–942
(2011). http://dx.doi.org/10.1016/j.addr.2011.05.019 ADDREP 0169-409X Google Scholar
N. L. TrevaskisW. N. CharmanC. J. H. Porter,
“Acute hypertriglyceridemia promotes intestinal lymphatic lipid and drug transport: a positive feedback mechanism in lipid and drug absorption,”
Mol. Pharm., 8
(4), 1132
–1139
(2011). http://dx.doi.org/10.1021/mp100462d MOPMA3 0026-895X Google Scholar
M. Servelle,
“Congenital malformation of the lymphatics of the small intestine,”
J. Cardiovasc. Surg., 32
(2), 159
–165
(1991). JCVSA2 0021-9509 Google Scholar
S. VignesJ. Bellanger,
“Primary intestinal lymphangiectasia (Waldmann’s disease),”
Orphanet J. Rare Dis., 3 5
(2008). http://dx.doi.org/10.1186/1750-1172-3-5 Google Scholar
J. S. Alexanderet al.,
“Emerging roles of lymphatics in inflammatory bowel disease,”
Ann. NY Acad. Sci., 1207 E75
–E85
(2010). http://dx.doi.org/10.1111/nyas.2010.1207.issue-s1 ANYAA9 0077-8923 Google Scholar
J. B. Dixon,
“Lymphatic lipid transport: sewer or subway?,”
Trends Endocrin. Met., 21
(8), 480
–487
(2010). http://dx.doi.org/10.1016/j.tem.2010.04.003 TENME4 1043-2760 Google Scholar
|


