|
|
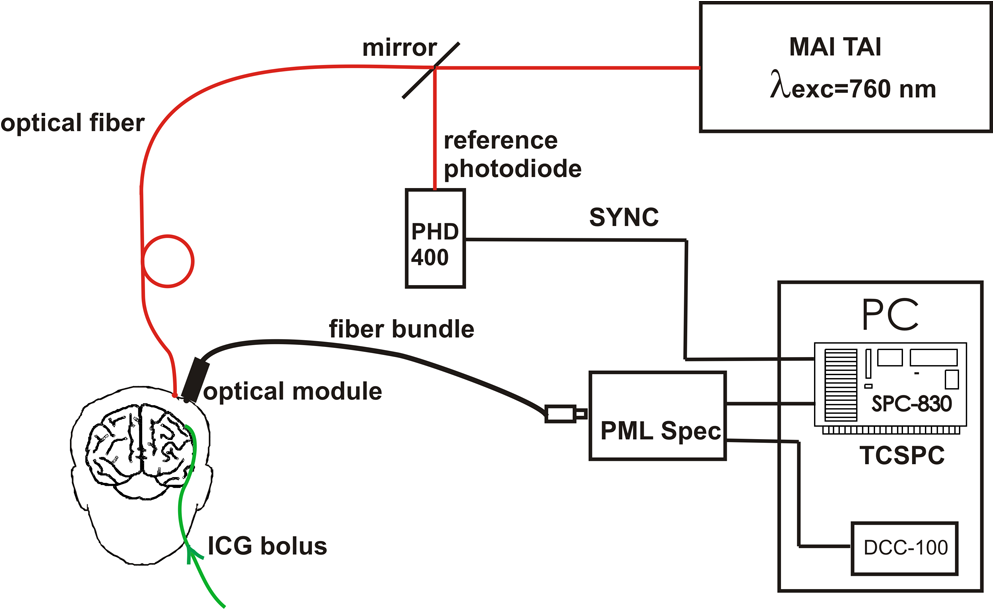
1.IntroductionSeveral methods are used in clinical practice for cerebral perfusion imaging, including magnetic resonance imaging (MRI), computed tomography (CT), single photon emission tomography (SPECT) or positron emission tomography (PET).1–4 These techniques require application of sophisticated, stationary instrumentation. An alternative method is near-infrared spectroscopy (NIRS), which was proposed and validated as a useful tool for clinical research for assessment of oxygenation changes in the tissues.5,6 In last decade, a time-resolved NIRS detection technique was successfully applied, which allows one to distinguish optical signals originating from the brain and avoid influence of changes in oxygenation of overlaying extracerebral tissues. In time-resolved NIRS, after emission of picosecond (ps) light pulses into the tissue, mean photon pathlength can be directly measured, and absolute concentrations of chromophores contained in the tissue can be estimated.7–9 Evaluation of brain perfusion is possible with utilization of NIRS-based diffuse reflectance measurement combined with analysis of inflow and washout of an optical contrast agent after intravenous (IV) administration.10–13 A commonly used optical contrast agent is indocyanine green (ICG), which is a relatively nontoxic dye.14 Monitoring of the ICG bolus by NIRS to assess cerebral blood flow (CBF) was reported in studies on piglets,12,15–17 neonates,18 and adults.11,19,20 In these studies, diffuse reflectance of continuous wave NIR light was measured, and changes in absorption occurring in extracerebral layers could not be distinguished from intracerebral absorption changes. This problem of contamination of ICG-bolus related optical signals originating from the brain by extracerebral tissues perfusion changes was addressed, and multidistance measurements,17 frequency-domain detection,21 and time-resolved approaches10,15,22 were proposed. Nevertheless, the large and variable contribution of extracerebral tissue to the signal recorded remains the most critical source of uncertainty in noninvasive, NIR reflectometry measurements in adult humans. Recently, it was reported that fluorescent NIR light can be excited in ICG circulating in the brain, and the remitted light can be detected in vivo with the time-resolved optical measurement setup. The detection of the fluorescence (background-free) signal of ICG, rather than changes in diffuse reflectance, was proposed due to ICG absorption.23 Observation of the feasibility of detection of fluorescent light originating from inclusions located deeply in optically turbid tissues may open new perspectives of molecular imaging of optical probes specifically distributed in the tissue.24 Studies carried out on physical phantoms by using time-resolved measurements of diffuse reflectance and fluorescence with broadband detection confirm that fluorescence signals are much more sensitive to the presence of fluorophore in a volume where photons penetrate than the diffuse reflectance. It was reported that in order to obtain similar signal-to-noise ratios for diffuse reflectance measurements, it is necessary to use an ICG dose which is approximately an order of magnitude higher than that required for fluorescent signal detection. This higher sensitivity, however, is connected with worse lateral resolution of fluorescence measurement in comparison to diffuse reflectance.25,26 It should be noted that measured fluorescence spectra, especially from biological samples, are very often distorted due to an inner-filter effect and reabsorption of fluorescence photons by the dye itself.27,28 The latter phenomena leads to absorption of fluorescent light originating from deeper layers of the tissue by the fluorophore present in the superficial layers. The reabsorption is often observed in fluorophores which reveal overlapping absorption and emission spectra. In molecules like ICG, this effect becomes significant because the dye has a relatively high absorbance value at fluorescence emission wavelengths. Thus, the reabsorption phenomenon may lead to misinterpretation of measured fluorescence signals. In the present paper, we extended the technique of monitoring fluorescence signals from excited ICG on the head of an adult by utilizing a time-resolved measurement in combination with a wavelength-resolved approach. This technique represents an extension of the technique for monitoring fluorescence signals on the head of an adult with broadband detection reported before. In the paper, we demonstrate construction of the device, which is based on the laboratory instrument used before for on-table experiments on solutions of ICG in a cuvette29; however, the device was optimized for measurement of a time-resolved spectrum of ICG, in vivo, in clinical conditions. This kind of experiment is much more challenging considering the much lower numbers of photons which reach the detection system, and the necessity to obey safety regulations and provide a reasonable sampling frequency for monitoring inflow and washout of the dye in the head. In first step of experiments, we investigated the dependence between ICG concentration and the measured fluorescence signal for different emission wavelengths. It would allow for determination of a range of ICG concentrations for which the relationship between ICG concentration and the number of detected fluorescence photons is linear. For this range of ICG concentrations and emission wavelengths, the effects of reabsorption of fluorescence photons by the dye itself can be neglected. Furthermore, the multiwavelength measurements were carried out on the phantom to simulate the dynamic inflow of ICG at different depths. In these experiments the dependence between depth at which the dye is located and the signals measured was evaluated for different emission wavelengths. Finally, in vivo measurements were performed on the surface of the head of two healthy volunteers. In these measurements dependence of the pattern of changes of the time-resolved optical signal during ICG injection for different emission wavelengths was studied. We will show that the reabsorption effect can significantly influence the time-resolved signals of fluorescence, especially at shorter emission wavelengths. 2.Methods2.1.InstrumentationFor measuring the distribution of times of arrival (DTA) of fluorescence photons, a time-resolved multichannel spectral system based on time-correlated single photon counting (TCSPC) electronics30 was constructed. The diagram of the system is presented in Fig. 1. Fluorescence of the ICG was excited by femtosecond (fs) pulses generated with Ti:Sa laser MaiTai (Spectra Physics, USA) operating at a wavelength of 760 nm with a repetition frequency of 80 MHz. The excitation light was delivered to the tissue with the use of an optical fiber (length 1 m, , diameter 1 mm). The power of light at the source fiber tip was about 60 mW. The optode was constructed in such a way that the power density of the light on the surface of the skin was not higher than . The remitted photons were transmitted to the detection system with the use of a fiber bundle (length 1 m, , diameter 3 mm) terminated with a circular tip on the tissue side and line-shaped () fitting on the slit of polychromator. For blocking of the excitation light, an optical module was implemented between the tissue and the tip of the detecting fiber bundle. A high-pass filter (RLP793, Thin Films Inc.) was positioned between two lenses focusing the light remitted from the tissue to the fiber bundle. The source fiber and optical detection module were positioned at source-detector separation of and fixed to the surface of the tissue (of physical phantom) with a homemade optode holder using flexible black rubber and Velcro strips. The fluorescence photons were acquired using an integrated polychromator PML Spec equipped with 16-channel photomultiplier tube detector (Becker & Hickl, Germany). This detection system allowed for simultaneous acquisition of times of arrival of fluorescence photons on 16 spectral channels. The width of spectral channel was approximately 12 nm. The spectral range of 208 nm was adjusted in such a way that the measurement covered wavelengths between 772 and 960 nm. Single photon pulses were counted using a router and a time-correlated single photon counting card SCP830 (Becker & Hickl, Germany). Power supply to the photomultiplier tubes (PMTs) was provided from a DCC-100 card (Becker & Hickl, Germany) which avoided eventual over-illumination of the detectors. Measured distributions of times of arrival of fluorescence photons contained 1024 data points with time channels width of . Synchronization of the laser pulses with the TCSPC electronics was provided with the use of a reference detecting photodiode (PHD 400). Instrumental response function (IRF) for our experimental setup was measured by positioning the source fiber in front of the detecting bundle with a piece of paper placed in front of the bundle in order to fill out its numerical aperture.31 The PMTs were illuminated with the laser light at wavelength used for ICG excitation (760 nm). The IRF was evaluated sequentially in the individual emission channels by adjustment of the grating. In such a way the IRFs of all the detecting channels for excitation wavelength was obtained (see Fig. 2 in Ref. 29). The full width half maximum (FWHM) of the IRF was in range of 130 to 150 ps for all spectral channels. Collection time for acquisition of 16 DTAs of fluorescence photons was 300 ms. Fig. 2Geometry of the liquid phantom. Boli with higher concentration of indocyanine green (ICG) were passing through the tube positioned in the fish tank at two depths in respect to the front wall of the phantom. Source fiber (red square) and optical detection module (blue circle) were fixed on the surface of Mylar film which formed the front wall of the phantom. 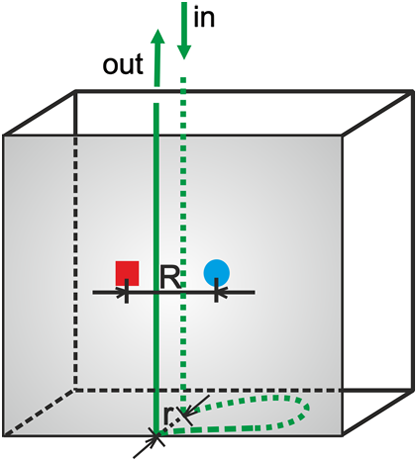 The PML-SPEC multiwavelength detection assembly is a combination of the 16 channel detector head (PML-16C-1) and a small grating polychromator. The PML-16C-1 with the multialkali cathode has a different spectral sensitivity depending on the wavelength.32 Typical spectral sensitivity of the bialkali and the multialkali photocathode is presented in the Ref. 31. However, we obtained the sensitivity curve of our PMT in NIR spectral range by measuring the number of detected counts in corresponding channels (wavelength). We set the wavelength of the laser on the corresponding detection channel and measured the IRF, keeping the fixed power and other parameters of the experiment. Then, the sensitivity coefficient was estimated for all of the measured channels, and the measured optical signals were calibrated according to these sensitivity factors. According to Ref. 33, for a multichannel PMT the constant fraction discriminator (CFD) threshold has a noticeable influence on the uniformity of the channels in terms of efficiency. Although all PMT channels use the same dynode system and the same operating voltage, the pulse amplitude distribution for the individual channels may differ noticeably. Therefore, in our measurements the CFD threshold was low enough for our detector assembly to obtain reasonable channel uniformity. We also did measurements and determined the sensitivity curve which reflects the influence of the grating on the signal measured. We scanned the grating along the fixed wavelength (760 nm) from the laser source. Thus, the number of the detection channels changed with respect to the excitation wavelength. As a result, the difference between detected counts was approximately 8% for channels 2 to 15 (the first and last detection channels were not taking into operation during all time-resolved measurements). It should be noted, that the count discrepancy for the detection channels operating with spectral range of emission properties of ICG, was 2.5%. On the basis of the above we suggest that the imperfection of our grating has little influence on the differences between the detector channels. Our results for channel uniformity is in good agreement with the manufacturer’s report.33 Dependence of the transit time on the location on the photocathode shows a systematic wobble depending on the channels. The effect is taken into account in the data analysis by determining individual IRFs for the channels. The continuous wave measurements of absorption and emission spectra of ICG were performed using a USB2000 spectrometer (Ocean Optics Inc.) with grating set with a spectral range from 367 to 1108 nm and optical resolution of 0.35 nm (FWHM). Measured spectra contained 2048 data points. The spectrometer was powered and controlled by USB cable connected with the computer. In these measurements, fluorescence of the ICG was excited by femtosecond pulses generated with a Ti:Sa laser source Mai Tai (Spectra Physics) adjusted at 760 nm wavelength. Fluorescence spectrum measurement was performed using interference filter RLP793 (Thin FilmImaging Technologies, Inc.) used to block the excitation wavelength and pass the emission light in the wavelength range from 800 to 860 nm. To obtain absorption spectrum, the supercontinuum laser light source was used (Fianium, UK) emitting radiation in the range from 650 to 850 nm. The optical fibers were fixed on the forehead of a subject with help of a flexible rubber holder with a 1-cm source-detector separation. Measurements started 1 min. before injection to store the reference spectrum, and continued for averaging of the ICG spectrum over a 5-min. period after injection of 5 mg of the dye dissolved in 3 mL of aqua pro injectione. 2.2.Phantom ExperimentsThe liquid phantom used consisted of a fish tank (dimensions: ) and a silicon, optically turbid tube (inner diameter of 3 mm, outer diameter of 3.8 mm). The tube was positioned inside the phantom in such a way that two of its segments were located at different depths in the liquid as shown in Fig. 2. The front wall of the phantom was made of a thin (50 μm) optically turbid Mylar film (DuPont Teijin Films) through which the measurements were recorded. The fish tank was filled with a mixture of milk and water () with small amount of black ink-water solution (, ca. ) added to obtain optical properties of the liquid (, ) close to those observed in living tissues. Two series of experiments were performed. First, the measurement was carried out in a homogeneous medium to determine the relationship between concentration of the dye and the measured number of fluorescence photons. In this experiment, concentration of the ICG in the optically turbid mixture was changed gradually in 100 steps from 0 to . Next, time-resolved measurements of fluorescence were carried out in the phantom with dynamic inflow of ICG trough the silicon tube positioned inside the medium. The outflow part of tube was fixed next to the Mylar film, whereas the inflow part of the tube was located deeper at the distance of from the Mylar film (see Fig. 2). Locations of the segments of the tube allow simulation of the inflow of dye to superficial layers of the human head and deeper layers corresponding to the brain tissue. A small amount of ICG () was added to the milk-water-ink mixture in the fish tank which created a fluorescent background which is typically used for in vivo measurements. The same mixture was pumped through the tube at a rate of using a peristaltic pump. A bolus of 2 mL of milk-water-ink mixture with a higher concentration of ICG was rapidly () injected into the tube in such a way that the bolus appeared first in the segment of the tube located deeper and then in the superficially positioned part of the tube. The dye was injected into the tube at a distance of about 15 cm from the phantom. 2.3.In Vivo MeasurementsThe measurements were carried out on the heads of two healthy adults during intravenous injection of ICG. The volunteers were examined in supine position. A bolus of 5 mL of liquid containing 5 mg of ICG dissolved in aqua pro injectione was administered into forearm vein. The ICG injection was rapid (shorter than 1 s) and followed by a 10-mL injection of normal saline. 3.Results3.1.Absorption and Emission Spectra of ICG In VivoThe absorption and emission spectra of ICG measured in vivo with the use of a continuous wave NIR spectrometer on the surface of the human head during the injection of the dye are presented in Fig. 3. The normalized amplitude of absorption (light green line) and fluorescence light (dark green line) of ICG are shown. The measured spectra were normalized by their maximum after subtraction of the background, which allows for comparison of data obtained at different wavelengths. The dark green symbols represent data obtained from wavelength- and time-resolved measurement: only several points corresponding to selected wavelengths were obtained because of the limited spectral resolution of time-resolved device (dotted line is provided for guiding eyes only). The overlapping between the absorption and emission spectra can be seen in the range from 790 to 825 nm. It can be clearly noted that the reabsorption effect is very strong at shorter wavelengths (790 to 825 nm) and can be effectively avoided at wavelengths longer than 825 nm. Fig. 3Normalized absorption (light green line) and fluorescence (dark green line) spectra of indocyanine green (ICG) measured on the surface of the human head during injection of the dye. The measured spectra were normalized by their maximum after subtraction of the background. The dark green symbols represent data obtained from wavelength- and time-resolved measurement, dotted line was provided for guiding eyes only. 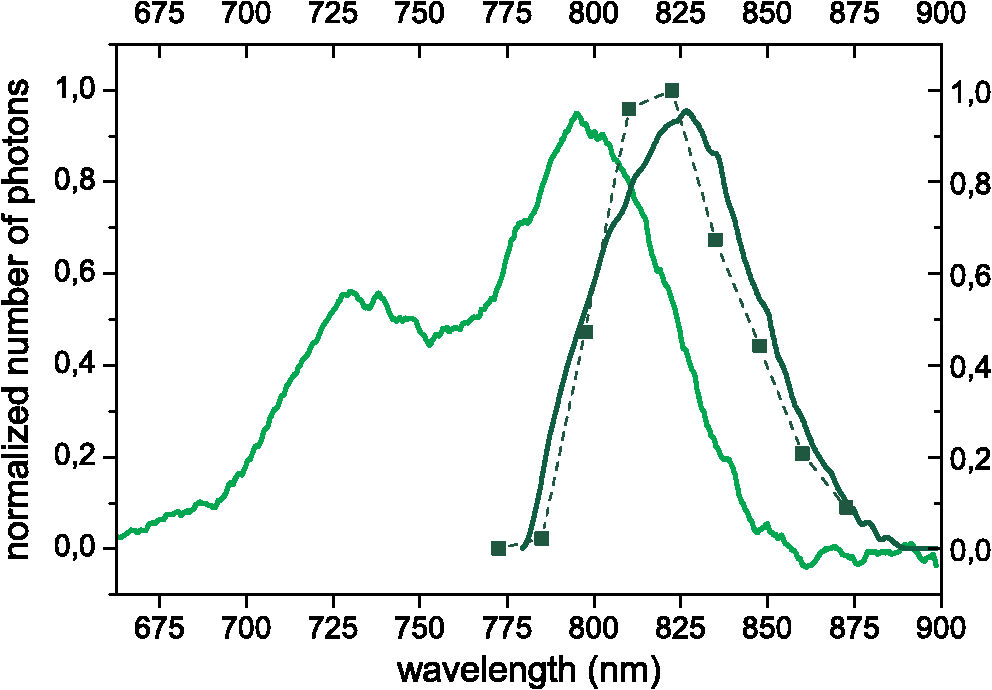 3.2.Phantom StudiesDependence of the fluorescence signal on concentration of the ICG dye was studied on the homogeneous liquid phantom for multiple fluorescence emission wavelengths. Changes in number of fluorescence photons and mean time of arrival of fluorescence photons were obtained by analysis of DTAs successfully recorded for 6 emission wavelengths in range from 798 to 861 nm. Results are presented in Fig. 4. The ICG concentration at which the total number of fluorescence photons reaches the maximum strongly depends on the emission wavelength. For shorter emission wavelengths (798–822 nm), reached the maximum value at ICG concentration of about . At these wavelengths, for higher ICG concentrations rapidly decreases and reaches about 30% of its maximal value at . For emission wavelengths of 835, 848, and 861 nm, the maximum value of was observed when was about 0.17, 0.2, and , respectively, and the decrease of after the maximum was smaller (less than 40% of the maximum). Fig. 4Normalized number of fluorescence photons and mean time of arrival of fluorescence photons as a function of indocyanine green (ICG) concentration obtained for different emission wavelengths.  In terms of mean time of arrival of fluorescence photons, , differences in the pattern of changes depend strongly on the emission wavelength. It can be noted that is longer for longer wavelengths. This effect reflects the fact that fluorescent light detected at longer wavelengths originates from the deep layer of the studied structure, and the fluorescence photons have a longer way to reach the detector. Moreover, for all spectral channels, tends to decrease with increasing ICG concentration. This effect can be explained by the fact that at a higher concentration of dye, the excitation light could not penetrate the deep layers of the phantom. However, at very low ICG concentrations (up to ), is larger at the shortest wavelengths. Time-resolved measurements of fluorescence were also carried out on a phantom with dynamic inflow of ICG in a tube located at different depths. A large amplitude of changes in the number of photons, , and mean times of arrival of fluorescence photons calculated from DTAs, which correspond to the inflow into both superficially and deeper located segments of the tube, are obtained for nonhomogeneous phantom measurements at different emission wavelengths (Fig. 5). Two peaks at and in the and are related to the inflow of ICG into the part of tube located deeper and superficially, respectively. Amplitudes of these peaks depend on the emission wavelength, which is more distinctly visible in the number of photons, . In terms of mean time of arrival of fluorescence photons , the flow of dye through the tube leads to increased amplitudes of change in this statistical moment with increased emission wavelength, both in a positive peak caused by ICG inflow into the deeper part of the tube, as well as a negative peak related to ICG inflow to the superficial tube segment. For inflow of the dye into the deeper segment, the increase in is more pronounced than the change in . Moreover, the fluorescence signal detected at longer wavelengths is a bit more sensitive to the inflow of dye into deeper compartments of the medium since the amplitude of increase in is larger for longer wavelengths (the largest amplitude of change in is observable at 836 nm—see Fig. 5, lower panel). For different emission wavelengths, the signal reaches a maxima and minima at different times (Fig. 5, middle panel). Fig. 5Changes in number of fluorescence photons and mean time of arrival of fluorescence photons for different emission wavelengths recorded after a indocyanine green (ICG) bolus injection into the tube of the phantom. 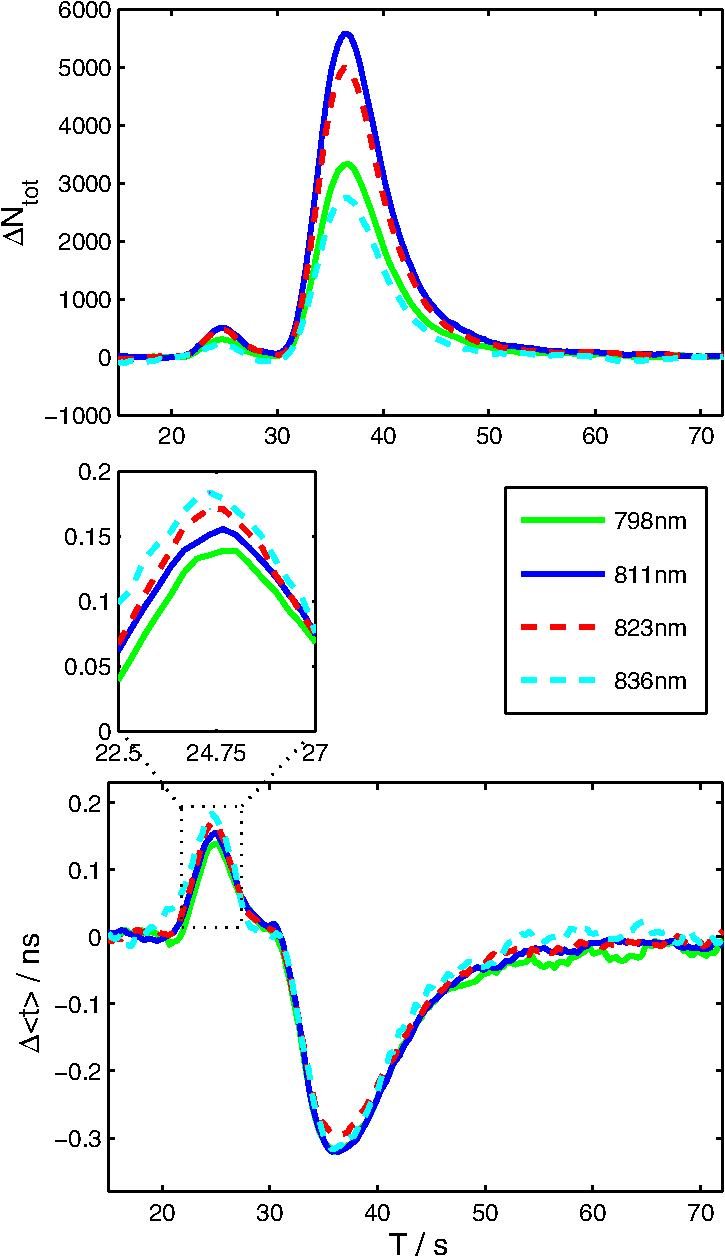 Study of the dependence of the fluorescence signal on the ICG concentration in the boli injected into the tube showed that the amplitudes of change in and depend on emission wavelengths (not published data). 3.3.In Vivo MeasurementsResults of the in vivo measurements carried out on two healthy volunteers are presented in Fig. 6. Total number of fluorescence photons, , is shown for selected emission wavelengths as a function of the time of passage of an ICG bolus () and time in respect to laser pulses (). The fluorescence signals were successfully detected in five (out of 16) spectral channels, covering about 52 nm in the range from 798 to 850 nm. Because of limited spectral resolution of the setup, the wavelength of the maximum fluorescence light intensity cannot be estimated precisely; however, it can be observed that the maximum fluorescence light intensity is between 811 and 823 nm. This result corresponds with our previous studies of ICG dissolved in solvents frequently used in multiple scattering media, in which the maximum fluorescence peak was found at .29 A highly dynamic increase in the number of fluorescence photons starts about 20 s after injection of the dye, and the maximum is reached about 35 s after injection. Fig. 6Distributions of times of arrival of fluorescence photons following injection of ICG bolus at . Panels refer to different emission wavelengths. Number of fluorescence photons are shown as a function of time of experiment and time of the photon with respect to the laser pulse.  Figure 7 illustrates changes in statistical moments of the distribution of times of arrival of fluorescence photons (, ) following the injection of the ICG bolus. The distribution of times of arrival of fluorescence photonsis connected with a rapid increase in the total number of fluorescence photons because of the increase of the concentration of the fluorophore in the volume of tissue which is penetrated by the photons. In signals of , the initial increase can be observed during the inflow of the ICG bolus followed by a pronounced decrease and a final return to the initial level. This pattern of change corresponds to the theory describing the earlier appearance of ICG in the brain, which is connected with the increase of , followed by the inflow of dye to the extracerebral layers of the head, and reflected by a decrease of .23,34 For different emission wavelengths, reaches its maximum at different times. Consequently, reaches its minimum at different times for different spectral channels. This effect may be explained by different penetration depths of photons detected at different emission wavelengths, and hence, by different contributions of intracerebral tissue in the studied volume. Differences in amplitudes of change in and have been observed for different emission wavelengths. The highest amplitudes for can be observed at wavelengths of 811–823 nm while distinctly lower amplitudes were noted at shorter and longer emission wavelengths. For both subjects studied, maxima in appear at different emission wavelengths, but a low signal-to-noise ratio does not allow for any quantitative evaluation of this effect. Fig. 7Changes in number of fluorescence photons and mean time of arrival of fluorescence photons following the injection of indocyanine green (ICG) bolus in healthy volunteers, measured for different emission wavelengths. 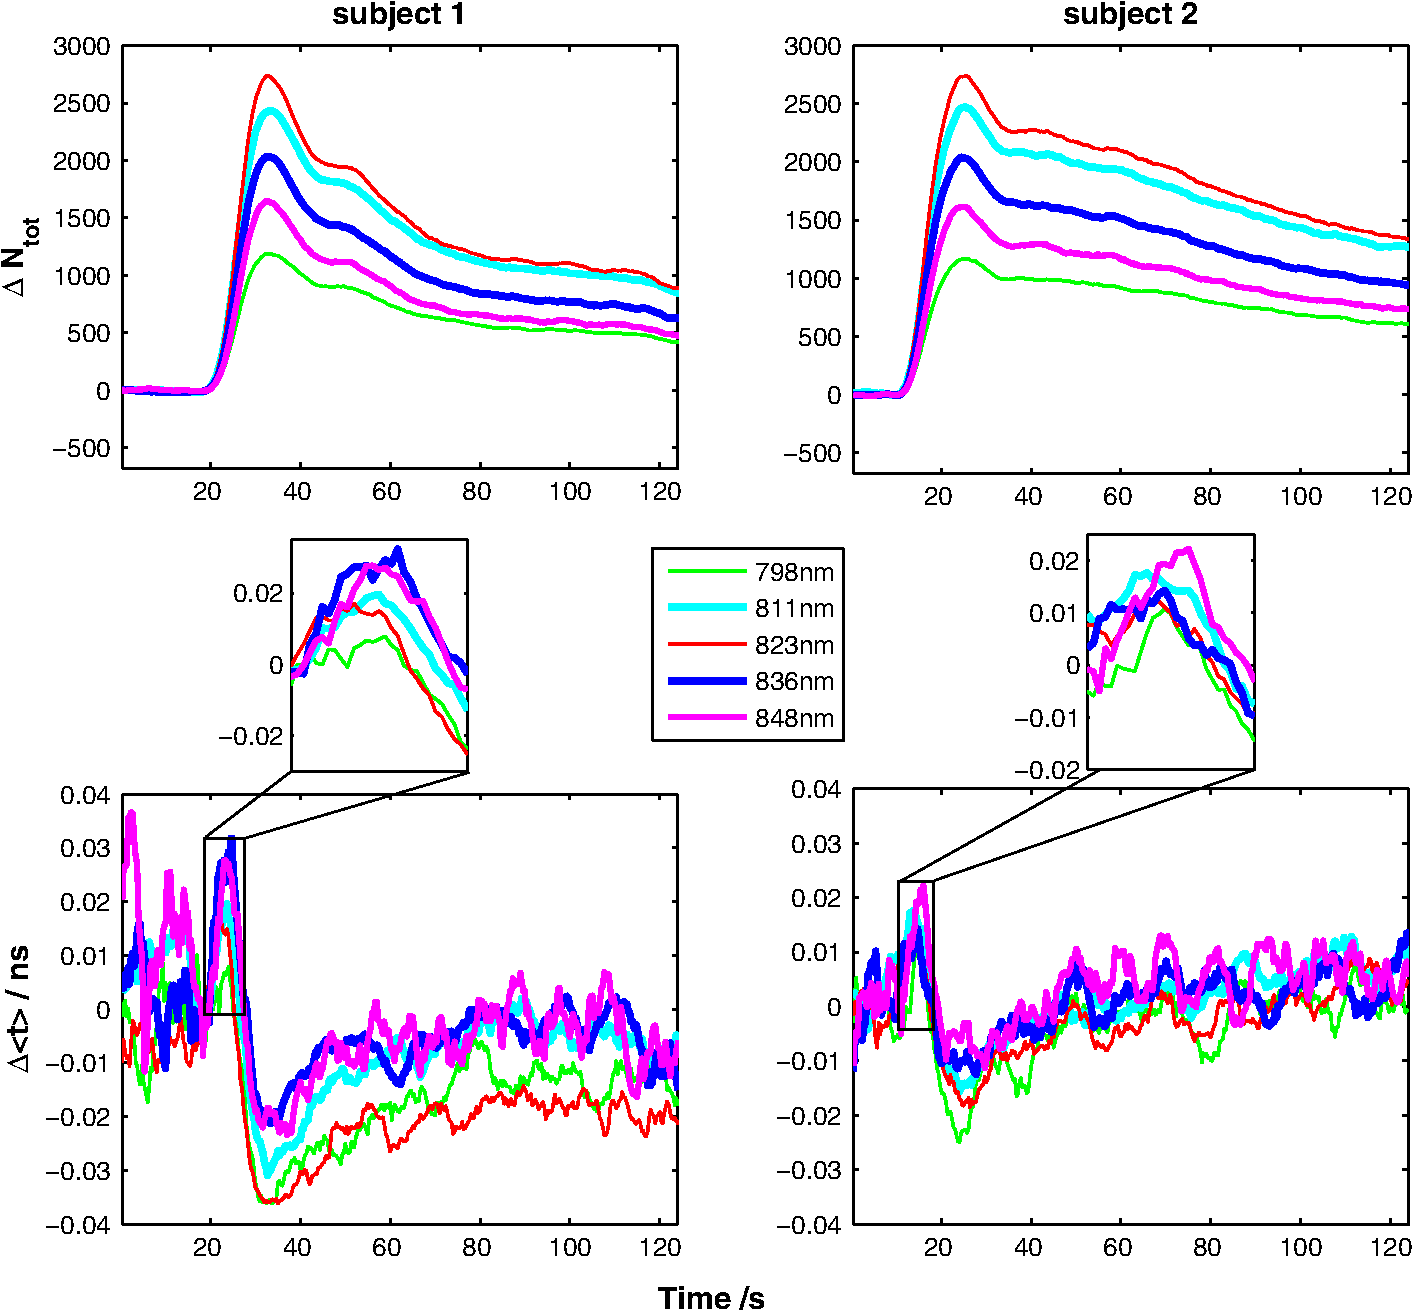 Despite high noise in signals, it can be noted from the start of the experiment, that the time at which reaches its maxima and minima (due to the inflow of ICG) is different for different emission wavelengths (Fig. 7, middle panel). A similar effect was observed for the signals detected during measurements on a phantom with dynamic inflow of ICG (Fig. 5, middle panel). This may suggest that the pattern of signals depends strongly on the spatial heterogeneity of optical properties in the medium at different wavelengths. 4.Discussion and ConclusionsThe results obtained in homogeneous physical phantom experiments show that the emission wavelength has a strong influence on the number of fluorescence photons detected and the mean time of arrival of fluorescence photons. The range in which there is a linear relationship between the changes in number of fluorescence photons and the concentration of dye depends on emission wavelength. It was shown that this linearity range is wider for longer emission wavelengths than for shorter. Moreover, the mean time of arrival of fluorescence photons is longer for long emission wavelengths, which may suggest that the fluorescence light originates from deeper structures of the medium. Theoretical and experimental studies on time-resolved fluorescence have been performed for homogenous turbid media and published by Patterson et al.35 Authors reported that an increase of source-detector separations in the measurement allows one to probe larger depths of the medium, and the fluorescence signal decreases at higher dye concentrations. The results of the measurements on homogeneous phantom demonstrate that the number of fluorescent photons decreases with increasing ICG concentration () at shorter emission wavelengths () where the absorption of dye contributes into the signal measured. The reabsorption effects of fluorescence in multiple scattering media were reported before.29,36 This reabsorption effect cannot be observed in a fluorescence signal detected at a longer wavelength (at 848 nm, the number of fluorescence photons increases even for ICG concentrations up to ). In the homogeneous phantom experiments, larger mean times of arrival of fluorescence photons were detected at longer wavelengths. This effect may support the conclusion that these fluorescence photons originate from deeper layers in the investigated medium, and they have to penetrate a longer path before they reach the detector. A similar result was obtained for the number of fluorescence photons detected from two depths corresponding to superficial and deeper layers of the studied scattering medium. The constructed phantom with dynamic inflow of ICG in the deeper and superficial parts of the tube corresponded to the inflow of dye into extra- and intracerebral tissues, respectively, and allowed us to study the influence of dye concentration in the tube as well as in the surrounding medium. The inflow into both superficial and deeper segments of the tube can be observed in numbers of fluorescence photons. The inflow of dye to the deeper part of the tube leads to increase in mean time of arrival of fluorescence photons whereas the inflow to the superficially part of the tube leads to its decrease. This effect can be explained by a previously proposed theory which showed the increase in is connected with deeper penetration of photons which undergo fluorescence conversion in deeper layers of the model.23,26 Effects similar to those observed in the phantom experiment with dynamic inflow of the fluorophore were noted during in vivo experiments. At longer emission wavelengths, the effect of increased was of the highest amplitude. It was estimated previously23 that ICG concentration in the brain after injection of an 11-mg ICG bolus is about . In our in vivo study, a bolus containing 5 mg of ICG was injected. According to the above cited methodology, it should give an ICG concentration of approximately . Thus, in the phantom measurements, the ICG concentration ranged from 0.05 to . Using this quite wide range of concentrations, we assume the ICG concentrations in the phantom experiments should cover ranges expected in in vivo experiments. However, the amplitudes of change in obtained in vivo suggest the dye concentrations in the tissue may be smaller than expected from our estimations. In this study, we report the first results of multiwavelength, time-resolved detection of fluorescence signals from ICG circulating in the human head, showing the differences in patterns of change in the statistical moments of distribution of arrival times of photons at different emission wavelengths. Thus, the measurements carried out within this study may allow for decomposition of the optical signals on the components corresponding to extra- and intracerebral compartments in the head. We suggest this decomposition is potentially possible taking into account the different path lengths of fluorescence photons detected at different wavelengths. At shorter wavelengths, the change in mean time of arrival of photons is smaller than at longer wavelengths (Figs. 5 and 7, respectively). It can be concluded that photons arriving to the detector at shorter times originate from a superficial layer of the studied medium. Thus, the photons with longer (detected at longer wavelengths) originate from a deeper layer of the medium. This effect may be associated to the reabsorption effect as well as the dependence of depth of light penetration on the tissue scattering coefficient, which typically decreases monotonously for the biological tissues in the considered wavelength region.37,38 Considering the observed differences in amplitudes of the increase caused by inflow of dye to the brain, it should be noted that these differences may have significant influence on time-resolved fluorescence signals measured with broadband detection.23 In such measurements, the number of fluorescence photons detected represents the sum of the photons at each individual wavelength of the system proposed in the present paper. In such broadband detection, the light of longer wavelengths (revealing high amplitude of increase) is mixed with shorter wavelength fluorescence photons which lead to a smaller amplitude of increase in . Moreover, results obtained suggest that the detection of the fluorescence signal at longer wavelengths of the emission spectrum of the dye may eliminate the reabsorption effect, which influences the time course of the signal. As expected, the problems caused by the reabsorption phenomenon can be reduced by measuring only that wavelength range of the emission light where the chromophore has a very low absorption coefficient. This effect can potentially be achieved easily with a high-pass filter which transmits only the longer wavelengths of the fluorescent emission.39 However, the number of fluorescence photons detected with a large source-detector separation is very low, and the application of high-pass filters additionally reduces the amount of reemitted photons detected. With the use of a sophisticated wavelength-resolved technique, the influence of reabsorption can be clearly observed and potentially taken into account during analysis of the optical signals. Recently, an approach to discriminate fluorochrome concentrations in the brain from those in the scalp was proposed by Wabnitz et.al.40 The authors retrieved the bolus shape with a depth-discrimination by empirical estimation of time-resolved, intra- and extracerebral sensitivity functions; however, this approach did not provide proper results when the reabsorption effect was significant. The effect of reabsorption is typically strong for ICG experiments because of significant overlap of the absorption and fluorescence spectra of the dye in the 800–820-nm spectral region.41–44 Thus, the spectrally-resolved measurement can discriminate fluorescence light penetration at shorter wavelengths which undergo strong reabsorption, and at longer wavelengths where the probability of reabsorption of fluorescence light is much lower. Thus, such measurement may improve the chance to use the depth discrimination methodology proposed by Wabnitz et al. In the instrument developed, efficiency of fluorescence signals detection is rather limited, thus the signal-to-noise ratio of the moments of DTAs (especially ) is low. This effect is especially critical for interpretation of in vivo data. Several factors influence efficiency of fluorescence light detection. Previous studies with broadband detection used large diameter fiber bundles of high numerical aperture (, ) for transmission of light from the tissue to the detectors. In the spectrally-resolved system presented here, a small diameter fiber bundle with low NA was used to ensure that collimated light entered the polychromator. Increasing both parameters of the detecting bundle, which are critical for photon counting efficiency, would decrease spectral resolution of the setup. Additional light losses are connected with the methodology of filtration of light remitted from the tissue. The use of an interference filter is connected with the necessity to parallelize the paths of photons remitted from the tissue. This procedure excludes many photons remitted from the tissue from further analysis. Optimization of fluorescence light detection efficiency may be also connected with the sensitivity of the selected photodetector (especially at longer wavelengths). Our study shows that the fluorescence light originating from ICG circulating in the human head can be successfully detected on the surface of the tissue with evaluation of the spectrum of fluorescence emission. Potentially, the detection of the fluorescence signal at the longer wavelengths of the emission spectrum of the dye may eliminate the reabsorption effect which influences the time course of the signal. In our measurements, the fluorescence light is passing through tissue with specific scattering and absorption properties. Thus, the fluorescence spectrum measured from a fluorophore contained in the tissue is affected by the spectral absorption and scattering properties of the tissue itself. As it has been shown earlier,45 the shape of the recorded emission spectrum changes according to the detection geometry and composition of optical properties of the medium at excitation and emission wavelengths. Furthermore, the pattern of signals recorded during ICG inflow depends strongly on several subject-related factors like spatial heterogeneity of optical properties of the medium at different wavelengths, skull and scalp thicknesses, and differences in dynamics of fluctuations of optical absorption depending on oxygenation, blood volume, etc. Potentially, detection of the time-resolved fluorescence signal at multiple emission wavelengths can be used for better discrimination of the depth at which the fluorescence inclusion is located. However, technical problems which compromise effectiveness of the fluorescence photons collection need to be solved. We conclude that detection of fluorescence signals at different emission wavelengths in combination with a time-resolved approach may allow for better interpretation of the ICG kinetics in the brain, and in turn, provide more reliable blood flow measurement in adult humans. AcknowledgmentsThe research leading to these results has received funding from the European Community’s Seventh Framework Programme (FP7/2007-2013) under Grant agreement No. 201076. ReferencesR. S. Frackowiaket al.,
“Quantitative measurement of regional cerebral blood flow and oxygen metabolism in man using 15O and positron emission tomography: theory, procedure, and normal values,”
J. Comput. Assist. Tomogr., 4
(6), 727
–736
(1980). http://dx.doi.org/10.1097/00004728-198012000-00001 JCATD5 0363-8715 Google Scholar
F. Sakaiet al.,
“Regional cerebral blood volume and hematocrit measured in normal human volunteers by single-photon emission computed tomography,”
J. Cereb. Blood Flow Metab., 5
(2), 207
–213
(1985). http://dx.doi.org/10.1038/jcbfm.1985.27 JCBMDN 0271-678X Google Scholar
F. Calamanteet al.,
“Measuring cerebral blood flow using magnetic resonance imaging techniques,”
J. Cereb. Blood Flow Metab., 19
(7), 701
–735
(1999). http://dx.doi.org/10.1097/00004647-199907000-00001 JCBMDN 0271-678X Google Scholar
E. G. Hoeffneret al.,
“Cerebral perfusion CT: technique and clinical applications,”
Radiology, 231
(3), 632
–644
(2004). http://dx.doi.org/10.1148/radiol.2313021488 RADLAX 0033-8419 Google Scholar
F. F. Jobsis,
“Noninvasive, infrared monitoring of cerebral and myocardial oxygen sufficiency and circulatory parameters,”
Science, 198
(4323), 1264
–1267
(1977). http://dx.doi.org/10.1126/science.929199 SCIEAS 0036-8075 Google Scholar
H. ObrigA. Villringer,
“Beyond the visible—imaging the human brain with light,”
J. Cereb. Blood Flow Metab., 23
(1), 1
–18
(2003). http://dx.doi.org/10.1097/00004647-200301000-00001 JCBMDN 0271-678X Google Scholar
B. Chanceet al.,
“Phase measurement of light absorption and scatter in human tissue,”
Rev. Sci. Instrum., 69
(10), 3457
–3481
(1998). http://dx.doi.org/10.1063/1.1149123 RSINAK 0034-6748 Google Scholar
B. Chanceet al.,
“Time-resolved spectroscopy of hemoglobin and myoglobin in resting and ischemic muscle,”
Anal. Biochem., 174
(2), 698
–707
(1988). http://dx.doi.org/10.1016/0003-2697(88)90076-0 ANBCA2 0003-2697 Google Scholar
J. C. HebdenR. A. KrugerK. S. Wong,
“Time resolved imaging through a highly scattering medium,”
Appl. Opt., 30
(7), 788
–794
(1991). http://dx.doi.org/10.1364/AO.30.000788 APOPAI 0003-6935 Google Scholar
A. Liebertet al.,
“Bed-side assessment of cerebral perfusion in stroke patients based on optical monitoring of a dye bolus by time-resolved diffuse reflectance,”
Neuroimage, 24
(2), 426
–435
(2005). http://dx.doi.org/10.1016/j.neuroimage.2004.08.046 NCNAEO Google Scholar
E. Kelleret al.,
“Noninvasive measurement of regional cerebral blood flow and regional cerebral blood volume by near-infrared spectroscopy and indocyanine green dye dilution,”
Neuroimag., 20
(2), 828
–839
(2003). http://dx.doi.org/10.1016/S1053-8119(03)00315-X NEIMEF 1053-8119 Google Scholar
W. M. Kuebleret al.,
“Noninvasive measurement of regional cerebral blood flow by near-infrared spectroscopy and indocyanine green,”
J. Cereb. Blood Flow Metab., 18
(4), 445
–456
(1998). http://dx.doi.org/10.1097/00004647-199804000-00013 JCBMDN 0271-678X Google Scholar
P. HoptonT. S. WalshA. Lee,
“Measurement of cerebral blood volume using near-infrared spectroscopy and indocyanine green elimination,”
J. Appl. Physiol., 87
(5), 1981
–1987
(1999). JAPYAA 0021-8987 Google Scholar
M. Hope-Rosset al.,
“Adverse reactions due to indocyanine green,”
Ophthalmology, 101
(3), 529
–533
(1994). OPANEW 0743-751X Google Scholar
M. Diopet al.,
“Comparison of time-resolved and continuous-wave near-infrared techniques for measuring cerebral blood flow in piglets,”
J. Biomed. Opt., 15
(5), 057004
(2010). http://dx.doi.org/10.1117/1.3488626 JBOPFO 1083-3668 Google Scholar
R. SpringettY. SakataD. T. Delpy,
“Precise measurement of cerebral blood flow in newborn piglets from the bolus passage of indocyanine green,”
Phys. Med. Biol., 46
(8), 2209
–2225
(2001). http://dx.doi.org/10.1088/0031-9155/46/8/312 PHMBA7 0031-9155 Google Scholar
J. T. Elliottet al.,
“Quantitative measurement of cerebral blood flow in a juvenile porcine model by depth-resolved near-infrared spectroscopy,”
J. Biomed. Opt., 15
(3), 037014
(2010). http://dx.doi.org/10.1117/1.3449579 JBOPFO 1083-3668 Google Scholar
T. Kusakaet al.,
“Estimation of regional cerebral blood flow distribution in infants by near-infrared topography using indocyanine green,”
Neuroimage, 13
(5), 944
–952
(2001). NCNAEO Google Scholar
F. Goraet al.,
“Noninvasive measurement of cerebral blood flow in adults using near-infrared spectroscopy and indocyanine green: a pilot study,”
J. Neurosurg. Anesthesiol., 14
(3), 218
–222
(2002). http://dx.doi.org/10.1097/00008506-200207000-00008 JNANEV 0898-4921 Google Scholar
C. Terborget al.,
“Bedside assessment of cerebral perfusion reductions in patients with acute ischaemic stroke by near-infrared spectroscopy and indocyanine green,”
J. Neurol. Neurosurg. Psych., 75
(1), 38
–42
(2004). JNNPAU 0022-3050 Google Scholar
M. Kohl-Bareiset al.,
“Noninvasive monitoring of cerebral blood flow by a dye bolus method: separation of brain from skin and skull signals,”
J. Biomed. Opt., 7
(3), 464
–470
(2002). http://dx.doi.org/10.1117/1.1482719 JBOPFO 1083-3668 Google Scholar
A. Liebertet al.,
“Time-resolved multidistance near-infrared spectroscopy of the adult head: intracerebral and extracerebral absorption changes from moments of distribution of times of flight of photons,”
Appl. Opt., 43
(15), 3037
–3047
(2004). http://dx.doi.org/10.1364/AO.43.003037 APOPAI 0003-6935 Google Scholar
A. Liebertet al.,
“Non-invasive detection of fluorescence from exogenous chromophores in the adult human brain,”
Neuroimage, 31
(2), 600
–608
(2006). http://dx.doi.org/10.1016/j.neuroimage.2005.12.046 NEIMEF 1053-8119 Google Scholar
J. Steinbrinket al.,
“Towards noninvasive molecular fluorescence imaging of the human brain,”
Neurodegen. Dis, 5
(5), 296
–303
(2008). http://dx.doi.org/10.1159/000135614 NEURFN Google Scholar
M. Kacprzaket al.,
“Time-resolved imaging of fluorescent inclusions in optically turbid medium—phantom study,”
Opto-Electron. Rev., 18
(1), 37
–47
(2010). http://dx.doi.org/10.2478/s11772-009-0027-6 OELREM 1230-3402 Google Scholar
D. Milejet al.,
“Advantages of fluorescence over diffuse reflectance measurements tested in phantom experiments with dynamic inflow of ICG,”
Opto-Electron. Rev., 18
(2), 208
–213
(2010). http://dx.doi.org/10.2478/s11772-010-0013-z OELREM 1230-3402 Google Scholar
J. R. Lakowicz, Probe Design and Chemical Sensing, Plenum Press, New York
(1994). Google Scholar
H. J. TankeP. van OostveldtP. van Duijn,
“A parameter for the distribution of fluorophores in cells derived from measurements of inner filter effect and reabsorption phenomenon,”
Cytometry, 2
(6), 359
–369
(1982). http://dx.doi.org/10.1002/cyto.v2:6 CYTODQ 0196-4763 Google Scholar
A. Geregaet al.,
“Wavelength-resolved measurements of fluorescence lifetime of indocyanine green,”
J. Biomed. Opt., 16
(6), 067010
(2011). http://dx.doi.org/10.1117/1.3593386 JBOPFO 1083-3668 Google Scholar
W. Becker, Advanced Time-Correlated Single Photon Counting Techniques, Springer, Berlin
(2005). Google Scholar
A. Liebertet al.,
“Fiber dispersion in time domain measurements compromising the accuracy of determination of optical properties of strongly scattering media,”
J. Biomed. Opt., 8
(3), 512
–516
(2003). http://dx.doi.org/10.1117/1.1578088 JBOPFO 1083-3668 Google Scholar
Photomultiplier Tube: Principle and Application, Hamamatsu, Japan
(1994). Google Scholar
“16 Channel Detector Head for Time-Correlated Single Photon Counting,”
(2006). www.becker-hickl.com Google Scholar
A. Liebertet al.,
“Monte Carlo algorithm for efficient simulation of time-resolved fluorescence in layered turbid media,”
Opt. Express, 16
(17), 13188
–13202
(2008). http://dx.doi.org/10.1364/OE.16.013188 OPEXFF 1094-4087 Google Scholar
M. PattersonB. Pogue,
“Mathematical model for time-resolved and frequency-domain fluorescence spectroscopy in biological tissues,”
Appl. Opt., 33 1963
–1974
(1994). http://dx.doi.org/10.1364/AO.33.001963 APOPAI 0003-6935 Google Scholar
B. YuanN. ChenQ. Zhu,
“Emission and absorption properties of indocyanine green in Intralipid solution,”
J. Biomed. Opt., 9
(3), 497
–503
(2004). http://dx.doi.org/10.1117/1.1695411 JBOPFO 1083-3668 Google Scholar
S. J. MatcherM. CopeD. T. Delpy,
“In vivo measurements of the wavelength dependence of tissue-scattering coefficients between 760 and 900 nm measured with time-resolved spectroscopy,”
Appl. Opt., 36
(1), 386
–396
(1997). http://dx.doi.org/10.1364/AO.36.000386 APOPAI 0003-6935 Google Scholar
A. N. Yaroslavskyet al.,
“Optical properties of selected native and coagulated human brain tissues in vitro in the visible and near infrared spectral range,”
Phys. Med. Biol., 47
(12), 2059
–2073
(2002). http://dx.doi.org/10.1088/0031-9155/47/12/305 PHMBA7 0031-9155 Google Scholar
Fluorescence cytophotometric determination of DNA, Wiley Interscience, New York
(1972). Google Scholar
H. Wabnitzet al.,
“Recovery of indocyanine green boli in the cortex of adult humans from time-resolved in vivo fluorescence measurements,”
in Biomedical Optics (BIOMED), Spring Optics and Photonics Congress, p. BSuC4,
(2008). Google Scholar
M. L. Landsmanet al.,
“Light-absorbing properties, stability, and spectral stabilization of indocyanine green,”
J. Appl. Physiol., 40
(4), 575
–583
(1976). JAPYAA 0021-8987 Google Scholar
R. C. BensonH. A. Kues,
“Fluorescence properties of indocyanine green as related to angiography,”
Phys. Med. Biol., 23
(1), 159
–163
(1978). http://dx.doi.org/10.1088/0031-9155/23/1/017 PHMBA7 0031-9155 Google Scholar
T. H. Kimet al.,
“Evaluation of temperature-sensitive, indocyanine green-encapsulating micelles for noninvasive near-infrared tumor imaging,”
Pharm. Res., 27
(9), 1900
–1913
(2010). http://dx.doi.org/10.1007/s11095-010-0190-y PHREEB 0724-8741 Google Scholar
J. Pauliet al.,
“Novel fluorophores as building blocks for optical probes for in vivo near infrared fluorescence (NIRF) imaging,”
J. Fluoresc., 20
(3), 681
–693
(2010). http://dx.doi.org/10.1007/s10895-010-0603-7 JOFLEN 1053-0509 Google Scholar
J. Swartlinget al.,
“Fluorescence spectra provide information on the depth of fluorescent lesions in tissue,”
Appl. Opt., 44
(10), 1934
–1941
(2005). http://dx.doi.org/10.1364/AO.44.001934 APOPAI 0003-6935 Google Scholar
|