
|
|
1.IntroductionSoft-tissue organ imaging with near infrared (NIR) light is pursued vigorously because of its application in early diagnosis of cancer based on the measured spectral variation of . This modality known as diffuse optical tomography (DOT) however produces only low resolution images limited by the diffusion propagation of photons through soft tissue with large s (reduced scattering coefficient). Ultrasound assisted optical tomography (UAOT) is developed as a possible remedy to this poor resolution, which takes advantage of tight focusing of ultrasound (US) waves in tissues and restricting imaging of optical as well as mechanical properties to the focal volume (the region of interest, ROI) using the so-called US-tagged photons. UAOT began by constructing qualitative images of in the ROI from the measured of light autocorrelation . There were several attempts to move onto quantitative and recovery1–4 which began with modeling of US-induced effects in the ROI which are oscillation of scattering centers and refraction index modulation ().5–7 Theoretical expressions are derived for in terms of the phase modulation () and its fluctuation () picked-up by light from the ROI which connected to , and also to . In spite of the above there were no attempts of quantitative recovery of these properties from . This work is intended to primarily fill this gap by quantitative recovery of , from and from . , as demonstrated here, has a non-zero mean when the US frequency () is small () and the anisotropy factor is large. The ultrasound modulation can be decreased when the optical scattering increases, thereby reducing the modulation depth of UAOT signals.3 Both and can be theoretically computed from the amplitude autocorrelation of detected photons arrived at using the expressions given in Refs. 8 and 9, also Monte Carlo simulation of detected scattered photons. As demonstrated earlier9 computed using MC simulations is shown to be non-zero for the phantom with large (here ) when and the insonified volume () does not exceed 3 to 4 times ( is the transport mean path given by ). In this work, because we use to compute and changes we would like to keep large so that with and there is a large range of variation in . For this we keep in our simulations and experiments . With reference to Fig. 1 the phase fluctuation () picked up by light in a typical scattering event owing to a displacement of the scatterer by is . Therefore decorrelation in will be dictated by (and not by ) and therefore the anisotropy factor, when considering this decorrelation, should be replaced by and used above is arrived from this new (denoted it by ) which is larger than the usual . Fig. 1A schematic diagram of scattering of light by a scattering center which undergoes vibration with an amplitude . The incident light with wave vector, is scattered with an associated wavelength along . 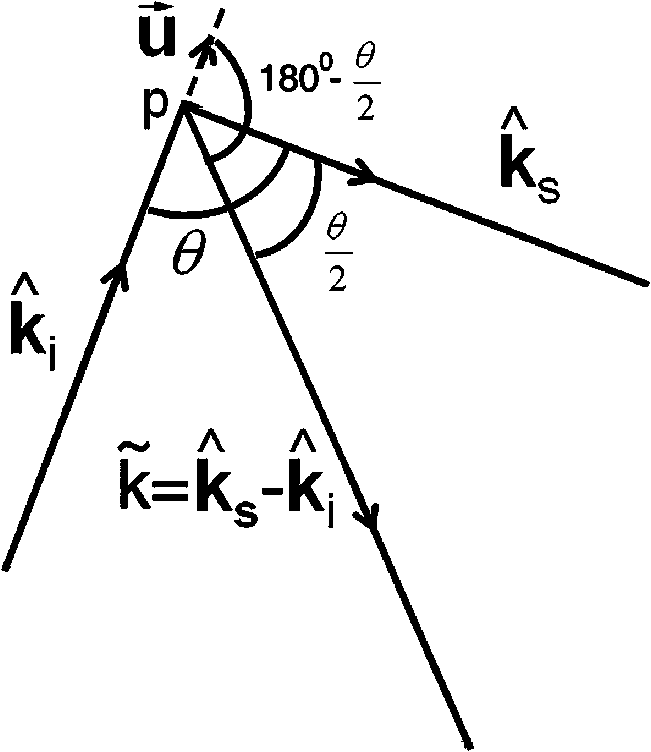 First we verify that indeed can be non-zero. Theoretically we arrive at a distribution of at an array of detector points on one face of a slab of dimension and optical properties, , , and by launching ten million photons from a point on the opposite side.9 From the random distribution of a histogram of its distribution is computed. It is seen that when the distribution is uniform with zero mean and when it has a mean of 130 deg. The figure is not included for want of space. The insonified region for the computation is taken as a cube of volume which is . The histogram arrived at from the experimentally measured is shown in Fig. 2(a) and 2(b) which also verifies almost the same non-zero obtained from computation (the experiments are described further down). Fig. 2(a) Experimental plot of histogram of at US beat frequency of 100 Hz. (b) Experimental plot of histogram of at US frequency of 1 MHz.  We use the histogram to compute . To compute , is computed from the arrived photons at a detector which is photon-path probability density weighted (only those paths which intersect ROI are considered) and its Fourier transform amplitudes at the acoustic frequency is computed. The details are in Ref. 10. The computed as well as experimentally measured and are used to recover the average , and (, and , respectively) of the insonified ROI in the object, as detailed below. We calibrate our measurements with respect to , (against ) and (against ). Theoretically, to get plots of versus one has to go through a number of steps for a given : 1. compute the US radiation force in the ROI, 2. set-up and solve the force-balance equation to find the distribution of US-induced displacement of the scatterers, and 3. transport photons using MC simulation and arrive at and . Details of the above steps are given in Ref. 10. While doing the above we can also compute the distribution of and . However, in regard to we have an easier route which employs the semi-empirical relation first proposed in Ref. 11 in the context of frequency-modulation diffuse optical tomography (DOT) connecting and , , and . It is given by Here is the geometrical distance between sensor and detector, is the wavelength of light used, and has to be interpreted as the phase associated with the intensity modulated photon flux. This has been also shown to be true in UAOT in Ref. 8 with assumption that is the phase of the mixed low frequency oscillation at the US frequency. In UAOT one computes a differential phase which is where and are the measured averages corresponding to an inhomogeneity in the ROI and reference homogeneous medium, respectively. It is easily seen that when the local changes from the background toThe corresponding when changes is Equation (1) is verified using data from MC simulation and found to be fairly close representation of the actual variation of . The results are not given for want of space. For extracting from we made use of the frequency at which a dominant natural mode of vibration of the ROI coincides with the US frequency. The resonance for a jelly like soft tissue mimicking object is at low frequencies and therefore to insonify the object at low frequencies we mix two US beams oscillating at slightly different (and adjustable) frequencies. The mixed difference frequency pressure wave drives the scattering centers in the ROI. The resonance can be observed in the versus plot as a peak, which is first obtained from computed and the experiments. At these low frequencies, as observed in Ref. 8, one of the effects of US forcing, namely is small. Therefore, in this study, we neglected . The resonance frequency () is used to compute of the ROI using the method of bisection as detailed in Ref. 10. 2.Methods and MaterialsThe experimental set-up in Fig. 3 is a parallel speckle detection system which uses a source-locked detection. The illumination is from a laser diode with wavelength at 785 nm, emitting 25% duty-cycle square waves which is synchronized to the oscillators driving the two US transducers and can be phase shifted with respect to the square-wave. The focusing US transducers operate at frequencies of 1 MHz and where can be varied from to 1 kHz and are driven by ultrastable oscillators. The object (phantom), which is either poly-vinly alcohol (PVA) or a milky liquid in a cuvette, is immersed in a water bath for acoustic impedance matching. The two US transducers are adjusted to have a bisecting focal region within the phantom. The region of intersection is the ROI which is driven by an acoustic radiation force at a frequency . To obtain and one records four sequential speckle intensities using the CCD camera focused in the exiting light, one each at phase difference between the acoustic and laser drive signals of 0, 90, 180, and 270 deg. From the four intensities and corresponding to each pixel in the CCD camera are computed.8,9 The average is computed from the histogram of and also the average of . The histograms of the experimental measured (Fig. 2) verifies the fact that is non-zero when . Fig. 3(a) The schematic diagram of the experimental setup. (b) A typical cross section of the experimental set-up in which US transducers, diode laser and CCD camera are fixed. The CCD camera is kept opposite to the laser diode to capture the transmitted light through the sample. The axis through the diode laser, and the CCD detector bisects the angle subtended by the transducer axes (i.e., 60 deg) at the insonified ROI. 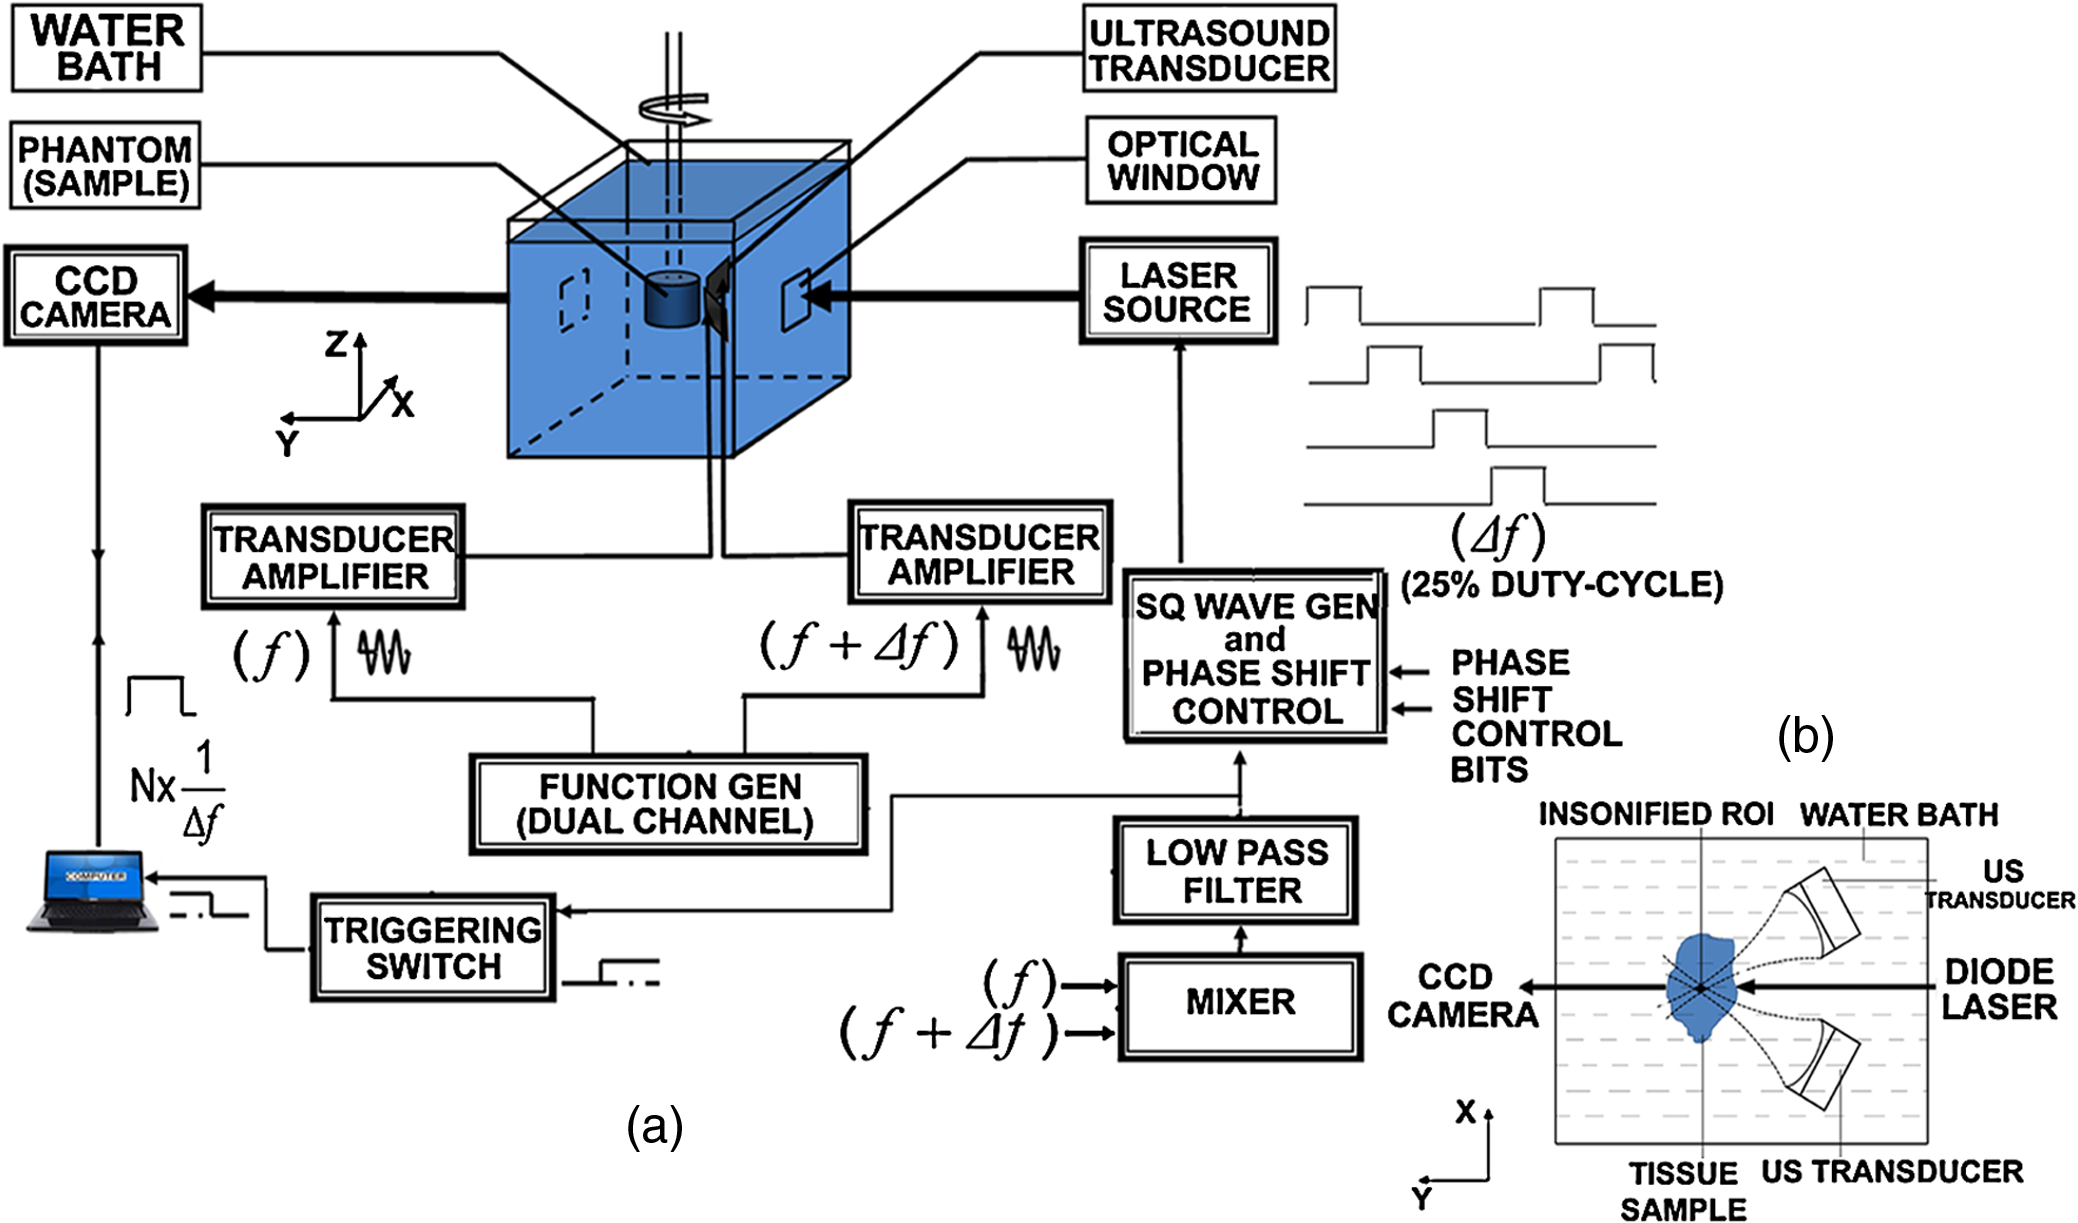 We have used two phantoms in the experiments. First is a PVA phantom whose optical and mechanical properties can be tailored to match the breast tissue and a liquid phantom. PVA slabs of dimensions are made with , tailored to be , , respectively, and to be 11.39 , 23.42, and 40.35 kPa in three different specimens. Experiments are conducted using them and versus plots obtained are shown in Fig. 4 which are compared to the eigen mode distribution (natural frequency response) of the vibrating ROI computed using ANSYS package.12 The prominent resonant mode matches well with the peak in versus curve in all the three cases considered. From these measured resonant frequencies the value of of the ROI are computed as explained in Ref. 10 which are found to be 11.42 , 23.79 , and 40.78 kPa for the three slabs. Fig. 4(a) The plot of frequency response (amplitude of vibration) of the insonified region against the ultrasound beat frequency using ANSYS package. The elasticity co-efficients used are 11.39, 23.42, and 40.35 kPa. Poisson’s ratio of 0.499 and mass density of are used in all the simulations. (b) The experimental plot of the modulation depth (M) against the ultrasound beat frequency. The experimental error is in the range 0.46% to 7.80%. PVA phantoms with two, three, and four freeze-thaw cycles which correspond to the elastic co-efficients of 11.39, 23.42, and 40.35 kPa are used.  The second is a liquid inhomogeneity obtained by mixing milk, water, and drops of India ink. By proper mixing of the above we were able to vary from 2.85 to and from to . These were independently verified using a transmitted intensity measurement as in Ref. 8. With the liquid in a cuvette we have conducted experiments to find mainly . In the first set, fixing at we varied from to and was computed in each case. With water as reference we have also found (at and at and , respectively) and then their ratio . For the and values used in the experiment we have also computed ’s using MC simulation. The results are given in Fig. 5. These more or less follow the variation predicted by Eq. (2). Therefore from the experimentally measured one can simply deduce if is known. In the second set we fix at and varied from 2.85 to . The measured and computed ’s are plotted in Fig. 5 which also verify the variation predicted by Eq. (4) leading to a simple read-out of from the measured . Fig. 5The plot of against (a) absorption coefficient and (b) scattering coefficient . In these plots ultrasound driving voltage is used as experimental parameter with and . The operating ultrasound modulation beat frequency is 750 Hz. The experimental error is 0.10% to 13.82%. Liquid phantoms are used as the tissue-samples. 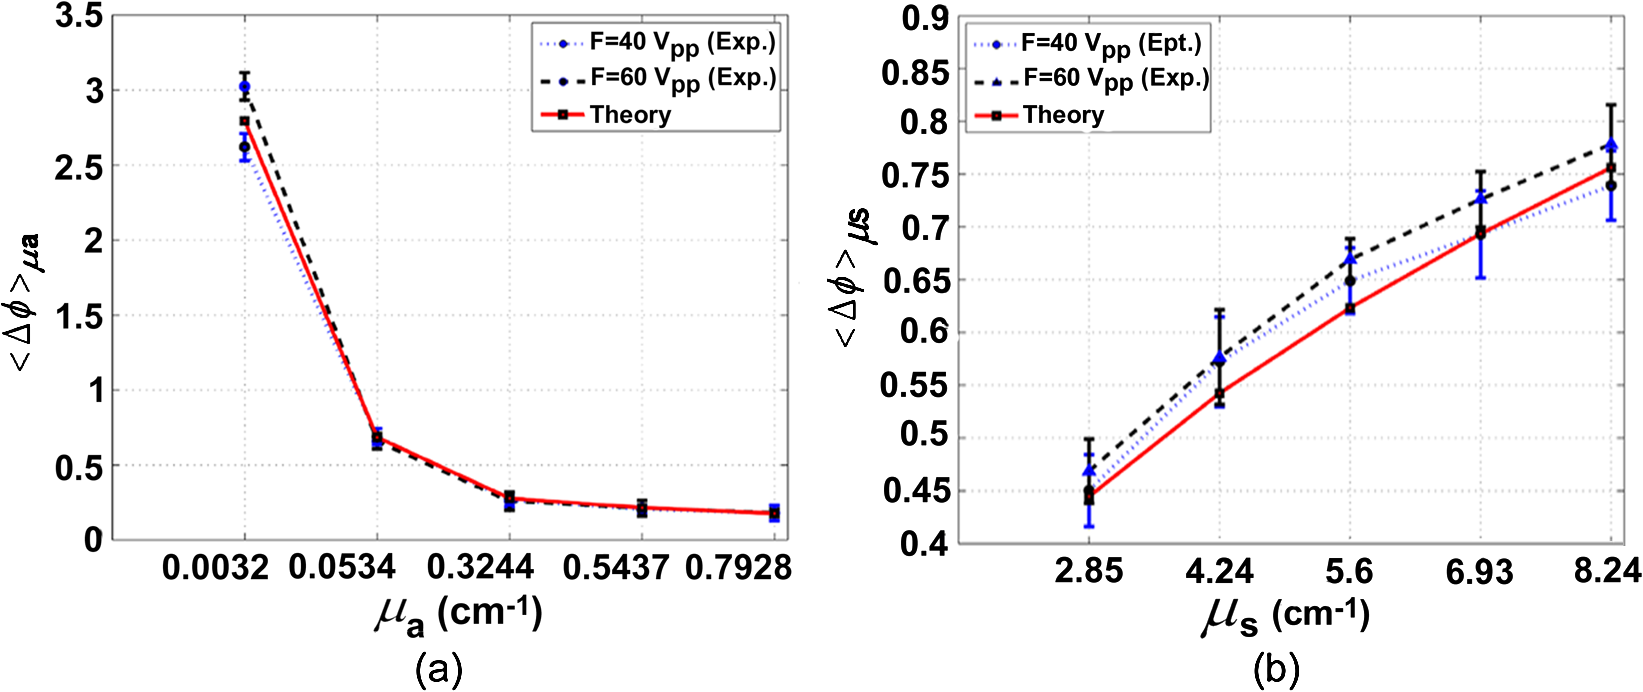 3.ConclusionIn conclusion we have demonstrated the possibility of recovering the average , , and corresponding to the insonified ROI from the UAOT measurements of and . The hitherto neglected considering it as a zero-mean random variable is shown to have a non-zero mean when there is a large scattering anisotropy and acoustic frequency is small. This means that which carries useful information can be employed for the recovery of optical properties. The other two advantages of the present study are: 1. Since we have not used a diffusion model in our inversion, the method should work well when the ROI is in a low scattering region like water-filled cyst. 2. Since we concentrate on the ROI, the reconstruction from these are not effected by bulk movement of body (like coming through respiration). ReferencesC. KimL. V. Wang,
“Multi-optical-wavelength ultrasound-modulated optical tomography,”
Opt. Lett., 32
(16), 2285
–2287
(2007). http://dx.doi.org/10.1364/OL.32.002285 OPLEDP 0146-9592 Google Scholar
Y. H. Zhanget al.,
“Photorefractive detection of tissue optical and mechanical properties by ultrasound modulated optical tomography,”
Opt. Lett., 32
(6), 656
–658
(2007). http://dx.doi.org/10.1364/OL.32.000656 OPLEDP 0146-9592 Google Scholar
S. R. Kothapalliet al.,
“Imaging optically scattering objects with ultrasound-modulated optical tomography,”
Opt. Lett., 32
(16), 2351
–2353
(2007). http://dx.doi.org/10.1364/OL.32.002351 OPLEDP 0146-9592 Google Scholar
A. Brattcheniaet al.,
“Millimeter-resolution acousto-optic quantitative imaging in a tissue model system,”
J. Biomed. Opt., 14
(3), 034031
(2009). http://dx.doi.org/10.1117/1.3153894 JBOPFO 1083-3668 Google Scholar
L. H. V. Wang,
“Mechanisms of ultrasonic modulation of multiply scattered coherent light: an analytical model,”
Phys. Rev. Lett., 87
(4), 043903
(2001). http://dx.doi.org/10.1103/PhysRevLett.87.043903 PRLTAO 0031-9007 Google Scholar
S. SakadžićL. V. Wang,
“Ultrasonic modulation of multiplyscattered coherent light: an analytical model for anisotropically scattering media,”
Phys. Rev. E, 66
(2), 026603
(2002). http://dx.doi.org/10.1103/PhysRevE.66.026603 PLEEE8 1539-3755 Google Scholar
L. H. V. Wang,
“Mechanisms of ultrasonic modulation of multiply scattered coherent light: a Monte Carlo model,”
Opt. Lett., 26
(15), 1191
–1193
(2001). http://dx.doi.org/10.1364/OL.26.001191 OPLEDP 0146-9592 Google Scholar
M. Suheshkumar Singhet al.,
“Assessment of ultrasound modulation of near infrared light on the quantification of scattering coefficient,”
Med. Phys., 37
(7), 3744
–3751
(2010). MPHYA6 0094-2405 Google Scholar
M. Suheshkumar Singhet al.,
“Ultrasound assisted optical tomography: estimation of phase shift experienced by photon on transit through US insonified region for detection of breast tumor,”
Proc. SPIE., 8320 832015
(2012). http://dx.doi.org/10.1117/12.910876 PSISDG 0277-786X Google Scholar
R. S. Chandranet al.,
“Ultrasound modulated optical tomography: Young’s modulus of insonified region from measurement of natural frequency of vibration,”
Opt. Exp., 19
(23), 22837
–22850
(2011). http://dx.doi.org/10.1364/OE.19.022837 Google Scholar
B. C. Wilsonet al.,
“Time-dependent optical spectroscopy and imaging for biomedical applications,”
Proc. IEEE, 80
(6), 918
–930
(1992). IEEPAD 0018-9219 Google Scholar
|


