
|
|
1.IntroductionPhotodynamic therapy (PDT) has emerged as an important treatment method for various diseases. Topical aminolevulinic acid (ALA)-induced protoporphyrin IX (PpIX) PDT is widely used to manage a variety of malignant and nonmalignant skin conditions. During ALA-PDT, the light-activatable photosensitizer PpIX is endogenously synthesized after the administration of the prodrug 5-aminolevulinic acid. Light exposure then produces singlet oxygen () that causes clinical outcomes. The efficiency of PDT can be determined by the availability of tissue oxygen, the penetration depth of excitation light into tissue, and the absorption of the photosensitizer. During ALA-PDT treatment, excitation light sources at different wavelengths are often used for different treatment purposes and conditions. PpIX has absorption peaks at about 405 nm in the Soret Band, and at about 505, 540, 580, and 630 nm in the Q-Band.1 A short wavelength excitation light can be used to maximize the absorption of PpIX, to limit penetration depth and to avoid exposing deeper healthy tissue. Narrow-band blue light (405 to 420 nm) was first approved by the US FDA (Food and Drug Administration) for acne vulgaris treatment, and newer generations of this blue light system have been produced.2 Red light (633 nm) with its deeper penetration depth is usually used to treat superficial basal cell carcinoma (sBCC).3 Studies have been conducted to investigate ALA-PDT efficacy at different wavelengths ranging from 405 to 420 nm (blue light) and 635 nm (red light).4 Green light was also evaluated to compare ALA-PDT efficacy. An early study found that green light (543 to 548 nm) was less painful than red light (630 nm), but equally effective, for the treatment of facial solar keratoses.1 On the other hand, another clinical ALA-PDT study found that green light () is less effective than red light () in the treatment of Bowen’s disease.5 These results are inconsistent for different diseases, which may imply that treatment wavelength is not the only cause of different therapeutic outcomes of ALA-PDT. Many of these studies were performed to evaluate the clinical response to determine the optimal wavelength for a specific type of PDT treatment. To our knowledge, no theoretical studies have been conducted using realistic clinical treatment parameters to investigate the fundamental differences in ALA-PDT of the skin at different excitation wavelengths. In a recent study, Nielsen et al.6 used a mathematical model to investigate the effects of oxygen depletion on the efficiency of ALA-PDT at different depths at different excitation wavelengths. These authors calculated the PDT efficacy as the product of the calculated relative fluence rate in skin and the measured excitation spectrum of PpIX, but did not take into account the effects of oxygen supply and consumption. An accurate simulation of the production and the distribution of singlet oxygen may be a better way to understand PDT effects. The PDT process is complicated, but insight can be provided by a dynamic model for ALA-PDT of human skin recently introduced by Liu et al.7 The temporal and spatial distributions of the essential PDT parameters including tissue oxygen, photosensitizer, and singlet oxygen were investigated for PDT using red excitation light. Different PDT dosimetry approaches were also compared at the same excitation wavelength.8 The objective of the present study is to use this model to examine and compare the distributions of the three PDT parameters and different dose metrics for PDT at different wavelengths. The studied wavelengths are 405, 523, and 633 nm. The 405 nm wavelength representing blue light is close to the maximum absorption of PpIX. The 633 nm light is commonly used in clinics. Green light at 523 nm rather than 540 nm was chosen as a theoretical guide to a pilot study of singlet oxygen luminescence (SOL) detection on normal human skin using a laser source at this wavelength for its suitable characteristics for time-resolved SOL measurement.9 With these wavelengths, the overall influence of the greater absorption coefficient of PpIX and limited excitation light penetration depth at shorter wavelength on the depth-resolved distribution of the reacted singlet oxygen will be evaluated. This can be useful to understand the choice of excitation light source for different clinical treatment targets. 2.Theory and Method2.1.Description of the ModelThe dynamic one-dimensional ALA-PDT model used a semi-infinite three-layer tissue consisting of epidermis, dermis, and subcutaneous fat layers to represent normal human skin. Each layer has uniform optical properties. The optical properties at the wavelengths of interest are shown in Table 1. The excitation light fluence distribution in tissue is simulated using the standard Monte Carlo (MC) method. The adjoint MC method was used to calculate the PpIX fluorescence and SOL signals escaping from the skin surface. Table 1Optical properties of normal human skin. Data were extracted from Salomatina et al.10 The excitation wavelengths are 405, 523, and 633 nm, and the photosensitizer fluorescence and singlet oxygen phosphorescence wavelengths are 705 and 1270 nm, respectively. μa is the absorption coefficient; μs′ is the reduced scattering coefficient (units mm−1). The refractive index is 1.4 for all three layers.
The model incorporates vertical (i.e., perpendicular to the skin surface) ground-state oxygen diffusion due to its spatial concentration gradient. Tissue oxygen can be supplied by diffusion from air and by perfusion from local blood vessels in the dermis and subcutaneous fat layer. The perfusion rate was hypothesized to be dependent on reacted singlet oxygen () dose so that perfusion was reduced commensurate with PDT-induced vascular damage. In the model, oxygen consumption consists of both metabolic consumption () described by the Michaelis-Menten relation and PDT consumption (). The PDT oxygen consumption and the ground-state photosensitizer concentration are found by solving a set of differential equations describing the possible photochemical reaction pathways during PDT. The final two differential equations for updating the concentration of ground-state PpIX and oxygen partial pressure at each depth after delivering a light dose increment are shown in Eqs. (1) and (2). In Eq. (2), oxygen concentration is expressed by the product of oxygen partial pressure () P and solubility coefficient using Henry’s law because continuity in and in the oxygen flux are boundary conditions at depth . The first term on the right-hand side of Eq. (2) represents . The second term is the metabolic oxygen consumption where is the initial maximum metabolic consumption rate of human skin in the steady state, and is the concentration at which is half of . The third term represents the oxygen supply from blood vessels, where , as expressed in Eq. (4), is a sigmoidal irradiance-dependent reacted dose response and is the dose that causes a 50% reduction in initial value. The fourth term represents the tissue oxygen diffusion in the vertical direction, where is the tissue oxygen diffusion coefficient, is the depth grid increment, and the subscripts ‘’ and ‘’ refer to the depths above and below , respectively. A more detailed description of this model and the derivation of these equations can be found elsewhere.7 whereIn the model, the instantaneous production rate of at each depth is calculated via Eq. (5), where is photon absorption rate as defined in Liu et al.7 The emission rates of both sensitizer fluorescence at 705 nm and the SOL at 1270 nm on the skin surface are calculated using Eqs. (6) and (7), where and are the fluence rate and relative fluence at the excitation and corresponding emission wavelengths, respectively; is the absorption coefficient of PpIX; , are the PpIX fluorescence and luminescence quantum yields; and is an empirical scaling factor derived from the adjoint MC simulations.112.2.Treatment SimulationsThe simulations were performed with optical properties shown in Table 1 at excitation wavelengths: 405 nm (blue), 523 nm (green), and 633 nm (red). The treatment irradiance was . Total light exposure was . The initial PpIX concentration was 4.4 μM on the skin surface and decreased exponentially with depth with decay constant . The other parameters used in the simulations are listed in Table 2. Table 2Photophysical and physiological parameters. ϵPpIX and βPDT′ values correspond to wavelengths of 633, 523, and 405 nm. D=0.2×10⁻⁵ cm2 s−1 was used only in the top 50 μm stratum corneum layer, and D=1.25×10⁻⁵ cm2 s−1 was used for other layers. 3.Results and Discussion3.1.Temporal and Spatial Distributions of the PDT QuantitiesFigure 1 shows ground-state oxygen perfusion rate () versus depth as radiant exposure increases at all three wavelengths. As discussed in more detail in Liu et al.,7 a reduction in oxygen perfusion from local blood vessels during treatment was necessary to produce PpIX fluorescence photobleaching results in agreement with clinical measurements reported by Cottrell et al.3 early in the treatment (such as ), the reduction in perfusion is the greatest for blue light due to the greatest absorption of PpIX at this wavelength as shown in Table 2. However, at , there is little difference in the PDT-induced vascular responses. Fig. 1The depth-resolved distribution of oxygen perfusion supply at different treatment wavelengths.  Figure 2(a), 2(c), and 2(e) shows the time-resolved depth distributions of ground-state oxygen at the three wavelengths, and Fig. 2(b), 2(d), and 2(f) presents the corresponding distribution of PpIX. Oxygen in the upper dermis (above 0.5 mm) is rapidly consumed after the delivery of light. This consumption during early PDT is fastest with blue light because of the PpIX absorption coefficient (see Table 2). The region of induced hypoxia gradually spreads to about 1 mm depth at all three wavelengths, and the distributions of tissue oxygen after light exposure at the three wavelengths are almost the same. Fig. 2Depth-resolved distributions of ground-state oxygen and PpIX at different wavelenths. (a), (b) blue light; (c), (d) green light; and (e), (f) red light.  As shown in Fig. 2, PpIX near the skin surface is bleached fastest at 405 nm. Due to the induction of hypoxia in the upper dermis, PpIX remains at the end of treatment. Up to 1 mm depth, more PpIX is preserved at longer wavelength. At depths beyond 1 mm, the amount of remaining PpIX is the greatest at 405 nm at . As shown in Fig. 3, this reflects the limited penetration of treatment light at 405 nm. Fig. 3Comparison of normalized fluence rate at the three treatment wavelengths. The absolute fluence rates at the surface for irradiance of were for blue light, for green light, and for red light.  Figure 3 shows the normalized excitation light fluence rate versus tissue depth for all three wavelengths. The horizontal line indicates a reduction to for comparison of the penetration depths at the three wavelengths. Fluence rate was averaged over the entire treatment at each wavelength. In the model, fluence rate was updated after each increment of delivered light exposure, and the bleaching of PpIX causes small changes in the light absorption coefficients. This change is small compared with the tissue absorption coefficient, so the light fluence rate within tissue did not vary significantly during the treatment. These results are not shown in this paper. The penetration depths with currently used optical properties are about 0.25, 0.65, and 1 mm for blue, green, and red light, respectively. Figure 4(a), 4(b), and 4(c) shows the evolution of the depth-distribution of reacted singlet oxygen during PDT at the three wavelengths. The biological effect of PDT is expected to be caused to this quantity. The initial production rate of is the highest at 405 nm, but the total production of on the skin surface at the end of treatment is the same for all three wavelengths. The reduction in singlet oxygen production rate due to oxygen depletion and PpIX photobleaching in the epidermis and upper dermis can be observed at all wavelengths. Figure 4(d) compares the reacted concentrations at the beginning and the end of PDT for the three wavelengths. Up to a depth of about 1 mm, the amount of reacted singlet oxygen at the end of treatment is practically independent of wavelength. Although the light fluence rate over this depth range is very different at the three wavelengths, the production of singlet oxygen is limited by hypoxia and PpIX photobleaching. At greater depth, sufficient oxygen and PpIX remain, so the production rate of is proportional to the treatment light fluence rate. Fig. 4Depth-resolved distribution of reacted singlet oxygen at different treatment wavelengths. Reacted singlet oxygen is the cumulative concentration of singlet oxygen that reacted with biological substrates. 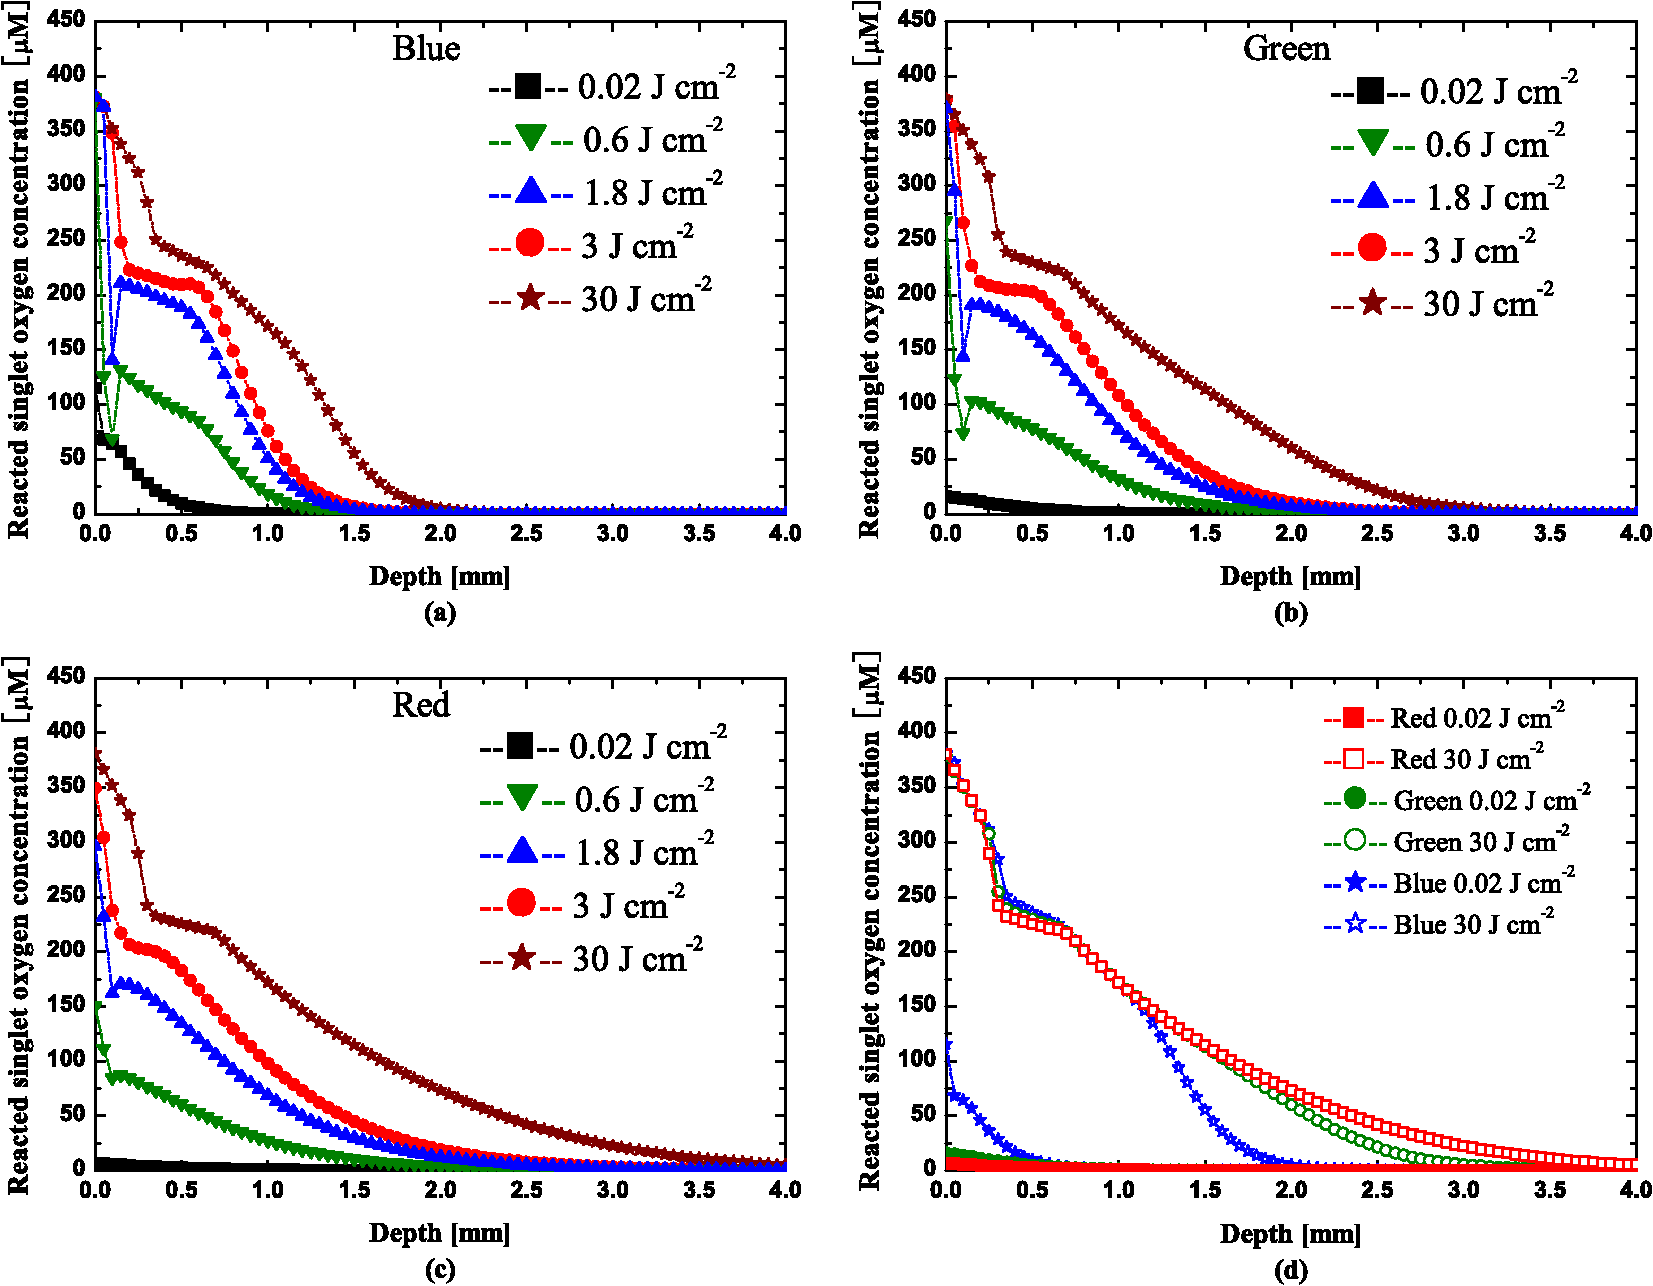 The importance of hypoxia and photobleaching are emphasized by additional calculations shown in Fig. 5. The hollow symbols are the results of the complete simulation [identical to Fig. 4(d)]. The solid symbols are calculations of reacted singlet oxygen based on the initial photosensitizer concentration and the light fluence rate (i.e., product of PpIX concentration, absorption coefficient, light fluence, and singlet oxygen quantum yield); photobleaching and hypoxia are not included. These calculations represent the predictions of an “explicit” dosimetry approach where the initial conditions are accurately determined and assumed to persist throughout the treatment. At sufficient depth, these nearly agree with those of the complete simulation, but closer to the surface, they can be in error by orders of magnitude. The third set of results in Fig. 5 represent simulations where photobleaching was “turned off” by setting to zero in Eq. (1) but where oxygen diffusion and consumption were included. Except for the most superficial layers, these simulations are in good agreement with the full simulations up to a depth of about 1 mm. This demonstrates that hypoxia is more important than photobleaching in determining the singlet oxygen dose in this region. At greater depths, where significant hypoxia is not induced, failure to include photobleaching results in an overestimate of the singlet oxygen dose. At even greater depths, where the fluence is insufficient to cause significant bleaching, all three calculations are in agreement. Fig. 5Comparison of reacted singlet oxygen concentration at three wavelengths for different cases. Note that, for clarity, the curves for the same case were plotted using the results at the same depths for all three wavelengths. The curves for different cases at the same wavelength were plotted using the results at different depths.  In order to match clinical photobleaching data from Cottrell et al.,3 a PDT-induced reduction in blood perfusion was included. We recognize that there is no generally accepted independent evidence for this effect; measurements of blood flow during PDT have been inconclusive.16–20 Although this reduction in perfusion has a significant effect on observed fluorescence, the effect on singlet oxygen dose is relatively small as shown in Fig. 6 in which the results of Fig. 4(d) were replotted and compared to simulations where perfusion was unaltered. 3.2.Dose Metrics ComparisonIn an earlier paper, Liu et al.8 compared different PDT dose metrics and assessed their robustness under varied treatment conditions. Here we extend that analysis to incorporate treatment wavelength. In Liu et al.8 the compared metrics included the total cumulative SOL metric (CSOL), the fractional fluorescence bleaching metric [FFBM given by ], and the absolute fluorescence bleaching metric (AFBM) given by ), where observed is PpIX fluorescence and is its initial value. The comparison showed that the CSOL is the most robust, and that AFBM is more consistent than FFBM especially for varied PpIX concentration and distribution. However, because the absolute emission signals vary by at least one order of magnitude for different excitation wavelengths, only the FFBM is analyzed and compared with the CSOL in this study. The results are shown in Fig. 7 where the two dose metrics are plotted versus average reacted singlet oxygen dose in the dermis (i.e., average over depths 0.1 to 2.5 mm). As seen, the correlation between the CSOL and average reacted singlet oxygen dose in dermis is approximately linear, and is almost independent of the treatment wavelength. In contrast, the FFBM is less robust: the average singlet oxygen dose is about 50% higher for red light than blue light for the same observed reduction in PpIX fluorescence. Instead of the average singlet oxygen dose in the dermis, a more critical parameter might be the dose at a specific depth. In more detailed analysis shown in Fig. 8, we examined the relationship between FFBM and CSOL and the dose at depths of 0, 0.2, 0.5, 1.0, and 2.0 mm. The horizontal lines in the figure indicate the radiant light exposure during progress of PDT treatment. Fig. 8(a), (c), and (e) Correlation of FFBM, and (b), (d), and (f) CSOL to the dose in a 50 μm layer at depths of 0, 0.2, 0.5, 1, and 2 mm for different treatment wavelengths.  As noted in an earlier paper,8 the relationship of the dose metric to the actual dose can be complex, especially for depths less than 1 mm. To examine the effect of treatment wavelength on these relationships, the data for depths 0.2, 0.5, and 1 mm are replotted and shown in Fig. 9. Although hypoxia and photobleaching cause complicated features in these curves at depths 0.2 and 0.5 mm, the influence of treatment wavelength is surprisingly small. The results at 1 mm depth show that the curve for blue light diverges from those for red and green light due to the limited penetration at 405 nm. This is even more prominent at 2 mm depth. 4.ConclusionThe present work is part of a comprehensive investigation of PDT mechanisms and dosimetry using a dynamic model of ALA-PDT of normal human skin. The focus of this paper was on the influence of PDT treatment wavelength on the temporal and spatial distributions of PDT quantities and on different PDT dose metrics. In general, wavelength-dependent differences in time-resolved evolutions of PDT components in the epidermis and upper dermis can be observed only very early in the PDT treatment. After radiant exposure of about , these distributions are almost independent of the treatment wavelength to a depth of about 1 mm. Even though light penetration depth is about four times greater for red light than blue light, the influence of this variation on the distributions, especially for reacted singlet oxygen, was offset by sensitizer photobleaching and tissue oxygen depletion in the upper dermis. Different penetration depth led to different spatial distributions of the quantities only in the deeper tissue where no significant photobleaching and hypoxia occurred. Our simulations showed that tissue hypoxia plays a more important role than photobleaching for depth less than about 1 mm. Moreover, the distributions of reacted singlet oxygen are not very sensitive to the hypothesized reduction in oxygen perfusion, and these conclusions are probably valid under a wide range of conditions. We also compared the wavelength sensitivity of two noninvasive PDT dose metrics: CSOL and FFBM. The relationship between CSOL and singlet oxygen dose (either average dose in the dermis or dose at specific depths) was less dependent on wavelength than that for FFBM. At depths above 1 mm, even for FFBM, the variation with wavelength was small enough to suggest that these methods could be applied across the full spectrum of ALA-PDT treatment wavelengths. ReferencesC. Fritschet al.,
“Green light is effective and less painful than red light in photodynamic therapy of facial solar keratoses,”
Photodermatol. Photoimmunol. Photomed., 13
(5–6), 181
–185
(1997). http://dx.doi.org/10.1111/phpp.1997.13.issue-5-6 PPPHEW 0905-4383 Google Scholar
M. H. Gold,
“Acne vulgaris: lasers, light sources and photodynamic therapy-an update 2007,”
Expert Rev. Anti Infect. Ther., 5
(6), 1059
–1069
(2007). http://dx.doi.org/10.1586/14787210.5.6.1059 1744-8336 Google Scholar
W. J. Cottrellet al.,
“Irradiancedependent photobleaching and pain in -aminolevulinic acid-photodynamic therapy of superficial basal cell carcinomas,”
Clin. Cancer Res., 14
(14), 4475
–4483
(2008). http://dx.doi.org/10.1158/1078-0432.CCR-07-5199 CCREF4 1078-0432 Google Scholar
M. H. GoldM. P. Goldman,
“5-aminolevulinic acid photodynamic therapy: where we have been and where we are going,”
Dermatol. Surg., 30
(8), 1077
–1083
(2004). http://dx.doi.org/10.1111/dsu.2004.30.issue-8 DESUFE 1076-0512 Google Scholar
C. A. Mortonet al.,
“Comparison of red and green light in the treatment of bowens disease by photodynamic therapy,”
Br. J. Dermatol., 143
(4), 767
–772
(2000). http://dx.doi.org/10.1046/j.1365-2133.2000.03773.x BJDEAZ 0007-0963 Google Scholar
K. P. Nielsenet al.,
“Choice of optimal wavelength for PDT: the significance of oxygen depletion,”
Photochem. Photobiol., 81
(5), 1190
–1194
(2005). http://dx.doi.org/10.1562/2005-04-06-RA-478 PHCBAP 0031-8655 Google Scholar
B. LiuT. J. FarrellM. S. Patterson,
“A dynamic model for ALA-PDT of skin: simulation of temporal and spatial distributions of ground-state oxygen, photosensitizer and singlet oxygen,”
Phys. Med. Biol., 55
(19), 5913
–5932
(2010). PHMBA7 0031-9155 Google Scholar
B. LiuT. J. FarrellM. S. Patterson,
“Comparison of noninvasive photodynamic therapy dosimetry methods using a dynamic model of ALA-PDT of human skin,”
Phys. Med. Biol., 57
(3), 825
–841
(2012). PHMBA7 0031-9155 Google Scholar
M. T. Jarviet al.,
“Singlet oxygen luminescence dosimetry (SOLD) for photodynamic therapy: current status, challenges and future prospects,”
Photochem. Photobiol., 82
(5), 1198
–1210
(2006). http://dx.doi.org/10.1562/2006-05-03-IR-891 PHCBAP 0031-8655 Google Scholar
E. Salomatinaet al.,
“Optical properties of normal and cancerous human skin in the visible and near-infrared spectral range,”
J. Biomed. Opt., 11
(6), 1
–9
(2006). http://dx.doi.org/10.1117/1.2398928 JBOPFO 1083-3668 Google Scholar
B. Liuet al.,
“A Monte Carlo model of detected singlet oxygen luminescence and photosensitizer fluorescence during ALA-PDT of skin,”
Proc. SPIE, 7380 73806W
(2009). http://dx.doi.org/10.1117/12.823032 PSISDG 0277-786X Google Scholar
I. GeorgakoudiH. T. Foster,
“Singlet oxygen-versus nonsinglet oxygen-mediated mechanisms of sensitizer photobleaching and their effects on photodynamic dosimetry,”
Photochem. Photobiol., 67
(6), 612
–625
(1998). PHCBAP 0031-8655 Google Scholar
K. K. WangS. MitraT. H. Foster,
“A comprehensive mathematical model of microscopic dose deposition in photodynamic therapy,”
Med. Phys., 34
(1), 282
–293
(2007). MPHYA6 0094-2405 Google Scholar
L. B. JosefsenR. W. Boyle,
“Photodynamic therapy and the development of metal-based photosensitisers,”
Met. Based Drugs., 2008 1
–24
(2008). http://dx.doi.org/10.1155/2008/276109 0793-0291 Google Scholar
J. P. Keeneet al.,
“Direct detection of singlet oxygen sensitized by haematoporphyrin and related compounds,”
Photochem. Photobiol., 43
(2), 117
–120
(1986). http://dx.doi.org/10.1111/php.1986.43.issue-2 PHCBAP 0031-8655 Google Scholar
T. L. Beckeret al.,
“Monitoring blood flow responses during topical ALA-PDT,”
Biomed. opt. Express, 2
(1), 123
–130
(2011). http://dx.doi.org/10.1364/BOE.2.000123 BOEICL 2156-7085 Google Scholar
A. M. K. Enejderet al.,
“Blood perfusion studies on basal cell carcinomas in conjunction with photodynamic therapy and cryotherapy employing laser-Doppler perfusion imaging,”
Acta. Derm. Venereol., 80
(1), 19
–23
(2000). ADVEA4 1651-2057 Google Scholar
M. A. HermanD. FrommD. Kessel,
“Tumor blood-flow changes following protoporphyrin IX-based photodynamic therapy in mice and humans,”
J. Photochem. Photobiol. B, 52
(1–3), 99
–104
(1999). http://dx.doi.org/10.1016/S1011-1344(99)00109-8 JPPBEG 1011-1344 Google Scholar
J. Tyrrellet al.,
“Oxygen saturation and perfusion changes during dermatological methylaminolaevulinate photodynamic therapy,”
Br. J. Dermatol., 165
(6), 1323
–1331
(2011). http://dx.doi.org/10.1111/bjd.2011.165.issue-6 BJDEAZ 0007-0963 Google Scholar
I. Wanget al.,
“Superficial blood flow following photodynamic therapy of malignant non-melanoma skin tumours measured by laser Doppler perfusion imaging,”
Br. J. Dermatol., 136 18
–49
(1997). http://dx.doi.org/10.1111/j.1365-2133.1997.tb14893.x BJDEAZ 0007-0963 Google Scholar
|
||||||||||||||||||||||||||||||||||||||||||||||||||||||||||||


