
|
|
1.IntroductionOesophageal adenocarcinoma is increasing more rapidly than any other tumor in the western world.1–4 Malignant transformation is preceded by a metaplastic change in the cells lining the oesophagus from squamous to columnar epithelium. This intestinal metaplasia termed Barrett’s oesophagus has become an increasingly common complication of chronic gastro-oesophageal reflux disease and has a population prevalence of 1% to 3%.5 Barrett’s oesophagus may progress through histologically described premalignant stages of low-grade dysplasia (LGD) and high-grade dysplasia (HGD) and conveys a 30- to 125-fold increased risk of adenocarcinoma.6 The prognosis of oesophageal cancer remains poor with 1 and 5 year survival rates of 28% and 8% to 15%, respectively.7,8 Outcomes can be dramatically improved by early detection of asymptomatic tumors, or identification and treatment of premalignant high-grade dysplastic lesions. Patients with Barrett’s oesophagus therefore undergo regular endoscopic surveillance to monitor for early neoplastic changes. However, endoscopic detection of dysplasia is notoriously difficult and subjective, and clinicians therefore rely on a policy of random four-quadrant biopsies every 2 cm of Barrett’s oesophagus.9 This policy samples less than 2% of the mucosa and may miss dysplastic or even early malignant change. Reid et al. demonstrated that 50% of early adenocarcinomas may be missed using a routine surveillance biopsy protocol in patients with HGD.10 In addition to the sampling error of standard biopsy regimens and the low sensitivity of targeted biopsies, diagnostic difficulties are further compounded by limited inter-observer agreement between pathologists ( to 0.6), especially for distinguishing nondysplastic Barrett’s oesophagus from LGD.11,12 There is a considerable clinical need for an advanced imaging tool which could provide immediate, objective diagnosis of HGD and early adenocarcinoma prompting corroborative biopsy or targeted endoscopic resection (ER) of focal lesions. This targeted endoscopic therapy could potentially prevent progression to invasive malignancy in those with HGD and can be considered analogous to excision of adenomatous colonic polyps, or cervical excision in cervical intraepithelial neoplasia. Previously, we have demonstrated that Raman spectroscopy (RS) can objectively distinguish eight different oesophageal cell types in vitro.13 RS is an inelastic scattering technique which generates a biochemical profile of the tissue being interrogated. Neoplastic lesions have been shown to display subtle alterations in molecular composition which are detectable by RS and can enable objective tissue classification.13–18 RS lends itself perfectly to in vivo application as it is rapid, noninvasive, highly accurate, objective, and does not require tissue preparation or exogenous administration of stains or contrast. Translation of Raman spectroscopy into a clinically applicable diagnostic tool capable of in vivo endoscopic assessment of the oesophagus requires the use of a specialized fiber-optic probe of at least 90 cm in length which must be compatible with standard medical endoscopes. A custom-built confocal Raman probe has been described previously.19 The probe optics have recently been modified to ensure a sampling depth of 100 to 200 μm so that early neoplastic changes in the mucosa are not obscured by signal generated from deeper structures.19,20 In addition, the probe has been designed for direct contact with the oesophageal epithelium and is small enough to pass down the instrument channel of a standard endoscope. This translational study evaluates the potential of this novel Raman probe for the classification of early neoplasia in the distal oesophagus ex vivo. Probe performance has been evaluated from a translational standpoint, ensuring clinically applicable laser power at the probe tip and short spectral acquisition times which will be feasible during routine oesophagoscopy. 2.Materials and Methods2.1.Raman Probe SystemThe endoscopic Raman probe system consists of a monochromatic 830 nm Innovative Photonics Systems (Princeton, New Jersey) laser; a Renishaw system 100 spectrometer (Renishaw Plc., Wotton-under-Edge, Gloucestershire, UK) optimized for near infrared (NIR) signals including a deep depletion charge coupled device (CCD) camera; and the custom-built Raman probe. The probe has a fiber-optic length of 90 cm and is 2.7 mm in diameter enabling passage through the instrument channel of a standard medical endoscope. Its internal optical constituents are illustrated in Fig. 1 and have been described in detail elsewhere.19 However, the probe used in this study was modified to incorporate a GRIN (graded index) lens at the distal tip such that the probe could be placed in contact with the sample. Power output at the probe tip was regulated to 60 mW. Fig. 1Optical components of the custom-built Raman probe.19 The confocal design facilitates an extremely shallow depth of field and ensures the excitation volume matches the sampling volume.  2.2.Sample Preparation and Spectral AcquisitionInformed consent was provided by all patients permitting ex vivo spectral analysis of their oesophageal tissue. Ethical approval for the study was obtained from the Gloucestershire Local Research Ethics Committee, Gloucester, UK. Following surgical oesophagectomy with curative intent in patients with neoplastic disease, multiple spectra were measured from fixed points across the mucosal surface of the distal oesophagus using a Perspex grid to define measurement locations (Fig. 2). The Perspex grid comprised 200 holes, each with a diameter of 3 mm arranged in a rectangular orientation. Each of the holes were 1 mm apart. The columns and rows of the grid were labeled to enable correlation of the grid position with the Raman spectral measurement. Fig. 2Raman spectra were measured from specified grid positions (on the resected oesophagus samples) and correlated with histology following biopsy at the corresponding grid position. 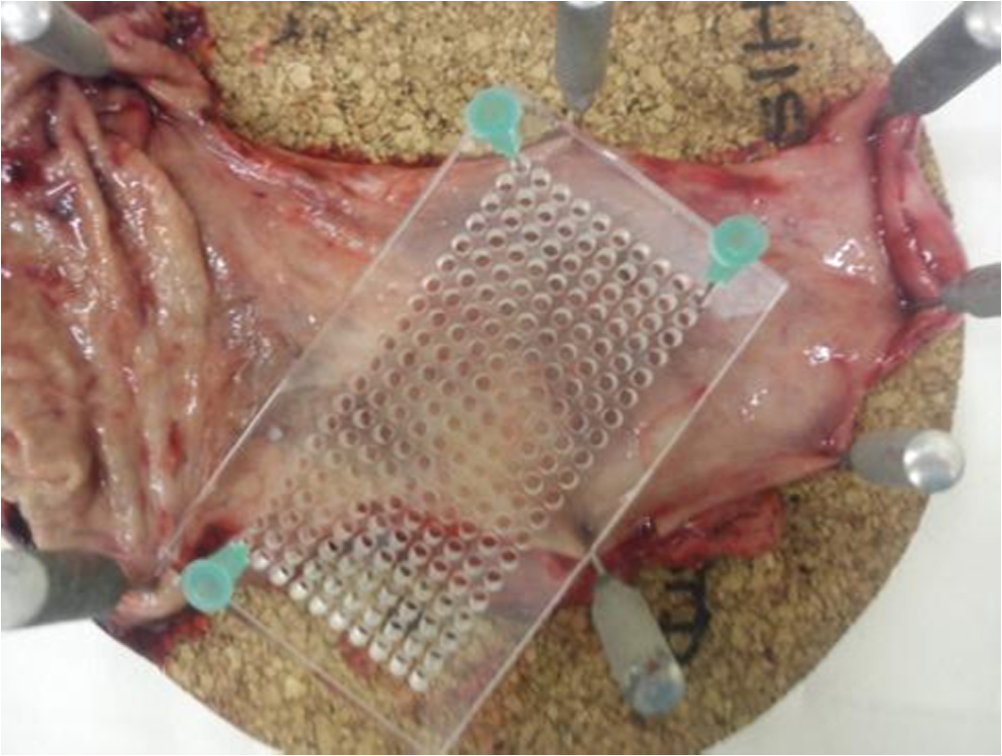 The surgical specimen was opened and the grid was placed onto to the mucosal surface and pinned in place at each corner to prevent movement during spectral measurements. The probe was then passed through specified grid positions and gently apposed to the tissue by hand to mimic the clinical environment. Raman spectra were acquired using a 1 s acquisition time across the wavenumber range of 400 to . Following spectral measurement, a biopsy was taken using standard endoscopy forceps at each of the specified grid positions and immediately fixed in formalin. All samples were paraffin embedded, microtomed and stained with Haematoxylin & Eosin (H&E) prior to expert histological reporting. In addition, both endoscopic resection and endoscopic biopsy samples were used to augment the spectral dataset and increase the numbers of Barrett’s and dysplastic samples. When collecting endoscopic samples the specimens were immediately placed on acetate and snap frozen in liquid nitrogen in order to prevent the tissue from drying out prior to spectral analysis. They were subsequently allowed to defrost at room temperature for 5 min and mounted on calcium fluoride substrate, with the mucosal surface facing upwards, before measurement. One spectrum was acquired per biopsy specimen. Following spectral measurement, the endoscopic biopsy tissue was immediately fixed in formalin. Subsequently, samples were routinely processed prior to expert histological analysis. 2.3.Statistical AnalysisThe measured Raman spectra represent a combination of tissue autofluorescence, weak tissue Raman scattering signals, and noise from background signals generated by the probe and spectrometer components. Raw spectral data were normalized using standard vector normalization, mean-centred, and interpolated to integer wavenumber spacings between 400 and . No additional preprocessing steps were employed (such as green glass correction/air background subtraction) as principal component analysis (PCA) fed linear discriminant analysis (LDA) has previously been shown to extract the spectral features necessary for diagnostic classification despite considerable background signal. Additional preprocessing steps do not reliably improve classification performance and may introduce systematic error.14,20 A principal component fed linear discriminant classification model was developed in Matlab (Mathworks, Inc.). PCA was used to generate principal components which described the variance within the dataset whilst preserving the spectral information necessary for diagnostic classification. The number of PCs was optimized to maximize classification performance and prevent over-fitting due to noise. Linear discriminant analysis was then employed which utilized pathological information in order to define functions which enabled spectral classification. The classification performance of the model was validated using leave one tissue site out cross-validation. 3.Results and DiscussionWe measured 337 spectrafrom fresh (95%) and snap-frozen (5%) oesophageal tissue from 28 patients. We excluded 34 spectra from further analysis due to histological assessment demonstrating either nonhomogenous tissue (containing more than one pathology) or clinical irrelevance (e.g., adipose connective tissue). Following histological diagnosis samples were separated into three groups: normal squamous oesophagus, Barrett’s oesophagus, and HGD/cancer. Figure 3 illustrates mean 1 s Raman spectra for each group. An air background spectrum is also shown for comparison. Despite considerable background signal due to intrinsic scattering and fluorescence generated within the optical probe fibers, characteristic spectral peaks are clearly identifiable. PCA was used to further extract subtle spectral differences and was coupled with LD analysis to aid determination of features important for tissue classification. Fig. 3Unprocessed 1 s Raman probe spectra measured from (a) Barrett’s oesophagus, (b) adenocarcinoma, and (c) normal squamous oesophagus. Spectra have been offset for clarity. An air background spectrum (d) is shown for comparison and prominent spectral features have been identified.  In order for an endoscopic Raman system to be of major clinical use it must be sufficiently sensitive to discriminate HGD and early (intramucosal, T1a) cancer from other oesophageal pathologies as these lesions are frequently indistinct at routine white light endoscopy. We therefore initially developed a three group PC-fed LD classification model. We excluded 42 spectra from this model as they were from upper gastric tissue sites. Inclusion of the first fifteen principal components was found to optimize the performance of the model. Figure 4 illustrates the scatter plot of cross-validated LD scores of each Raman probe prediction, demonstrating the predictive capability of the classification model. Sensitivities of 82% to 86% for the three pathologies with specificities of 90% to 97% (Table 1) were attained. Figure 4 also illustrates the classification of the small number of spectra (5%) acquired from endoscopic biopsy tissue which had been snap frozen. Repeat PC-fed LDA following exclusion of these samples demonstrates a minimal change in classification performance (Table 2). Fig. 4Linear discriminant analysis scatter plot of the three group classification model. All spectra were acquired in 1 s. Spectra acquired direct from surgically resected oesophagi have been represented with open symbols, and those acquired from biopsies taken during endoscopy have been represented with filled symbols. 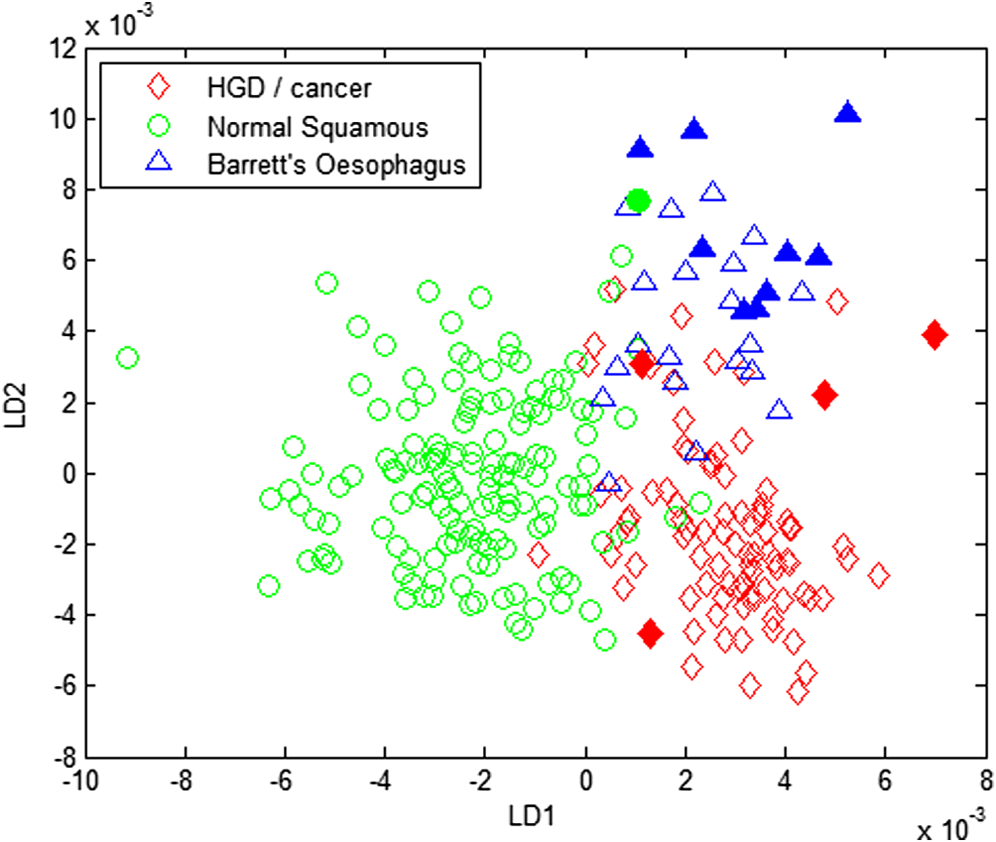 Table 1Classification performance of the three group model following leave one tissue site out cross validation.
Table 2Classification performance of the three group model after exclusion of the endoscopic biopsy samples which had been snap frozen. The results were validated using leave one tissue site out cross validation.
Figure 5(a) and 5(b) shows the two linear discriminant function (LDF) loadings plotted for the three group classification model. A 15 point, second order polynomial Savitsky-Golay smooth was applied in Matlab (MathWorks Inc.) to the LD loadings following spectral classification in order to aid visual identification of prominent peaks and to reduce possible fitting of peak identities to noise spikes. Smoothing was not applied prior to diagnostic classification and therefore did not influence classification performance. Biomolecular modeling of oesophageal tissue has previously demonstrated the prominence of glycogen in benign squamous oesophageal tissue.15,18,21 It is likely that the Raman bands highlighted at 487, 863, 933, and in the LDF1 plot represent a higher glycogen concentration in the squamous epithelium and contribute significantly to the ability to separate between normal and metaplastic/neoplastic tissue (Fig. 5). The LDF2 plot illustrates prominent Raman bands at positions 498, 686, and . These peaks can be tentatively assigned to nucleic acid bases which predominate in neoplastic tissue and correspond to increased DNA and RNA concentrations.15 The prominent peaks in the negative direction for LDF2 appear to originate from disordered proteins, which are reduced in the progression to neoplasia. Fig. 5Linear discriminant function plots 1 (a) and 2 (b). Savitsky-Golay smoothing has been applied in Matlab (MathWorks Inc.) and prominent peaks have been highlighted.  Normal squamous epithelium can usually be differentiated from Barrett’s oesophagus at endoscopy. However, HGD and early cancer may be macroscopically indistinguishable from nondysplastic Barrett’s oesophagus. A second (two-group) classification model was therefore developed which included Barrett’s oesophagus and HGD/cancer [Fig. 6(a)]. For comparison the results of a two group algorithm (normal squamous versus HGD/cancer) is also illustrated in Fig. 6(b). Cross-validated results yielded a sensitivity of 88% and a specificity of 87% for separating neoplasia from Barrett’s oesophagus. The positive predictive value for detecting a neoplastic lesion was 95% in this model. Neoplasia could be separated from normal squamous oesophagus with a sensitivity of 93% and a specificity of 95%. Fig. 6(a) Two-group histogram demonstrating the classification performance of the two group model HGD/cancer versus Barrett’s oesophagus; and (b) normal squamous oesophagus versus HGD/cancer.  These results demonstrate high diagnostic accuracies for detecting dysplastic and cancerous oesophageal pathology in clinically applicable timescales (1 s measurements). Importantly, we have established the ability of this novel probe to identify neoplastic lesions which may be clinically indistinguishable from Barrett’s oesophagus, highlighting the potential to prompt mucosal biopsy, or to enable targeted endoscopic therapy and margin assessment. Endoscopic resection of early oesophageal neoplasia (HGD and T1a adenocarcinoma) can achieve excellent outcomes in patients with focal disease and prevent the need for major abdominal and thoracic surgery. Currently, clinicians find difficulty in accurately identifying appropriate lesions and ensuring complete excision. We have demonstrated that an endoscopic Raman probe could be of significant clinical benefit in this setting. If a Raman system was being used clinically to aid targeted resection of focal lesions, then receiver operating characteristic (ROC) curve analysis could be used to minimize false positive results, maximizing specificity, and in doing so, reducing the risk of over-treatment.14,18,22 Alternatively, an endoscopic Raman system may also be used as a biopsy targeting tool to minimize missed dysplasia in patients newly diagnosed with Barrett’s oesophagus. In this setting ROC curve analysis could optimize the classification performance so that the number of false negative results was decreased in expense of a higher false positive rate. Although prompting increased numbers of tissue biopsies, this modification would serve to reduce the incidence of missed neoplastic pathology. In our three group model the negative predictive value for HGD/cancer was 91%, ROC curve analysis could shift this to nearer 100% if intended for use in a screening or surveillance setting. Several studies, including some pilot in vivo trials, have previously demonstrated diagnostic potential for fiber-optic Raman spectroscopic analysis of oesophageal tissue.18,21,23–25 However, results have been limited by either an inability to accurately detect the most superficial mucosal changes (dysplasia or intramucosal cancer) or the need for prolonged, clinically impractical spectral acquisition times in order to yield acceptable accuracy. In 2011, Huang et al. published preliminary results following an in vivo trial of multimodality imaging, including 785 nm RS, in the oesophagus of 27 patients.18 They reported a sensitivity of 97% and a specificity of 95% for separating oesophageal cancer from normal squamous mucosa.18 Although extremely promising, no comment was made regarding the ability of the Raman imaging system to detect dysplasia or early cancer which was not evident using white light endoscopy. In addition, the ability to distinguish between Barrett’s oesophagus and cancer was not documented. The only previous studies to report the detection of oesophageal dysplasia using RS used longer, clinically impractical, spectral acquisition times (2 to 10 s).24,26 However, despite these limitations these studies demonstrate a clear potential for the application of RS to in vivo oesophageal diagnostics. Further optimization of optical coupling in addition to ultra-high sensitivity CCDs and high quality notch filters will continue to increase diagnostic accuracy. In particular, the use of confocal probe designs will facilitate interrogation of superficial mucosal tissues so that the spectral signal is free from interference from deeper structures. Measurement depths of 100 to 200 μm enable accurate assessment of the surface epithelium so that the earliest neoplastic changes can be detected.15,19 It is possible that this may even allow identification of a malignant tendency, based on cellular molecular changes, before morphological changes of dysplasia have manifest. Further studies should address the need for accurate depth calibration and optimization. In the future, RS probes may be capable of staging early oesophageal tumors or characterizing paraoesophageal lymph nodes under endoscopic ultrasound guidance. In this study, we have not aimed to subclassify between grades of dysplasia. This was due to very low numbers of homogenous LGD tissue samples as well as the recognized potential for histopathological misclassification of nondysplastic Barrett’s oesophagus as LGD.11,12 In addition, the clinical significance of LGD is low, as progression to adenocarcinoma is rare in this group.27,28 The important clinical need is for a tool that can identify and classify HGD and early cancer and this potential has been demonstrated here. We also acknowledge that all spectra have been acquired from a biased population as patients all had a history of Barrett’s oesophagus and/or adenocarcinoma. However, this would likely be the target population for this clinical tool. In addition, spectra were acquired from ex vivo tissue which, although fresh and unprocessed, had been devascularized and therefore rendered ischaemic. The effects of ischeamia on spectral signal are difficult to quantify but must be considered when attempting to generalize results of ex vivo studies to in vivo diagnosis. It is also important to acknowledge that the unprocessed spectra include some contribution from autofluorescence. However, this does not appear to account for pathological separation as evidenced by the LD function plots. The intention has been to minimize fluorescence signal by selecting a near-infrared excitation wavelength since it is well established that fluorescence signal alone is not sufficient to accurately discriminate the pathology groups of interest. 4.ConclusionRaman spectroscopy is a unique method of optical interrogation which provides rapid, objective tissue diagnosis and characterization based on the biochemical profile of the target tissue, without the need for staining or exogenous contrast administration. The diagnostic accuracy of a novel endoscopic Raman probe system has been evaluated. PC-fed LD classification models, tested with leave one site out cross validation, demonstrated high sensitivity and specificity for the detection of oesophageal dysplasia and cancer even in the presence of Barrett’s oesophagus. More samples are required to increase the size of the model such that the discrimination of HGD from other pathologies is feasible and also to test the model with an independent test dataset. Further probe modifications will continue to increase spectral quality and hence impact further on improving diagnostic accuracy in even more rapid timescales (potentially approaching real time imaging). A clinical trial in patients with Barrett’s oesophagus, who are known to be at an increased risk of neoplastic transformation, is needed to further evaluate this novel endoscopic diagnostic system and demonstrate a potential impact on clinical practice. RS could offer clinicians a mechanism of immediate, objective diagnosis which is both highly sensitive and specific for early neoplasia. However, the transferability and repeatability of spectral measurements acquired with different Raman systems must be evaluated and system calibration carefully formalized. ReferencesW. J. Blotet al.,
“Rising incidence of adenocarcinoma of the esophagus and gastric cardia,”
JAMA, 265
(10), 1287
–1289
(1991). http://dx.doi.org/10.1001/jama.1991.03460100089030 JAMAAP 0098-7484 Google Scholar
S. S. DevesaW. J. BlotJ. F. Fraumeni Jr.,
“Changing patterns in the incidence of esophageal and gastric carcinoma in the United States,”
Cancer, 83
(10), 2049
–2053
(1998). http://dx.doi.org/10.1002/(ISSN)1097-0142 CANCAR 1097-0142 Google Scholar
P. Bytzeret al.,
“Adenocarcinoma of the esophagus and Barrett's esophagus: a population-based study,”
Am. J. Gastroenterol., 94
(1), 86
–91
(1999). http://dx.doi.org/10.1111/ajg.1999.94.issue-1 0002-9270 Google Scholar
F. Yousefet al.,
“The incidence of esophageal cancer and high-grade dysplasia in Barrett's esophagus: a systematic review and meta-analysis,”
Am. J. Epidemiol., 168
(3), 237
–249
(2008). http://dx.doi.org/10.1093/aje/kwn121 AJEPAS 0002-9262 Google Scholar
J. Ronkainenet al.,
“Prevalence of Barrett's esophagus in the general population: an endoscopic study,”
Gastroenterology, 129
(6), 1825
–1831
(2005). http://dx.doi.org/10.1053/j.gastro.2005.08.053 GASTAB 0016-5085 Google Scholar
H. J. SteinJ. R. Siewert,
“Barrett's esophagus: pathogenesis, epidemiology, functional abnormalities, malignant degeneration, and surgical management,”
Dysphagia, 8
(3), 276
–288
(1993). http://dx.doi.org/10.1007/BF01354551 DYSPE2 Google Scholar
J. R. Reeset al.,
“Treatment for Barrett's oesophagus,”
Cochrane Database Syst. Rev., 20
(1), CD004060
(2010). http://dx.doi.org/10.1007/BF01354551 Google Scholar
Cancer Research UK,
(2011) http://cancerhelp.cancerresearchuk.org/type/oesophageal-cancer/Website ( December ). 2011). Google Scholar
A. WatsonR. C. HeadingN. A. Shepherd,
“A Report of the Working Party of the British Society of Gastroenterology,”
(2005). Google Scholar
B. J. Reidet al.,
“Optimizing endoscopic biopsy detection of early cancers in Barrett's high-grade dysplasia,”
Am. J. Gastroenterol., 95
(11), 3089
–3096
(2000). http://dx.doi.org/10.1111/j.1572-0241.2000.03182.x 0002-9270 Google Scholar
N. J. ShaheenJ. E. Richter,
“Barrett's oesophagus,”
Lancet, 373
(9666), 850
–861
(2009). http://dx.doi.org/10.1016/S0140-6736(09)60487-6 LANCAO 0140-6736 Google Scholar
M. Kerkhofet al.,
“Grading of dysplasia in Barrett's oesophagus: substantial interobserver variation between general and gastrointestinal pathologists,”
Histopathology, 50
(7), 920
–927
(2007). http://dx.doi.org/10.1111/j.1365-2559.2007.02706.x HISTDD 1365-2559 Google Scholar
C. Kendallet al.,
“Raman spectroscopy, a potential tool for the objective identification and classification of neoplasia in Barrett's oesophagus,”
J. Pathol., 200
(5), 602
–609
(2003). http://dx.doi.org/10.1002/(ISSN)1096-9896 JPTLAS 0022-3417 Google Scholar
C. Kendallet al.,
“Exploiting the diagnostic potential of biomolecular fingerprinting with vibrational spectroscopy,”
Faraday Discuss., 149 279
–290
(2011). http://dx.doi.org/10.1039/c005379a FDISE6 0301-7249 Google Scholar
G. Shettyet al.,
“Raman spectroscopy: elucidation of biochemical changes in carcinogenesis of oesophagus,”
Br. J. Cancer, 94
(10), 1460
–1464
(2006). http://dx.doi.org/10.1038/sj.bjc.6603102 BJCAAI 0007-0920 Google Scholar
P. Crowet al.,
“The use of Raman spectroscopy to identify and grade prostatic adenocarcinoma in vitro,”
Br. J. Cancer, 89
(1), 106
–108
(2003). http://dx.doi.org/10.1038/sj.bjc.6601059 BJCAAI 0007-0920 Google Scholar
N. StoneC. KendallH. Barr,
“Raman spectroscopy as a potential tool for early diagnosis of malignancies in esophageal and bladder tissues,”
Handbook of Vibrational Spectroscopy, Wiley(2008). Google Scholar
M. S. Bergholtet al.,
“In vivo diagnosis of esophageal cancer using image-guided Raman endoscopy and biomolecular modeling,”
Technol. Cancer Res. Treat., 10
(2), 103
–112
(2011). 1533-0346 Google Scholar
J. C.C. Dayet al.,
“A miniature confocal Raman probe for endoscopic use,”
Phys. Med. Biol., 54
(23), 7077
–7087
(2009). http://dx.doi.org/10.1088/0031-9155/54/23/003 Google Scholar
J. Hutchingset al.,
“Evaluation of linear discriminant analysis for automated Raman histological mapping of esophageal high-grade dysplasia,”
J. Biomed. Opt., 15
(6), 066015
(2010). http://dx.doi.org/10.1117/1.3512244 JBOPFO 1083-3668 Google Scholar
M. S. Bergholtet al.,
“Characterizing variability in in vivo Raman spectra of different anatomical locations in the upper gastrointestinal tract toward cancer detection,”
J. Biomed. Opt., 16
(3), 037003
(2011). http://dx.doi.org/10.1117/1.3556723 JBOPFO 1083-3668 Google Scholar
N. Stoneet al.,
“Raman spectroscopy for identification of epithelial cancers,”
Faraday Discuss., 126 141
–157
(2004). http://dx.doi.org/10.1039/b304992b FDISE6 0301-7249 Google Scholar
M. G. Shimet al.,
“In vivo near-infrared Raman spectroscopy: demonstration of feasibility during clinical gastrointestinal endoscopy,”
Photochem. Photobiol., 72
(1), 146
–150
(2000). Google Scholar
L. M. Wong Kee Songet al.,
“Diagnostic potential of Raman spectroscopy in Barrett's esophagus,”
Proc. SPIE, 5692 140
–146
(2005). http://dx.doi.org/10.1117/12.584986 PSISDG 0277-786X Google Scholar
Y. Hattoriet al.,
“In vivo Raman study of the living rat esophagus and stomach using a Micro-Raman probe under an endoscope,”
Appl. Spectrosc., 61
(6), 579
–584
(2007). http://dx.doi.org/10.1366/000370207781269747 APSPA4 0003-7028 Google Scholar
C. Kendallet al.,
“Evaluation of Raman probe for oesophageal cancer diagnostics,”
Analyst, 135
(12), 3038
–3041
(2010). http://dx.doi.org/10.1039/c0an00536c ANLYAG 0365-4885 Google Scholar
F. Hvid-Jensenet al.,
“Incidence of adenocarcinoma among patients with Barrett's esophagus,”
N. Engl. J. Med., 365
(15), 1375
–1383
(2011). http://dx.doi.org/10.1056/NEJMoa1103042 NEJMAG 0028-4793 Google Scholar
S. Waniet al.,
“Risk factors for progression of low-grade dysplasia in patients with Barrett's esophagus,”
Gastroenterology, 141
(4), 1179
–86
(2011). http://dx.doi.org/10.1053/j.gastro.2011.06.055 GASTAB 0016-5085 Google Scholar
|
||||||||||||||||||||||||||||||||||||||||||||||||||||||||||||||


