|
|
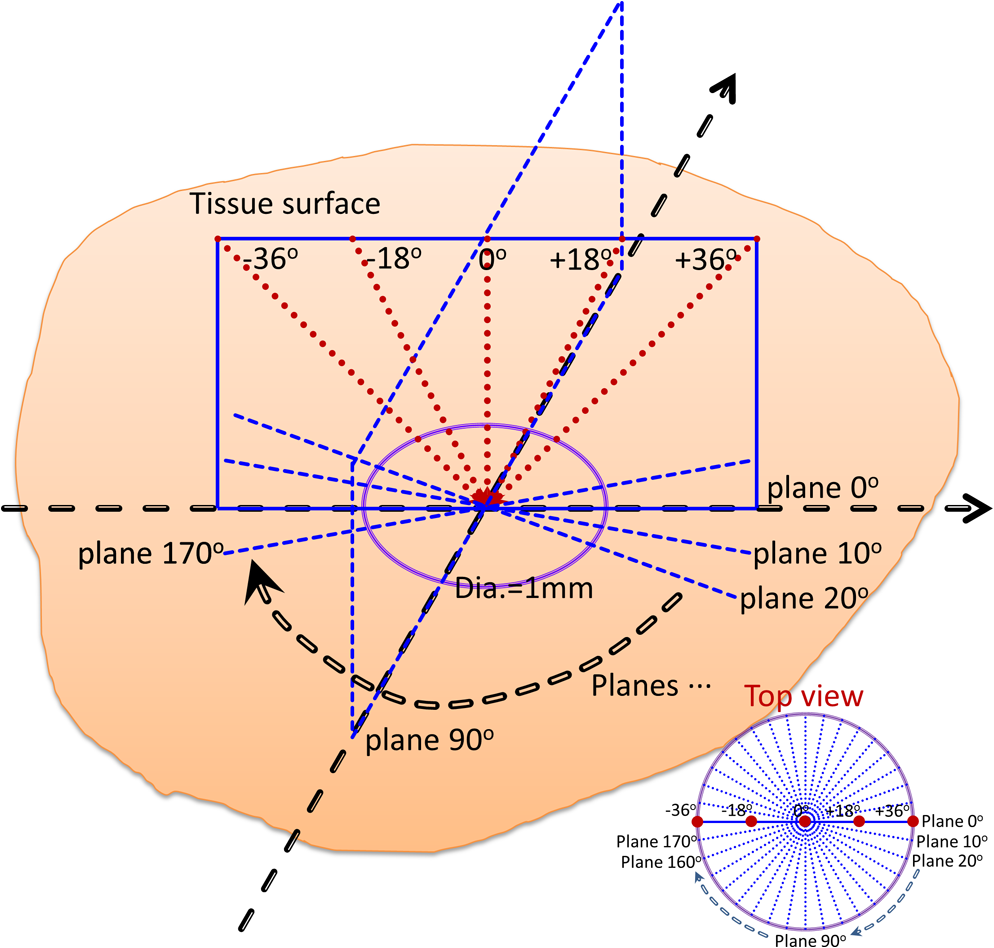
1.IntroductionOvarian cancer is the leading cause of death from gynecologic cancer because it is predominantly diagnosed in late stages, due to the lack of distinctive early symptoms, as well as the lack of efficacious screening and diagnostic techniques.1 The stroma of the ovary is made of primarily Type 1 collagen, so this is an important component of the ovary to target for early changes which may precede malignancy. Collagen fibers are the main scatterers in the stroma underlying the epithelium and recent studies, using optical techniques, have shown that collagen properties may change as malignancy develops.2–4 Light propagation in biological tissue follows Beer-Lambert law, , where is the total attenuation coefficient, is the optical path length and is the incident light intensity. Total attenuation coefficient is the summation of absorption coefficient, , and scattering coefficient, . Because is much smaller than , , can be used as an estimate of the local scattering properties. These two parameters, and or scattering coefficient, have been used to characterize biological tissue properties.2–11 Adam et al. proposed angle-resolved low coherence interferometry5 to obtain angular distribution of reflectance of backscattered light . They used this technique to detect intestinal dysplasia and a statistically significant correlation between increased nuclei size, reduced nuclei density and the presence of dysplasia at the basal layer of epithelium was found.6 Kasaragod et al.7 measured the reflectance, by using optical coherence tomography (OCT), over different angles of illumination and comparatively studied scattering properties of collagen fibers in bovine tendon and cartilage. OCT is a well-established, high resolution, imaging technique which has been widely applied in biomedicine.8 In addition to offering high resolution morphological images, OCT is capable of quantitatively estimating total attenuation coefficient by fitting the A-line measurements to a modified Beer-Lambert function.9 This method has been used to assess early demineralization in teeth10 and characterize ovarian tissue.11 In this paper, we quantitatively analyzed the scattering properties of normal and malignant ovarian tissue by extracting the angle-resolved scattering coefficients from OCT images acquired with different illumination angles and calculating the cross correlations between these angle-resolved scattering coefficients over different OCT imaging planes. We also, qualitatively, studied collagen fiber properties by staining histological slides with pircrosirius red protocol. To the best of our knowledge, this is the first study using angle-resolved optical scattering properties to characterize normal and malignant ovarian tissues. 2.Methods and MaterialsOvaries were surgically removed from patients undergoing prophylactic oophorectomy at the University of Connecticut Health Center (UCHC). The patients were at risk for ovarian cancer, had an ovarian mass, or pelvic mass suggesting malignancy. This study was approved by the Institutional Review Boards of UCHC, and informed consent was obtained from all patients. Ovaries were kept in NaCl solution and imaged within 24 h of oophorectomy. After OCT imaging, the ovaries were fixed in 10% formalin solution and returned to the Pathology Department for histological processing. In this study, 10 human ovaries were investigated. The technical details, of the Fourier-domain OCT system used in this study, has been described in a previous publication.12 The system sensitivity is 109 dB and the diameter of light beam illuminated on the sample is 25 μm. Figure 1 shows the imaging acquisition configuration. The purple circle represents the imaging area with diameter of 1 mm. 90 OCT images are obtained by illuminating incident light beam at different angles ranging from to with a step of 18 deg (5 angles) at different imaging planes ranging from 0 deg to with a step of 10 deg (18 planes). The probe positions were precalculated and adjusted to assure the same slice of sample was captured on each imaging plane. The B-scan width from each image is 1 mm corresponding to 300 A-lines. The scattering coefficient is extracted by fitting the compounded OCT A-lines into a single scattering model, which was based on Beer-Lambert law, and accounts for the confocal point spread function property of sample arm optics.9,11 The fitting started about 40 μm below the tissue surface to avoid the effect of surface epithelium. The fitting depth is 0.4 mm, within which, the single scattering model is suitable and system sensitivity roll-off effect on the measurement is negligible.12 The specific fitting procedures were presented elsewhere11 in detail. For each illumination angle at each imaging plane, the average scattering coefficient was obtained from three repeated measurements. For each imaging plane, the five average scattering coefficients, calculated from five different illumination angles, formed a dataset. Mean cross correlation coefficient (MCC) was introduced to characterize the property of ovarian tissue and differentiate normal and malignant ovaries. MCC is the mean value of cross correlation coefficients between different datasets and measures the angle-resolved scattering similarity between different imaging planes. It is defined as: 3.Results and DiscussionTo evaluate the fitting accuracy, a phantom made of polyvinyl chloride-plastisol and titanium dioxide () powder with calibrated scattering coefficient of was measured. The estimated value, under perpendicular illumination using the model described in Sec. 2, was and lower values were obtained at larger angles of 18 and 36 deg. Figure 2 shows a comparison example between normal and malignant, ovarian tissue. The 18 datasets of angle-resolved scattering coefficient, measured from different imaging planes, were plotted as different color curves, as shown in Fig. 2(a) and 2(b), which are obtained from normal and malignant ovaries, respectively. The distribution trends, of the 18 non cancer datasets in Fig. 2(a), are quite homogeneous but this close similarity is not present in malignant ovaries, as shown in Fig. 2(b). The calculated MCC for these two imaging areas are 0.87 and 0.22, respectively, with a strong correlation noted in the nonmalignant ovaries and much lower correlation in the malignant ovaries. The error bars indicate the standard deviation of three repeated measurements. The OCT images and picrosirius red histology corresponding to one of the 18 imaging planes of the normal and malignant ovarian tissue are shown in Fig. 2(c)–2(f). The red color in the histology represents the collagen fibers. There is a large discrepancy between Fig. 2(d) and 2(f) in terms of collagen content, fiber structure and directionality. The normal ovary exhibits almost exclusively collagen with interspersed stromal cells. The collagen fibers are randomly oriented and run in a wavy course. The malignant ovary exhibits less collagen content with collagen fibers unidirectionally organized into thicker bundles embedded around nests of malignant cells. The collagen, near the ovarian surface, forms a more homogenous three-dimensional network in the normal ovary than is observed in the malignant ovary. Therefore, a higher cross correlation value among the 18 angled-resolved imaging planes is expected for normal ovarian tissue and a lower value is expected for malignant ovarian tissue. Fig. 2Top: plots of angle-resolved scattering coefficients on 18 different OCT imaging planes from (a) normal ovarian tissue and (b) malignant ovarian tissue. Bottom: OCT images and picrosirius red histology images of normal ovarian tissue (c and d) and malignant ovarian tissue (e and f). 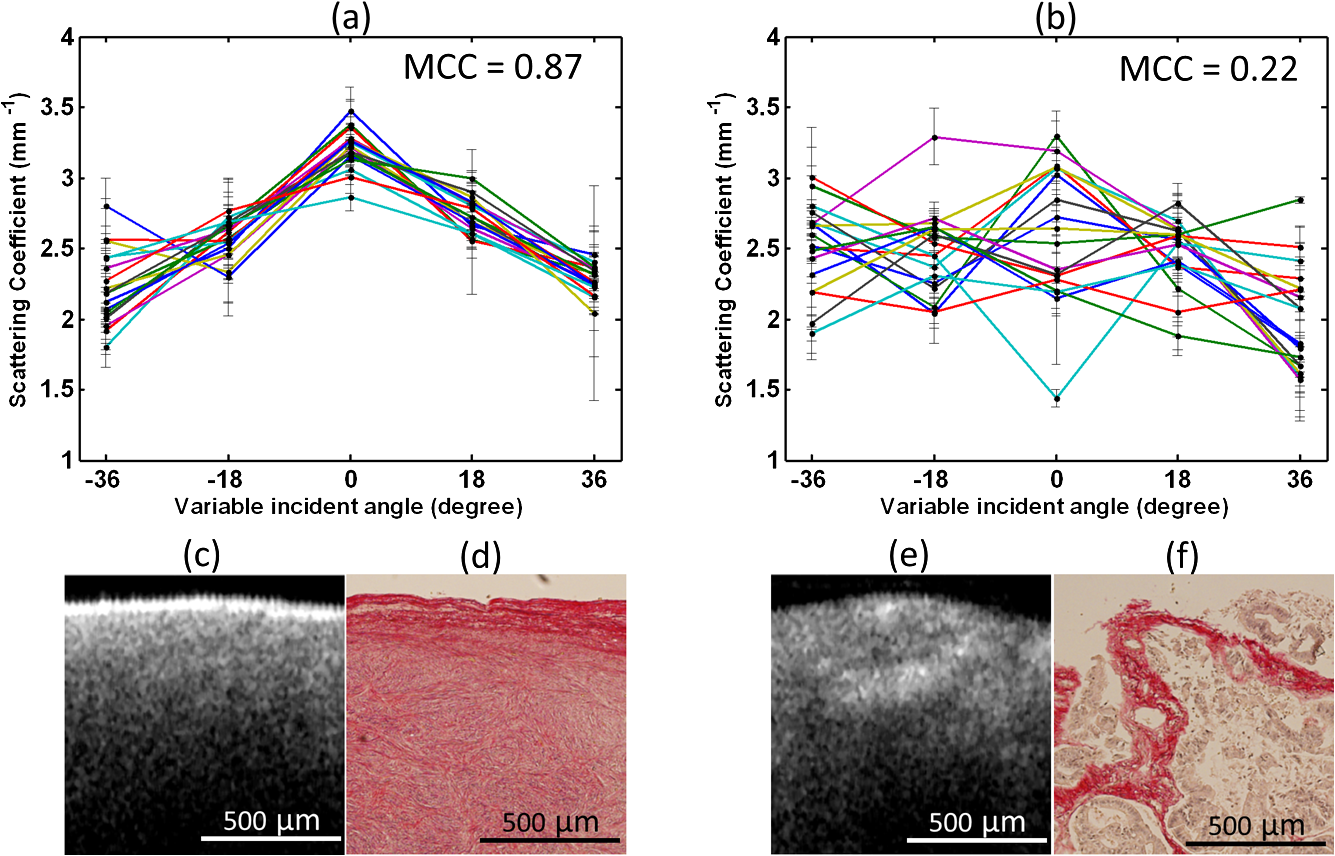 For the 10 ovaries studied, they are classified into normal, , and malignant, , categories based on pathology. The MCC value for each ovary was calculated. The scatter plot in Fig. 3(a) shows the MCC value of each ovary for normal and malignant groups, respectively. The blue star represents the normal ovary while the red circle indicates malignant ovary. These two groups are well separated by setting the threshold of MCC at 0.6. Using it as a classifier, a specificity of 100 percent and a sensitivity of 100 percent are achieved. The average values of MCC of each ovary for normal and malignant groups, along with their standard deviations, are shown in Fig. 3(b). The Student’s -test shows a statistically significant difference between normal, , , and malignant, , , groups with a value . Note that these results were obtained from a limited sample population. The accuracy needs to be further validated in a larger sample pool. Recent studies13–15 have demonstrated that the polarization property of collagen fibers may significantly affect the estimated scattering coefficient in biological tissue. Further investigation on this subject is needed in future studies. Fig. 3(a) Scatter plot of mean cross correlation coefficient (MCC) of each ovary for normal and malignant ovary groups. (b) Statistics of normal (: , ) and malignant groups (: , ).  In this pilot study, five various illumination angles were obtained by rotating the OCT fiber and 18 OCT imaging planes were obtained by rotating the sample. By integrating light illumination at various angles over different OCT imaging planes in one scanning mechanism and keeping the sample still, this technique could easily be utilized for in vivo biopsy. 4.SummaryIn this report, scattering properties of normal and malignant ovarian tissue were quantitatively studied by analyzing the cross correlation of angle-resolved scattering coefficients between different OCT imaging planes. Mean cross correlation coefficient was introduced, in this pilot study, to characterize and differentiate normal and malignant ovaries. A specificity of 100 percent and a sensitivity of 100 percent were achieved by setting a MCC threshold at 0.6 in this limited sample population. The different collagen characteristics effectively explain the different scattering properties in normal and malignant ovaries. AcknowledgmentsWe would like to thank Dr. Melinda Sanders, Xiaohong Wang, and Tim Greenwood at Anatomic Pathology Department of the University of Connecticut Health Center for helping with the ovary pathology report and samples. This research was partially supported by the National Cancer Institute 1R01CA151570 and Donaghue Medical Research Foundation. ReferencesA. Jemalet al.,
“Cancer statistics, 2008,”
CA Cancer J. Clin., 58
(2), 71
–96
(2008). http://dx.doi.org/10.3322/CA.2007.0010 CAMCAM 0007-9235 Google Scholar
D. Arifleret al.,
“Light scattering from collagen fiber networks micro-optical properties of normal and neoplastic stroma,”
Biophys. J., 92
(9), 3260
–3274
(2007). http://dx.doi.org/10.1529/biophysj.106.089839 BIOJAU 0006-3495 Google Scholar
Y. Yanget al.,
“Potential role of a hybrid intraoperative probe for ovarian cancer detection and characterization,”
Biomed. Opt. Express, 2
(7), 1918
–1930
(2011). http://dx.doi.org/10.1364/BOE.2.001918 BOEICL 2156-7085 Google Scholar
M. A. Breweret al.,
“Imaging of the ovary,”
Technol. Cancer Res. Treat., 3
(6), 617
–627
(2004). TCRTBS 1533-0346 Google Scholar
A. Waxet al.,
“Measurement of angular distributions by use of low-coherence interferometry for light-scattering spectroscopy,”
Opt. Lett., 26
(6), 322
–324
(2001). http://dx.doi.org/10.1364/OL.26.000322 OPLEDP 0146-9592 Google Scholar
N. Terryet al.,
“Detection of intestinal dysplasia using angle-resolved low coherence interferometry,”
J. Biomed. Opt., 16
(10), 106002
(2011). http://dx.doi.org/10.1117/1.3631799 JBOPFO 1083-3668 Google Scholar
D. K. Kasaragodet al.,
“Comparative study of the angle-resolved backscattering properties of collagen fibers in bovine tendon and cartilage,”
J. Biomed. Opt., 16
(8), 080501
(2011). http://dx.doi.org/10.1117/1.3606564 JBOPFO 1083-3668 Google Scholar
P. H. Tomlinset al.,
“Theory, developments, and applications of optical coherence tomography,”
J. Phys. D, 38
(15), 2519
–2535
(2005). http://dx.doi.org/10.1088/0022-3727/38/15/002 JPAPBE 0022-3727 Google Scholar
D. J. Faberet al.,
“Quantitative measurement of attenuation coefficients of weekly scattering media using optical coherence tomography,”
Opt. Express, 12
(19), 4353
–4365
(2004). http://dx.doi.org/10.1364/OPEX.12.004353 OPEXFF 1094-4087 Google Scholar
D. P. Popescuet al.,
“Assessment of early demineralization in teeth using the signal attenuation in optical coherence tomography,”
J. Biomed. Opt., 13
(5), 054053
(2008). http://dx.doi.org/10.1117/1.2992129 JBOPFO 1083-3668 Google Scholar
Y. Yanget al.,
“Optical scattering coefficient estimated by optical coherence tomography correlates with collagen content in ovarian tissue,”
J. Biomed. Opt., 16
(9), 090504
(2011). http://dx.doi.org/10.1117/1.3625247 JBOPFO 1083-3668 Google Scholar
Y. Yanget al.,
“Integrated optical coherence tomography, ultrasound and photoacoustic imaging for ovarian tissue characterization,”
Biomed. Opt. Express, 2
(9), 2551
–2561
(2011). http://dx.doi.org/10.1364/BOE.2.002551 BOEICL 2156-7085 Google Scholar
W. Gaoet al.,
“Measuring retinal contributions to the optical Stiles-Crawford effect with optical coherence tomography,”
Opt. Express, 16
(9), 6486
–6501
(2008). http://dx.doi.org/10.1364/OE.16.006486 OPEXFF 1094-4087 Google Scholar
B. Censeet al.,
“Retinal imaging with polarization-sensitive optical coherence tomography and adaptive optics,”
Opt. Express, 17
(24), 21634
–21651
(2009). http://dx.doi.org/10.1364/OE.17.021634 OPEXFF 1094-4087 Google Scholar
Y. Yanget al.,
“Quantitative analysis of scattering coefficient and phase retardation for ovarian tissue characterization,”
Biomed. Opt. Express, 3
(7), 1548
–1556
(2012). http://dx.doi.org/10.1364/BOE.3.001548 BOEICL 2156-7085 Google Scholar
|