|
|
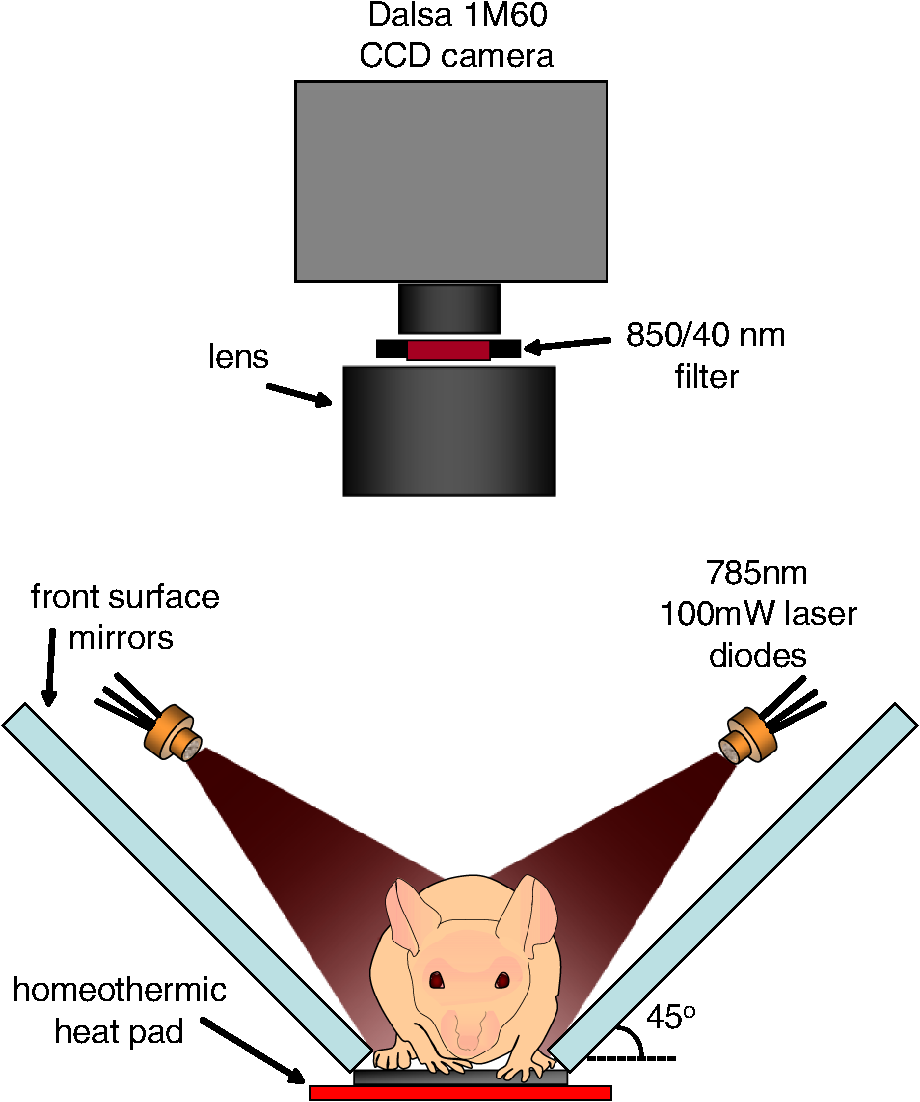
1.IntroductionSmall animal molecular imaging has provided significant advances for in vivo research.1–4 Optical methods for imaging small animals have the benefit of being inexpensive and simple to use compared to other modalities. However, light scattering and attenuation in vivo can make longitudinal extraction of quantitative information from optical images highly challenging. The goal of this work is to investigate metrics that can be obtained from in vivo small animal optical imaging data that can provide robust and valuable measures for disease research and the development of therapeutics. A wide range of optical contrast agents have been developed in recent years, with a major focus on molecular specificity to enable labeling of particular cell types or disease processes.5–8 However, in addition to static imaging of such targeted optical contrast agents, we note that the in vivo dynamics of contrast agents can reflect more than just tissue perfusion status. The dynamics of contrast agents that interact with tissues on a cellular level can provide information about cellular binding or clearance kinetics, yielding imaging contrast that is highly sensitive to cellular function. Exploiting dynamics can also overcome some of the constraints of longitudinally varying attenuation and scattering that typically degrade the utility of static optical intensity measurements alone. We therefore hypothesized that capturing the organ-specific dynamics of a dye that interacts directly with the cells of a specific organ would allow quantitative assessment of that organ’s function, and that this approach could be implemented for longitudinal assessment of small animals for disease and pharmacological research. In this paper, we demonstrate that so-called dynamic contrast-enhanced small animal optical imaging (DyCE) can be used to longitudinally and noninvasively assess liver function in mice with induced, transient liver damage. The liver is a particularly important organ since it performs a vast array of functions and serves as the primary site of drug metabolism in the body. As a result, many drugs may adversely affect liver function, and drug-induced hepatotoxicity is the primary cause of acute liver failure in the United States, often resulting in liver transplantation or death.9,10 Hepatotoxicity is also the leading cause for FDA-approved drugs to be withdrawn from market. Improved techniques for assessing hepatotoxicity during preclinical studies are needed. Liver function is most commonly assessed using biochemical tests, which identify particular proteins released into the blood stream by damaged hepatocytes.11 However, such tests require repeated blood draws, which can be problematic in mice.11 Such measurements also only provide a systemic indication of impaired liver function, and cannot localize liver damage to specific locations within the liver. The alternative is to sacrifice animals for histological examination of the liver; however, this approach increases study time, costs, and animal numbers, while not allowing for repeat assessment of the same animal. Improved, longitudinal assessment of hepatic function in small animals could allow earlier determination of the effects of agents and therapies on hepatic function. DyCE following intravenous injection of indocyanine green (ICG) was previously shown to be able to generate noninvasive anatomical maps in mice by taking advantage of the dye’s characteristic uptake and washout rates in different organs.12 Here, we exploit the fact that ICG binds to albumin and is actively cleared by the liver in a manner that reflects physiologically important liver function. In fact, assessment of the liver uptake rate of ICG is clinically approved for assessment of liver function.13–15 In humans, repeated peripheral blood draws are made to evaluate the amount of residual ICG that the liver has yet to remove from the blood stream.16 In rabbits, studies of the hepatic dynamics of ICG have been performed by placing a fiber-optic probe directly onto the exposed liver.17 We therefore hypothesized that DyCE-based imaging of ICG dynamics in healthy and abnormal livers of mice could allow noninvasive, longitudinal quantification of liver function. In this study, we utilized DyCE to perform high-speed imaging of ICG dynamics in multiple organs simultaneously over nine days before and after induction of transient liver damage using intraperitoneal (IP) injection of carbon tetrachloride (), a well-established hepatotoxin. We demonstrate that DyCE can indeed be used to extract quantitative measures of organ function in vivo. 2.Materials and Methods2.1.DyCE Imaging and Measurement ProtocolsA schematic of our DyCE imaging system is shown in Fig. 1. This simple set-up includes two 785-nm, 100 mW laser diodes (Thorlabs L785P100 with LDC205C controllers) positioned on either side of the mouse for illumination, two front-surface gold mirrors positioned at 45 deg to capture orthogonal views of the mouse, a emission filter to block excitation light (Thorlabs FB850-40), and a Dalsa 1M60 camera controlled with custom software.18 Images were acquired at 10 Hz with binning () and a 90 ms integration time. To acquire DyCE data, mice were first anesthetized using isoflurane (2.5% to 3% in a oxygen:air mix). Once stable and positioned in the prone position on a homeothermic heating pad on the DyCE imaging platform, a latex glove filled with warm water was placed onto the tail for 1 to 2 min to dilate the tail veins. Image acquisition was then started, and a bolus injection of approximately 0.06 ml of 260 μM ICG (Sigma-Aldrich Fluka Analytical Cardiogreen 21980) was injected smoothly into the tail vein within 1 to 2 s. DyCE images were then acquired in sets of 180 s for up to 14 min. For longitudinal measurements, a batch of 260 μM ICG was prepared before the first imaging session and used for each subsequent imaging session. Between imaging sessions the ICG was stored 4°C. To induce liver damage, mice received a single IP injection of body weight of carbon tetrachloride () (as 0.05 ml in corn oil). is an organic solvent, historically employed as a dry-cleaning agent until its use was discontinued due to its significant hepatotoxic effects. Liver damage in mice is rapidly induced via IP injection of . A single exposure causes a disruption of hepatocellular function within 12 to 24 h, with recovery in 48 to 72 h. Prolonged treatment with or chronic exposure can lead to liver fibrosis and eventually cirrhosis.19,20 Seven SKH1 male nude mice () were used in two cohorts. The first cohort (3 mice) was used to determine the repeatability of DyCE measurements and to observe the acute effects of within the first 28 h after injection. The second cohort (4 mice) was used to study the evolution of DyCE measurements during nine days following injection of . In every imaging session in the second cohort, 40 to 60 μL of blood was collected from the tail veins following data acquisition and processed immediately to extract plasma by centrifugation. Plasma was stored at until all samples were collected, and was then analyzed for ALT using the Genzyme Diagnostics ALT Aminotransferase-SL Assay. All procedures were reviewed and approved by the Columbia University IACUC. 2.2.Data PreprocessingThe first step in processing the acquired images was to remove the impact of breathing motions. Breathing causes the internal organs to shift, meaning that time courses extracted from specific pixels can show artifactual intensity changes. Since mice anesthetized under isoflurane take fairly infrequent and sharp out-in breaths, we have found that simply identifying and removing frames during which the mouse takes a breath and interpolating the time-course of each pixel to fill the missing frames is simple and effective.21 There are a number of ways to analyze DyCE data sets. Our previous work used nonnegative least-squares fitting, or principal component analysis (PCA) to generate anatomical maps.12 Here, we generate simple anatomical maps by merging specific image frames from the dynamic data set corresponding to 2.4, 5.2, and 35 s following dye injection. In well-controlled experiments in healthy animals, we have found that these frames correspond to the times when the dye is primarily in the lungs, kidney and brain, and liver respectively. These frames, when color-coded green, blue, and red and then merged to form an RGB image, yield anatomical maps as shown in Figs. 2(a) and 3(a). Additional organs can be distinguished from areas where these three colors overlap. While these maps could be more detailed, this simple and objective analysis allows reliable selection of regions for extraction of the dye’s biodistribution dynamics in the liver and kidney, as well as the brain, lungs, spleen, spine, small intestine and skin. Fig. 2DyCE analysis in mice before and after induced liver damage. (a) Pseudo-colored simple anatomical map images generated using merged frames at 2.4 s (green), 5.2 s (blue), and 35 s (red) after ICG injection with manually selected ROIs overlaid. (b) Time courses of selected regions in healthy mice showing good repeatability. Plot to right shows averages with standard error, normalized to the maximum kidney intensity. (c) Liver and kidney time courses 28 h after mice 1 and 2 received an IP injection of to induce acute liver damage. Right: averages of treated mice with standard error, normalized to the maximum kidney intensity. Arrows indicate crossover point of liver and kidney signal. Traces in treated animals no longer cross within 40 s.  Fig. 3Quantification of the changes seen after injection. (a) DyCE data following ICG bolus injection in a mouse before (left) and 54 h after injection (right), after removal of breathing artifacts. The post- mouse has decreased signal in the liver and increased signal in the kidney after 180 s (Video 1). (b) The average time courses for the liver and kidney (using organ-specific ROIs) before and 54 h after injection in the same mouse (normalized to maximum kidney intensity in each case). Dotted line shows 180 s time point. (c) The liver signal to kidney signal ratio before and 54 h after injection. (Video 1, MPG, 1.8 MB) [URL: http://dx.doi.org/10.1117/1.JBO.17.9.XXXXXX.1.]  3.Results3.1.Repeatability in Healthy MiceIn the first cohort, three healthy 6-week old mice each received a 0.06 ml bolus of 260 μM ICG via tail vein injection and were imaged using DyCE. Figure 2(a) shows the manually selected regions of interest (ROIs) for 8 major organs of each mouse on a pseudocolored anatomical map generated as described above. Figure 2(b) shows the time courses from these regions prior to injection for the three mice. The mean average of these traces, and their standard errors (right) demonstrate the robust repeatability of these measurements across mice. As expected from vascular anatomy, ICG is first apparent in the lungs, followed by the brain and kidneys. The early peak seen in all time-courses corresponds to the first pass of the bolus through the vasculature, and is sharper if the complete bolus was injected in a shorter time. The liver time-course follows a very different shape to the other organs, demonstrating that uptake of ICG by hepatocytes begins rapidly and dominates the liver’s signal. Since ICG is exclusively eliminated from the body via the liver, as the ICG is sequestered by hepatocytes, the liver signal builds, while the signal decreases across all the other organs. After 24 h, we noted that no ICG was detectable in the mouse, and that measurements could be repeated. Two of the mice from this cohort subsequently received an IP injection of . Figure 2(c) shows the changes that occurred 28 h after injection compared to the control. The damaged livers show a slower rate of signal increase compared to the healthy livers. There is also a change in the dynamics of the ICG signal in the kidneys of the mice that received , with the signal continuing to increase at later times rather than quickly reaching a plateau or decreasing. These traces demonstrate that ICG dynamics in organs other than the liver and kidneys are largely unaffected by injection. 3.2.DyCE During Liver RecoveryThe second cohort of mice consisted of four 6-week old mice () that were used to quantify the recovery of the liver after damage. The mice were all imaged initially using DyCE, and then three received IP injections of . All four mice were subsequently imaged at 54, 120, and 217 h after injection. Image acquisition was extended to 10 to 14 min after bolus injection of ICG to capture measures of both liver uptake and clearance. Blood samples were obtained from the tail vein for ALT analysis after each imaging session. The changes in organ-specific time courses extracted from the second cohort after injection were similar to the changes seen in the first cohort; ICG uptake in the liver was slower in the mice injected with while the maximum signal seen in the kidneys was higher compared to other organs. Figure 3(a) shows frames at extracted from supplemental movie (Video 1), which shows the (breathing-corrected) dynamics of ICG in the same mouse before, and 54 h after injection. At , the difference in the relative signal from ICG in the liver and kidneys before and after injection is clear. As the mice recovered over the following days, the dynamics in the liver and kidneys became more similar to the control. To obtain a quantitative measure of these trends, we analyzed acquired data by averaging signal over an ROI that covered most of the signal area of the organ in question. This ROI was defined by performing a nonnegative least-squares fit to basis time courses from each organ [as shown in Fig. 2(b)], which yields maps delineating each organ based on the similarity of each pixel’s time course. The maps generated for the kidneys and liver were then thresholded to generate an ROI from which to extract an averaged temporal signature for each of these organs. Figure 3(b) shows representative extended time courses for the liver and kidneys before and after . The results from our first cohort indicated that led to a reduction in ICG uptake in the liver, and a persistence of ICG in the kidneys. We found that the ratio of liver signal to kidney signal yielded a robust representation of this relationship, as shown in Fig. 3(c). The slope of this ratio varied substantially after injection and recovery. We quantified the reciprocal of this slope as our ‘Dynamic coefficient’ (Dc) where: Figure 4(a) plots Dc as a function of hours post- administration, and shows remarkable agreement with the ALT assay results shown in Fig. 4(b). Mouse 7 demonstrated the most pronounced increase in Dc and also had the highest ALT level at 54 h. Mouse 4 had the lowest apparent response in both measures. A linear regression on ALT measurements versus Dc from the control mouse can be seen in Fig. 4(c) and yields an value of 0.91. Fig. 4Comparison of DyCE measures to liver enzyme concentrations during transient liver damage. (a) DyCE-derived dynamic coefficient (Dc). (b) Alanine aminotransferase (ALT) measurements from blood samples taken during each imaging session. IP injections of to induce liver damage were given immediately following the first imaging session. Mice were then imaged 3 more times each over the following 217 h. (c) Larger Dc values correlate with higher levels of plasma ALT. The third time point for mouse 4 was not obtained owing to failed injection. A linear fit applied to the Dc and ALT data gives an value of 0.91.  4.DiscussionDyCE has been demonstrated previously to be effective for anatomical co-registration,12,22 and more recently for differentiating tumor cells from normal tissue,23 monitoring antiangiogenic tumor treatments,24 and evaluating the biodistribution of novel contrast agents.22 We have now shown that DyCE also has the potential to provide high-throughput, inexpensive, noninvasive and longitudinal assessment of liver function in small animals as an alternative to animal necropsy and histology. Our results further suggest that DyCE might be able to evaluate function in a range of different organs through the design of contrast agents that functionally interact with specific cell types. There are many other ways in which temporal measurements can be extracted from DyCE data to provide measures of organ function. Several previous studies using ICG, methylene blue and conjugated photosensitizers have applied pharmacokinetic analysis to optical data to resolve differences in tumor extravasation and uptake dynamics, and to distinguish tumor from normal tissue.25,26 In our case, Dc was selected as a simple metric that quantifies the way in which ICG is removed from the blood stream by the liver and transiently binds to the kidney, features noted to change with liver damage in the data from the first cohort of mice. The fact that Dc is sensitive to both the liver and kidney responses can be seen as an advantage, in that it exploits the interrelation between these organs, providing a more robust self-normalizing measure that is independent of overall dye concentration. However, it is also true that other types of liver damage could affect the kidney signal differently and therefore might need a different calibration with respect to ALT. Similarly, methods for quantifying the function of other organs would need to be individually investigated and calibrated. We note also that DyCE techniques need not be limited to intravenous bolus injection of a contrast agent, which can be challenging. DyCE could also be achieved following IP injection, or even oral or inhaled administration of contrast. Contrast dynamics could also be induced via administration of an activating agent (as in the case of bioluminescence imaging), or via a modulation such as a systemic temperature, blood pressure, or blood-oxygen level change. The DyCE results presented here also provide insights for clinical dynamic imaging of organ function. Dynamic contrast magnetic resonance imaging (DCE-MRI) and perfusion x-ray computed tomography (perfusion-CT) are both used clinically. However, previous perfusion CT studies using the iodine-based intravascular contrast agent, Iohexol, found no correlation between hepatic blood flow parameters and ALT levels in tumor patients undergoing chemotherapy.27 We believe that the difference in our results is that our measurements of ICG dynamics directly probed the ability of hepatocytes to take up and process ICG, rather than simply quantifying the level of blood flow in the liver (although we note that perfusion measures can also be obtained from the earliest phase of DyCE measurements where the injected dye is initially within the blood stream). The FDA-approved gadolinium-based MRI contrast agent, Eovist™, is excreted half renally and half hepatically in a similar way to ICG.28,29 The hepatocyte-specific nature of Eovist has been shown to allow for staging of liver fibrosis,30 increased accuracy of determination of central bile duct stenosis in combination with T2-weighted MRI,31 and for distinguishing tumor types.32 Our results suggest that Eovist could be valuable for spatially mapping liver function if data is analyzed in a manner similar to that presented here. In particular, we note that neither DCE-MRI nor perfusion-CT is typically implemented in such a way as to allow comparison of the dynamics of a contrast agent in a combination of organs, such as the liver and kidney together; an approach that could potentially yield new diagnostic information. A range of other ‘targeted’ contrast agents are under development for both MRI and ultrasound imaging.33–35 While there are numerous studies that have used DCE-MRI to obtain tumor information based on vascular differences,36,37 our results suggest that targeted contrast agents that interact directly with tissues could yield significant functional information if combined with dynamic contrast approaches. In summary, we have demonstrated that DyCE can be used to longitudinally evaluate organ function in small animals, both by enabling extraction of dynamics from specific organs via anatomical registration, and by exploiting the cell-specific uptake dynamics of optical contrast agents such as ICG. The high-speed and wide-field imaging capabilities of DyCE, combined with its low cost and simplicity make it a valuable tool for small animal research. DyCE in small animals may also serve as a test-bed for the development of clinical dynamic contrast agents and analysis strategies for capturing quantitative and functional measures related to disease progression and treatment response. AcknowledgmentsWe gratefully acknowledge support from NIH grants 1R43EB008627 (NIBIB), 1U54CA126513 (NCI), R01NS063226, R01NS076628, and R21NS053684 (NINDS), Cambridge Research and Instrumentation (CRi), the National Science Foundation (NSF), and the Human Frontier Science Program. Cyrus Amoozegar is funded through the Columbia MD/PhD office. Matthew B. Bouchard received graduate fellowship funding through both the NSF and NDSEG. We thank Robert Schwabe, Thomas Kruker, Igor Shmarakov, Diana D’Ambrosio, Sheila O’Byrne and Mariel Kozberg for helpful discussions and assistance with animal models and experiments. Conflict of interest disclosure: DyCE technology is licensed to CRi (now part of PerkinElmer) and Dr. Elizabeth Hillman receives royalties for the sale of DyCE-related products. ReferencesV. Ntziachristoset al.,
“Fluorescence molecular tomography resolves protease activity in vivo,”
Nat. Med., 8
(7), 757
–761
(2002). http://dx.doi.org/10.1038/nm729 1078-8956 Google Scholar
W. J. Mulderet al.,
“Molecular imaging of tumor angiogenesis using alphavbeta3-integrin targeted multimodal quantum dots,”
Angiogenesis, 12
(1), 17
–24
(2009). http://dx.doi.org/10.1007/s10456-008-9124-2 0969-6970 Google Scholar
B. W. Reutteret al.,
“Longitudinal evaluation of fatty acid metabolism in normal and spontaneously hypertensive rat hearts with dynamic microSPECT imaging,”
Int. J. Mol. Imaging, 2011 893129
(2011). http://dx.doi.org/10.1155/2011/893129 Google Scholar
N. V. Evgenovet al.,
“In vivo imaging of islet transplantation,”
Nat. Med., 12
(1), 144
–148
(2006). http://dx.doi.org/10.1038/nm1316 1078-8956 Google Scholar
V. Ntziachristoset al.,
“Visualization of antitumor treatment by means of fluorescence molecular tomography with an annexin V-Cy5.5 conjugate,”
PNAS, 101
(33), 12294
–12299
(2004). BCCHES Google Scholar
A. HellebustR. Richards-Kortum,
“Advances in molecular imaging: targeted optical contrast agents for cancer diagnostics,”
Nanomedicine, 7
(3), 429
–445
(2012). Google Scholar
B. A. Smithet al.,
“Optical imaging of mammary and prostate tumors in living animals using a synthetic near infrared zinc(II)-dipicolylamine probe for anionic cell surfaces,”
J. Am. Chem. Soc., 132
(1), 67
–69
(2010). http://dx.doi.org/10.1021/ja908467y JACSAT 0002-7863 Google Scholar
C. Ranet al.,
“Design, synthesis, and testing of difluoroboron-derivatized curcumins as near-infrared probes for in vivo detection of amyloid-beta deposits,”
J. Am. Chem. Soc., 131
(42), 15257
–15261
(2009). http://dx.doi.org/10.1021/ja9047043 JACSAT 0002-7863 Google Scholar
W. M. Lee,
“Drug-induced hepatotoxicity,”
N. Engl. J. Med., 349
(5), 474
–485
(2003). http://dx.doi.org/10.1056/NEJMra021844 NEJMAG 0028-4793 Google Scholar
V. J. NavarroJ. R. Senior,
“Drug-related hepatotoxicity,”
N. Engl. J. Med., 354
(7), 731
–739
(2006). http://dx.doi.org/10.1056/NEJMra052270 NEJMAG 0028-4793 Google Scholar
R. JalanP. C. Hayes,
“Review article: quantitative tests of liver function,”
Aliment Pharmacol. Ther., 9
(3), 263
–270
(1995). http://dx.doi.org/10.1111/j.1365-2036.1995.tb00380.x 0269-2813 Google Scholar
E. M. C. HillmanA. Moore,
“All-optical anatomical co-registration for molecular imaging of small animals using dynamic contrast,”
Nat. Photonics, 1
(9), 526
–530
(2007). http://dx.doi.org/10.1038/nphoton.2007.146 1749-4885 Google Scholar
M. E. Gottliebet al.,
“Indocyanine green. Its use as an early indicator of hepatic dysfunction following injury in man,”
Arch. Surg., 119
(3), 264
–268
(1984). http://dx.doi.org/10.1001/archsurg.1984.01390150006002 0004-0010 Google Scholar
C. M. Leevyet al.,
“Indocyanine green clearance as a test for hepatic function. Evaluation by dichromatic ear densitometry,”
JAMA, 200
(3), 236
–240
(1967). http://dx.doi.org/10.1001/jama.1967.03120160102016 JAMAAP 0098-7484 Google Scholar
S. KeidingC. Skak,
“Methodological limitations of the use of intrinsic hepatic clearance of ICG as a measure of liver cell function,”
Eur. J. Clin. Invest., 18
(5), 507
–511
(1988). http://dx.doi.org/10.1111/j.1365-2362.1988.tb01048.x EJCIB8 1365-2362 Google Scholar
S. Kawasakiet al.,
“Pharmacokinetic study on the hepatic uptake of indocyanine green in cirrhotic patients,”
Am. J. Gastroenterol., 80
(10), 801
–806
(1985). AJGAAR 0002-9270 Google Scholar
A. El-Desokyet al.,
“Experimental study of liver dysfunction evaluated by direct indocyanine green clearance using near infrared spectroscopy,”
Br. J. Surg., 86
(8), 1005
–1011
(1999). http://dx.doi.org/10.1046/j.1365-2168.1999.01186.x BJSUAM 0007-1323 Google Scholar
M. B. Bouchardet al.,
“Ultra-fast multispectral optical imaging of cortical oxygenation and blood flow dynamics,”
Optics Express, 17
(18), 15670
–15678
(2009). http://dx.doi.org/10.1364/OE.17.015670 OPEXFF 1094-4087 Google Scholar
T. F. Slater,
“Free radicals and tissue injury: fact and fiction,”
Br. J. Cancer, 55
(Suppl. 8), 5
–10
(1987). 0306-9443 Google Scholar
R. O. Recknagel,
“Mechanisms of carbon tetrachloride toxicity,”
Pharmacol. Ther., 43
(1), 139
–154
(1989). http://dx.doi.org/10.1016/0163-7258(89)90050-8 0163-7258 Google Scholar
E. M. C. Hillmanet al.,
“In vivo optical imaging and dynamic contrast methods for biomedical research,”
Phil. Trans. R. Soc. A., 369
(1955), 4620
–4643
(2011). http://dx.doi.org/10.1098/rsta.2011.0264 Google Scholar
K. WelsherS. P. SherlockH. Dai,
“Deep-tissue anatomical imaging of mice using carbon nanotube fluorophores in the second near-infrared window,”
Proc. Natl. Acad. Sci. USA, 108
(22), 8943
–8948
(2011). http://dx.doi.org/10.1073/pnas.1014501108 1091-6490 Google Scholar
H. Zhouet al.,
“Dynamic near-infrared optical imaging of 2-deoxyglucose uptake by intracranial glioma of athymic mice,”
PLoS ONE, 4
(11), e8051
(2009). http://dx.doi.org/10.1371/journal.pone.0008051 1932-6203 Google Scholar
J. Leeet al.,
“Monitoring of anti-angiogenic drug response with dynamic fluorescence imaging,”
in Proc. of the 2010 IEEE 36th Annual Northeast Bioengineering Conf.,
(2010). Google Scholar
D. J. Cucciaet al.,
“In vivo quantification of optical contrast agent dynamics in rat tumors by use of diffuse optical spectroscopy with magnetic resonance imaging coregistration,”
Appl. Opt., 42
(16), 2940
–2950
(2003). http://dx.doi.org/10.1364/AO.42.002940 APOPAI 0003-6935 Google Scholar
M. Gurfinkelet al.,
“Pharmacokinetics of ICG and HPPH-car for the detection of normal and tumor tissue using fluorescence, near-infrared reflectance imaging: a case study,”
Photochem. Photobiol., 72
(1), 94
–102
(2000). http://dx.doi.org/10.1562/0031-8655(2000)072<0094:POIAHC>2.0.CO;2 PHCBAP 0031-8655 Google Scholar
Q. Zhanget al.,
“Perfusion CT findings in liver of patients with tumor during chemotherapy,”
World J. Gastroenterol., 16
(25), 3202
–3205
(2010). http://dx.doi.org/10.3748/wjg.v16.i25.3202 1007-9327 Google Scholar
G. Schuhmann-Giampieriet al.,
“Pharmacokinetics of the liver-specific contrast agent Gd-EOB-DTPA in relation to contrast-enhanced liver imaging in humans,”
J. Clin. Pharmacol., 37
(7), 587
–596
(1997). JNDRAK 0091-2700 Google Scholar
M. K. Sealeet al.,
“Hepatobiliary-specific MR contrast agents: role in imaging the liver and biliary tree,”
Radiographics, 29
(6), 1725
–1748
(2009). http://dx.doi.org/10.1148/rg.296095515 0271-5333 Google Scholar
H. Watanabeet al.,
“Staging hepatic fibrosis: comparison of gadoxetate disodium-enhanced and diffusion-weighted MR imaging—preliminary observations,”
Radiology, 259
(1), 142
–150
(2011). http://dx.doi.org/10.1148/radiol.10100621 RADLAX 0033-8419 Google Scholar
K. I. Ringeet al.,
“Characterization and staging of central bile duct stenosis-Evaluation of the hepatocyte specific contrast agent gadoxetate disodium,”
Eur. J. Radiol.,
(2012). http://dx.doi.org/10.1016/j.ejrad.2012.03.030 EJRADR 0720-048X Google Scholar
A. S. Puryskoet al.,
“Characteristics and distinguishing features of hepatocellular adenoma and focal nodular hyperplasia on gadoxetate disodium-enhanced MRI,”
AJR Am. J. Roentgenol., 198
(1), 115
–123
(2012). http://dx.doi.org/10.2214/AJR.11.6836 0361-803X Google Scholar
T. L. Kalberet al.,
“A low molecular weight folate receptor targeted contrast agent for magnetic resonance tumor imaging,”
Mol. Imaging Biol., 13
(4), 653
–662
(2011). http://dx.doi.org/10.1007/s11307-010-0400-3 1536-1632 Google Scholar
A. J. Lubaget al.,
“Noninvasive MRI of beta-cell function using a -responsive contrast agent,”
Proc. Natl. Acad. Sci. USA, 108
(45), 18400
–18405
(2011). http://dx.doi.org/10.1073/pnas.1109649108 0370-0046 Google Scholar
C. R. Andersonet al.,
“Ultrasound molecular imaging of tumor angiogenesis with an integrin targeted microbubble contrast agent,”
Invest. Radiol., 46
(4), 215
–224
(2011). http://dx.doi.org/10.1097/RLI.0b013e3182034fed INVRAV 0020-9996 Google Scholar
S. Nosas-Garciaet al.,
“Dynamic contrast-enhanced MRI for assessing the disease activity of multiple myeloma: a comparative study with histology and clinical markers,”
J. Magn. Reson. Imaging, 22
(1), 154
–162
(2005). http://dx.doi.org/10.1002/(ISSN)1522-2586 1053-1807 Google Scholar
A. Banerjiet al.,
“DCE-MRI model selection for investigating disruption of microvascular function in livers with metastatic disease,”
J. Magn. Reson. Imaging, 35
(1), 196
–203
(2012). http://dx.doi.org/10.1002/jmri.v35.1 1053-1807 Google Scholar
|