
|
|
1.IntroductionVoltage-sensitive dyes, characterized by fast and linear response to membrane potential, are widely used to assess membrane potentials and to determine spatial distribution of the membrane potential within single cells and multicellular preparations.1,2 In cardiac research, this method, known as optical mapping, has been especially valuable for the investigation of cardiac arrhythmias. Most voltage-sensitive fluorescent dyes are excited in a blue-green spectral range and emit in the orange-red part of the spectrum. The emergence of new applications of optical mapping involving three-dimensional tomographic imaging inside myocardial tissue,3,4 as well as potential clinical applications involving epicardial and endocardial (endoscopic) mapping in intact, blood-perfused hearts,5,6 motivated the development of novel near-infrared (NIR) voltage-sensitive probes.7–9 Such probes can be excited in the red range of the spectrum, in which light scattering and absorption of natural tissue chromophores and hemoglobin are significantly reduced, thereby giving the NIR probes a significant advantage over conventional probes with blue-green excitation.8,10 One of the important factors complicating the use of voltage-sensitive dyes is low fractional change in fluorescence in response to voltage changes (), which makes it difficult to achieve high signal-to-noise ratios. This issue becomes particularly important with regard to optical mapping in blood-perfused hearts, when a significant portion of excitation light is absorbed by hemoglobin. The improvement in the signal-to-noise ratio of the voltage dependent signal is usually achieved by increasing the intensity of illumination light. However, such an improvement may come at a price, causing photobleaching and phototoxicity.11–13 The sensitivity of different dyes to increased light varies and should be determined for each dye individually. In this study, we focus on two dyes: di-4-ANBDQBS, one of the recently introduced and most promising NIR dyes,8,9 and di-4-ANEPPS, a widely used cardiac electrophysiology dye with blue-green excitation, whose tolerance to high light intensities has yet to be quantified. We demonstrate that, at the highest illumination intensities tested (), neither dye produces any toxic or phototoxic effects. However, such intensities are large enough to produce noticeable tissue heating, which affects electrophysiological parameters of the myocardium and must be taken into account. The most pronounced effect is a shortening of the action potential duration (APD), which, in the case of 532-nm excitation (di-4-ANEPPS), can reach . At 660-nm excitation (di-4-ANBDQBS), the effect is smaller () but not insignificant enough to be ignored. The information provided in this report will help the development of more efficient optical mapping protocols and the minimization of dye concentration, which is particularly important for potential clinical applications. 2.Methods2.1.Cardiac Tissue Preparation, Perfusion, Staining, and PacingExperiments were performed in isolated right ventricular wall preparations harvested from adult guinea pigs (20 animals, weight 200 to 300 g). All experimental protocols and procedures conformed to the European Community guiding principles and were approved by the State Food and Veterinary Service of the Republic of Lithuania and the Ethics Committee of Lithuanian University of Health Sciences. Before sacrificing, animals were sedated by intraperitoneal injection of sodium pentobarbital () and 500 IU heparin to prevent blood clotting. The heart was quickly excised and rinsed with oxygenated (100% ) Tyrode solution at room temperature. Then the aorta was cannulated, and the heart was connected to a Langendorff perfusion system. After 10 min of equilibration, the heart was stained with a 10-ml bolus of a voltage-sensitive dye dissolved in the Tyrode solution and slowly injected into the aorta. After staining, the heart was disconnected from the Langendorff system, and the right ventricular wall was excised and secured to a rubber frame on the bottom of a specially designed 2-ml flow cuvette. Unless otherwise stated, the temperature of superfusate (oxygenated Tyrode’s solution) and the rate of superfusion were maintained at 36.5°C and , respectively. The temperature of the superfusate was controlled within using a thermostat (170051A Thermo Fisher Scientific, USA). Preparations were continuously paced at 1 Hz via a custom made bipolar stimulus electrode. We used 2-ms square pulses with the amplitude twice the diastolic threshold. The stimuli were generated by a programmable DS8000 stimulator (World Precision Instruments, USA) and delivered through a linear stimulus isolator (A395R, World Precision Instruments, USA). 2.2.SolutionsFor Langendorff perfusion of the whole heart and for superfusion of isolated right ventricular preparations, we used a standard Tyrode solution composed of (in mM): 135 NaCl, 5.4 KCl, , , , 10 glucose, 10 HEPES (pH 7.4 adjusted with NaOH). The bolus dye injections were prepared from stock solutions containing 25 mM di-4-ANBDQBS in ethanol, or 10 mM di-4-ANEPPS in DMSO. The dyes were further dissolved in Tyrode to final concentrations of 50 μM and 25 μM for di-4-ANBDQBS and di-4-ANEPPS, respectively. To facilitate dye loading, 0.01% Pluronic F-127 was added. To eliminate motion artifact, we used 20 μM blebbistatin. The dye di-4-ANBDQBS was provided by Dr. L. Loew (University of Connecticut, USA); di-4-ANEPPS came from Invitrogen, USA; blebbistatin came from Calbiochem, UK; and all other chemicals were from Sigma-Aldrich. 2.3.Illumination ProtocolsFor excitation of di-4-ANBDQBS, we used a continuous-wave, 660-nm, 600-mW diode laser (SDL-660-600T, Shanghai Dream Lasers Technology). To achieve broad field illumination, a 5-mm beam was expanded with a 5-deg holographic diffuser filter (R217582-11165, Edmund Optics, USA). In experiments with di-4-ANEPPS, we used a 532-nm, 1000-mW laser with a 3-mm-wide beam (SDL-532-1000T, Shanghai Dream Lasers Technology). The beam was further expanded with a 20-deg holographic diffuser filter (R176395-10033, Edmund Optics, USA). Illumination intensity was varied using a set of nonreflective neutral density filters (Edmund Optics) and a linear glass polarizing filter (R215402-11139, Edmund Optics, USA). Illumination was calibrated using a power meter (PM100, Thorlabs, USA) and continuously monitored by a custom-made light sensor. Unless stated otherwise, the experimental protocol consisted of consecutive cycles of 60-s illumination followed by 120-s dark periods. The light intensity increased in a stepwise manner from 0.1 to of illumination in each sequential cycle. To assess thermal effects of high-intensity illumination, we used a custom-made thermosensor (diameter: 0.65 mm) pressed to the surface of the preparation inside the illuminated area. The TTL pulses from the stimulator were used to synchronize acquisition of the microelectrode recordings, EMCCD camera, and thermosensor. 2.4.Recording of Optical Action PotentialsOptical action potentials (AP) were recorded with a cooled fast 14-bit EMCCD camera ( DU-860, Andor Technology, Ireland) equipped with a lens (Helios 44, focal length 50 mm, F 2.0, Russia) using imaging software (Andor SOLIS x-3467, UK). Images were acquired at a resolution of with frame rates of 500 Hz. The camera was located about 30 cm from the sample. The recordings were taken from the epicardial surface of the right ventricle. The mapping field was . In experiments with di-4-ANBDQBS, fluorescence was collected using a 715-nm long-pass filter (NT46-066, Edmund Optics, USA). In experiments with di-4-ANEPPS, we utilized a 650-nm bandpass filter (, Chroma Technology, USA). The EM gain of camera, varying from 4 to 100, was used to keep background fluorescence constant and close to saturation level. Acquired images were analyzed using computer software (ImageJ 1.45S and custom Scroll 1.16 software based on PV-Wave). Unless stated otherwise, recordings were subjected to time and space filtering with three-point triangular and pyramidal kernels, respectively. Optical APD was measured at a 50% depolarization level. APD difference maps were generated using Origin 8.6 software. 2.5.Microelectrode RecordingsTo study the effect of increased illumination intensity on unstained tissue, as well to investigate the recovery of electrophysiological parameters during dark periods, we used microelectrode recordings. Glass microelectrodes were filled with 2.5 M KCl and inserted into the tissue to 4 mm away from the pacing electrode. Action potentials were amplified using a MEZ -7101 amplifier (Nihon Kohden, Japan) and digitized by an converter board (Advantech, CA, US) at a frequency of 10 kHz. The data were stored on a personal computer and processed using custom designed software. The following parameters of microelectrode recorded AP were analyzed: amplitude of AP, maximum upstroke velocity (), conduction velocity, and APD. Conduction velocity was calculated by dividing distance between pacing electrode and microelectrode by conduction time. Conduction time was measured as the time from pacing stimulus to the maximum of upstroke velocity. AP duration was estimated as time from the maximum of the first derivative of upstroke to 90% repolarization level (APD90). 2.6.StatisticsData are presented as . The ANOVA test was used for the statistical comparison between experimental data, and differences were considered statistically significant when . Experimental curves were analyzed and fitted using SigmaPlot 2000 (Systat Software Inc., USA) and Origin 8.6 software (OriginLab, USA). 3.ResultsThe increase of illumination intensity from 0.1 to has no significant effect on the fractional change in fluorescence () but noticeably improves the signal-to-noise ratio. Figure 1(a) demonstrates normalized optical APs recorded at progressively increasing illumination intensities in a preparation stained with di-4-ANBDQBS. One can see that, at all levels of intensities, remains around 10%. The observed increase in the signal-to-noise ratio is the result of the increasing signal amplitude, which is proportional to the light intensity, at relatively constant readout noise levels. On average for all intensities, the ratio was for di-4-ANBDQBS () and for di-4-ANEPPS (). Fig. 1(a) Optical action potentials in the guinea pig right ventricle stained with di-4-ANBDQBS at different illumination intensities. Note progressive improvement of the signal-to-noise ratio as the intensity increases from 0.1 to .(b) Superposition of the simultaneous optical (grey line) and microelectrode (black line) recordings at of illumination. The optical signal was recorded from a area. Both recordings are normalized to the action potential amplitude. (c) The view of the optical and microelectrode derived action potential upstroke at increased time resolution.  To evaluate the effect of increased light intensity on electrophysiological characteristics of the heart tissue during and after light exposure, the optical recordings were carried out concurrently with microelectrode recordings. The use of microelectrode recordings not only provided the necessary negative controls in the absence of the dye and/or illumination, but it also enabled us to assess any changes in AP amplitude and the maximum upstroke velocity, which are important electrophysiological parameters that cannot be readily quantified using optical methods. Figure 1(b) shows a superposition of normalized APs recorded optically using di-4-ANBDQBS and with a microelectrode. The shape and the duration of the APs are very similar in both types of recordings. However, the upstroke of the electrically recorded AP is steeper than that of optical AP [see Fig. 1(c)]. The longer upstroke of the optical AP is the result of depth averaging effect14 and thus is not uniquely defined by the electrophysiological characteristics of cardiac tissue. Therefore, to estimate the effects of light intensity on maximal upstroke velocity, we used exclusively microelectrode recordings. To assess photobleaching, we measured the change in the background fluorescence at the beginning and end of a 60-s illumination interval. At the maximum illumination intensity of , the background fluorescence intensity, on average, decreased by () and () for di-4-ANBDQBS and di-4-ANEPPS, respectively. The most pronounced effect the illumination intensity had was on the APD. Figure 2 shows changes in illumination pattern [panels (a) to (c)] and respective optical AP recordings [panel (d)] in one of the preparations. The optical AP recording site is indicated by an asterisk in panels (a) to (c). Initially, when this site is brightly illuminated (intensity in that location ), the action potential is short [see panel (d), trace a]. After the light is moved [panel (b)] and the illumination intensity in this location is decreased to , the optical APD50 increases by as much as 22 ms (trace b). Restoring the illumination intensity to its original value fully restores the APD (trace c). Fig. 2The effect of the changing illumination pattern on the optical APD. (a) Gradient in background fluorescence produced by nonuniform illumination. The brightest area is located near the top of the field of view. (b) The brightest area is shifted to the bottom. (c) Restoration of the initial illumination pattern. The black region masks the area of the temperature sensor. (d) Optical action potential (OAP) recordings from a pixel indicated by an asterisk (traces a to c). The recordings were taken after 60-s equilibration following the change in illumination pattern. The APD is significantly shorter when the light intensity is higher [traces a, b, and c correspond to panels (a), (b), and (c)]. 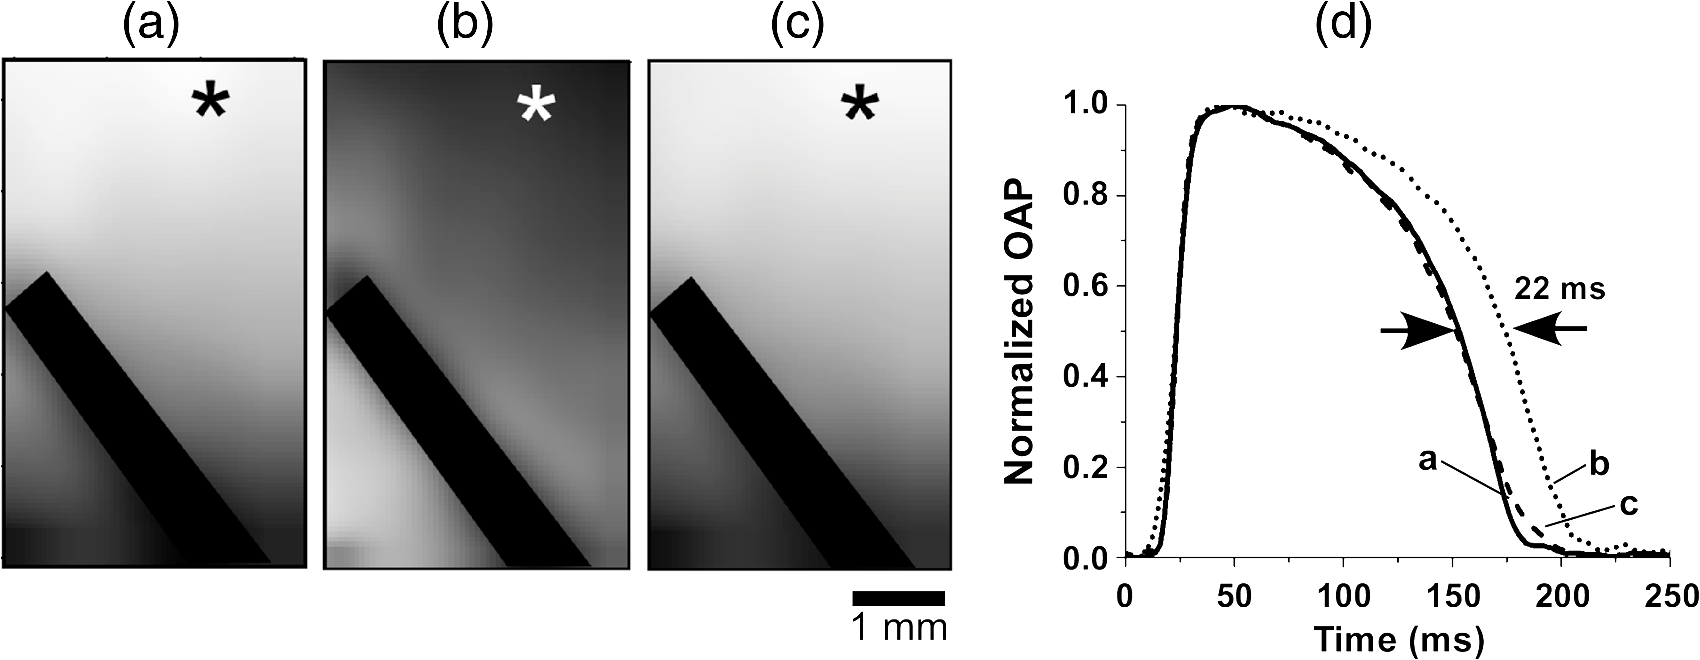 The correlation between the APD and the intensity of illumination was consistent throughout the entire preparation: the higher the light intensity, the shorter the APD. Figure 3 shows maps of changes in optical APD50 (optical ΔAPD map) following the change in the illumination pattern as in Fig. 2. In Fig. 2 panels (a) and (c), the upper part of the field of view is much brighter than the bottom part. Accordingly in both cases, optical ΔAPD reaches 12 to 15 ms in the top part and close to zero in the bottom. Increasing the intensity of illumination near the bottom of the field of view [Fig. 2(b)] results in a more significant shortening of APD at the bottom compared to the less illuminated top [Fig. 3(b)]. Fig. 3The APD shortening maps constructed for the illumination patterns illustrated in Fig. 2. The color maps show optical APD50 difference in milliseconds at the beginning and end of the illumination cycle in each case. Each color corresponds to one of five intervals of a 3-ms duration. Note the striking correlation of the illumination intensity with the degree of APD shortening (compare respective panels in Figs. 2 and 3).  The change in APD in response to change in light intensity does not occur instantaneously. It develops gradually with a time constant of that does not depend on light intensity. Figure 4(a) shows the kinetics of APD90 after turning the laser on and off at different illumination intensities derived from microelectrode recordings. Both “on” and “off” kinetics can be fitted sufficiently well with a single exponential. At and , the rise time constant values are and (), respectively (half times and ). After the laser is turned off, the APD90 returns to its original level with the of and at and , respectively (half times and ). We did not observe any changes in the steady-state APD levels after several on and off cycles. Fig. 4(a) The kinetics of the APD during and after a 60-s interval of constant illumination. Different traces correspond to different light intensities (indicated in the figure legend). In this example, microelectrode recordings were derived from di-4-ANBDQBS stained preparations at 660-nm illumination. (b) Normalized APD in unstained (; 660-nm illumination; empty circles), di-4-ANBDQBS (; 660-nm excitation; black circles) and di-4-ANEPPS (, 532-nm excitation; empty triangles) stained preparations at the end of a 60-s illumination interval at different illumination intensities. 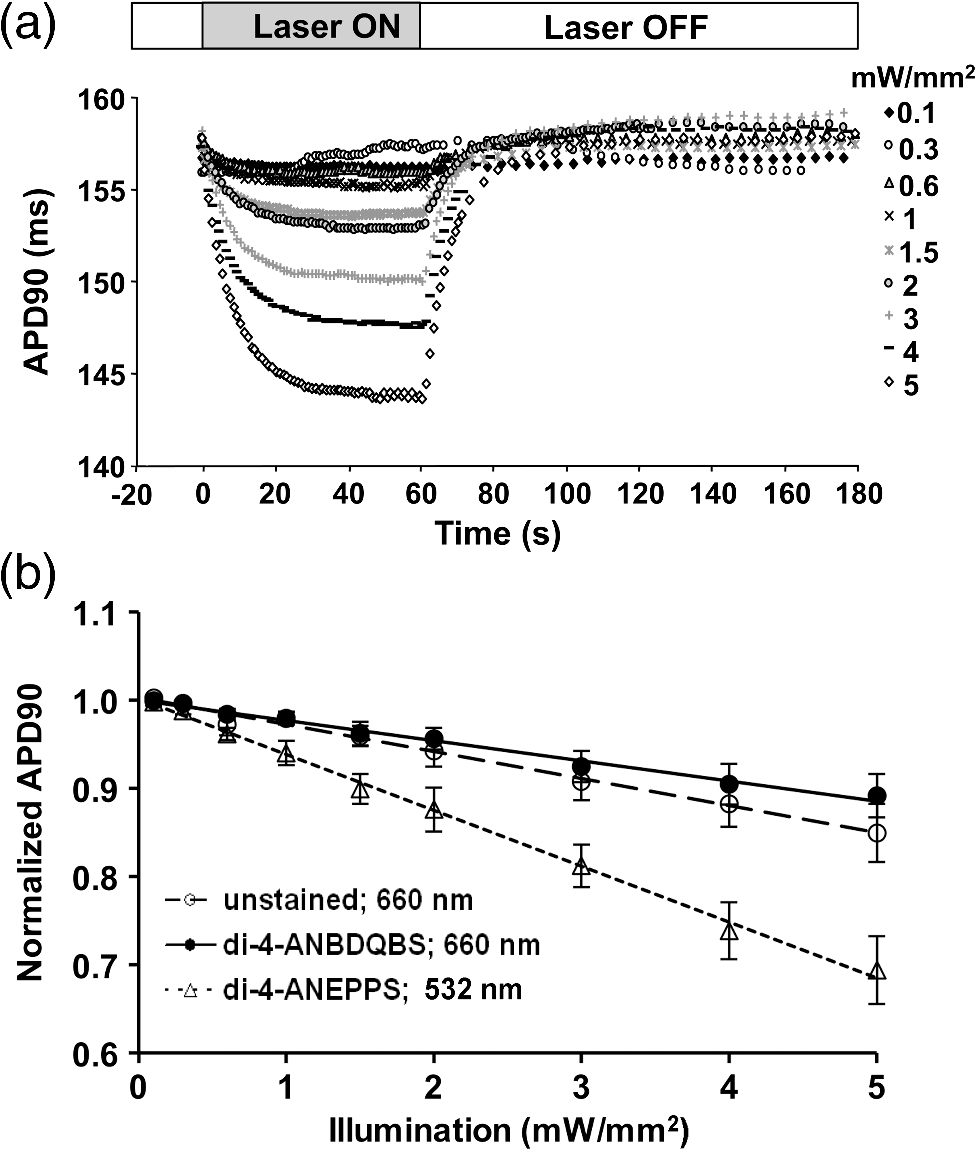 The APD shortening is proportional to the illumination intensity. Figure 4(b) shows the APD at the end of a 60-s illumination cycle as a function of illumination intensity in three different series of experiments: 1. unstained tissues, 660-nm illumination (); 2. di-4-ANBDQBS stained tissue, 660-nm illumination (), and 3. di-4-ANEPPS stained tissue, 532-nm illumination (). In all three cases, the degree of APD shortening is proportional to the intensity of illumination. The shortening was most pronounced at 532-nm illumination with the maximal shortening of compared to the APD in the absence of illumination. It is interesting that the changes in stained and unstained tissues at the same illumination wavelengths (compare dashed and solid lines) are very similar ( and , respectively), which implies that they are not dye-related but are caused by the direct effect of light on tissue. To determine if the illumination-induced APD shortening is caused by phototoxicity-related myocardial damage, we assessed the effect of increased light intensity on three other major electrophysiological parameters: the AP amplitude, the maximal upstroke velocity, and conduction velocity. These parameters are known to be sensitive indicators of the electrophysiological condition of the myocardial tissue. (Myocardial damage is usually characterized by reduction of AP amplitude, upstroke velocity, and the speed of AP propagation). Figure 5 shows the results of these measurements. If high light intensities had induced myocardial damage, our data would show a decline in all three parameters with the intensity increase. However, this is not the case. Only the AP amplitude declines at increased power intensity [Fig. 5(a)]. The maximal upstroke velocity [Fig. 5(b)] and conduction velocity [Fig. 5(c)] both manifest a small but statistically significant increase. The effect is most apparent at 532 nm and is fully reversible. These findings exclude phototoxicity-related tissue damage as the possible cause of light-induced changes of electrophysiological parameters. Fig. 5The dependence of the (a) AP amplitude, (b) , and (c) conduction velocity on illumination intensity. The data is normalized to respective zero-intensity values. All measurements were taken at the end of a 60-s illumination interval.  Further experiments provide strong evidence that the observed effects are temperature-related and are caused by heating of the tissue due to absorption of high-intensity light. To demonstrate that this is the case, we performed experiments () where the temperature of the preparation was varied with a thermostat (no illumination) in the range between 36°C and 41°C. The AP parameters were recorded via microelectrode and normalized to the values at normal bath temperature (36.5°C). The results of these experiments are illustrated in Fig. 6. Grey squares mark data points from the thermostat experiments. All other labels represent the experimental data from the laser-illumination experiments shown in Fig. 5. To show the data from different types of experiments on the same plot, we recalibrated the light intensity in laser experiments into temperature using APD as the indicator of tissue temperature. For this purpose, we used the thermostat-derived APD versus temperature data [grey squares, Fig. 6(a)]. Fig. 6Dependence of the electrophysiological parameters on temperature. Grey squares indicate data points derived from the experiments in which tissue temperature was controlled by heating/cooling of the superfusing fluid using a thermostat (no dye, no illumination). The data from thermostat experiments are superimposed on to the data from laser illumination experiments. The labeling of data points from laser experiments is the same as in Fig. 5. The solid black line represents the trend of temperature-dependent change for a given electrophysiological parameter. Measurements of (a) APD, (b) AP amplitude, (c) upstroke velocity , and (d) conduction velocity were taken at the end of a 60-s illumination interval.  One can see that, even though the experiments presented in Fig. 6 were carried out in different conditions, the dependence of each electrophysiological parameter on temperature follows the same trend, specific for a given parameter (thick solid line). Note that even the data for 532 nm, which showed a very different dependence on the illumination intensity [see Fig. 5(a)], now fall in line. The fact that data points derived from all laser illumination experiments coincide, within the experimental error, with the thermostat measurements provides strong evidence that light-induced changes are indeed temperature-related. This also justifies the use of APD in these experiments as an indicator of tissue temperature. One-to-one correspondence between the APD and tissue temperature allows the assessment of temperature increase as a function of illumination intensity at 532 and 660 nm. Figure 7 shows that, at the same intensities, the green laser increases tissue temperature significantly more than the red laser. At 532 nm and , temperature increases by as much as , whereas the temperature increase at 660 nm at the same light intensity is only . The stronger heating effect at 532 nm is the result of higher absorption and lower attenuation length of the green light (see Sec. 4 for more detail). 4.DiscussionWe investigated the effects of increased illumination intensity on myocardial tissue and on the performance of a recently introduced NIR voltage-sensitive dye, di-4-ANBDQBS, and di-4-ANEPPS, a widely used cardiac electrophysiology dye with blue-green excitation, with regard to their potential phototoxicity and photobleaching. The upper limit of light intensity was chosen at 5 to 10 times above values reported in the literature. We demonstrate that, within the given duration of illumination and intensity range, neither dye has toxic or phototoxic effects on myocardial tissue. Photobleaching was barely detectable (for both dyes) and was observed only at the highest illumination intensity (). However, we found that light absorption by the tissue at higher intensity levels can result in noticeable tissue heating, affecting electrophysiological characteristics of the myocardium, in particular APD, which in certain conditions can change by more than 30%. The notion of light-induced tissue heating is new in the context of optical mapping literature. In the presence of vigorous perfusion and superfusion with the thermostat-controlled solutions, the effect of radiational heating of the tissue is usually small and has never been quantified. Increasing illumination intensity and the use of powerful laser light sources for optical mapping15–17 brings this issue to the forefront, making our study the first quantitative report on the thermal effects of excitation light in optical mapping studies. Illumination-induced phototoxicity of voltage-sensitive dyes is common for optical mapping experiments in isolated myocytes.11,13,18,19 However, it is usually less pronounced in multicellular aggregates12,20 or tissue preparations.2,8,21 Apparently, di-4-ANBDQBS follows the same trend. It was demonstrated that di-4-ANBDQBS photodamage in isolated myocytes results in significant prolongation in APD (up to 200%).19 Yet our experiments show that, in tissue preparations stained with di-4-ANBDQBS, even relatively high intensities of illumination do not produce any APD prolongation or other phototoxic effects. In single cells, photodamage is mainly caused by production of reactive oxygen species (ROS).11,19 Incubation of the cells with antioxidizing agents significantly reduces the manifestations of phototoxicity.19 The differences in photo sensitivity between single cells and intact tissue can be explained by a lack in isolated cells of an efficient ROS scavenging system, which was damaged during the cell isolation.19 Apparently, in intact tissue preparations, the ROS scavenging system has much higher capacity to neutralize ROS. The most pronounced electrophysiological effect of increased light intensity in our experiments was shortening of the APD. This effect was purely thermal and could be fully reproduced by heating of unstained tissue. APD shortening during the rise of temperature in myocardial tissue was previously reported.22–27 It is attributed to changes in activity and kinetics of potassium and calcium ion channels. Kiyosue et al. (1993)27 demonstrated that a decrease in temperature decreases amplitude and changes activation of . Increases in temperature are also known to increase the amplitude and to significantly shorten the inactivation time of -type calcium channels, causing shortening of APD.25,28 The changes of other electrophysiological parameters in response to increased illumination intensity also point at a thermal effect rather than phototoxic damage. An observed AP amplitude reduction trend (, statistically not significant) is consistent with previously reported temperature-dependent decreases in AP amplitude by in guinea pig papillary muscle24 and rabbit ventricular myocytes.25 The increase in conduction velocity is also characteristic for the thermal mechanism.29,30 Our measurements show that, at the highest power intensity (), the temperature did not increase above 40.5°C from the normal 36.5°C. Such changes are well within the physiological range and should not cause any cell damage. According to the literature, the temperature should be as high as 50°C to induce cell death within two to 3 min.31 While there is a report that a temperature of 43°C can damage tissue, it takes several hours at this temperature to induce cell necrosis.32 In our experiments, the longest exposure was only 1 min, which is far too short to produce any detectable damage. It is interesting that the green laser at the same intensity produces more heating than the red laser. At 532 nm and a light intensity of , the temperature increases from 36.5°C to . At 660 nm and the same light intensity, the temperature increases only to . This difference is not coincidental. The absorption of green light by tissue is significantly stronger than that of red light.33,34 In thin preparations, like the guinea pig ventricular wall (), the green light is fully absorbed (attenuation length ), whereas a significant amount of the red light escapes from the tissue (attenuation length ) without being absorbed. The fact that illumination can produce noticeable heating of the tissue despite vigorous superfusion with thermostated solution is somewhat unexpected. It should be noted that illumination-induced heating is not only a function of illumination intensity and the wavelength, but largely depends on the geometric factors such as surface shape and wall thickness, as well as the rates of perfusion and superfusion. In our experiments, the temperature at both surfaces of the ventricular wall was maintained at the same level by the flow of superfusate, which provided necessary “cooling” and prevented significant temperature increases. However, there are experimental situations when such two-sided cooling is difficult to achieve. Particularly, one should exercise extreme caution in optical mapping studies of no-flow regional or global ischemia in large hearts. In such experiments, the light energy is fully absorbed inside the myocardial wall and is converted to heat. The heat exchange occurring through the epicardial surface is limited and may not be sufficient to prevent more pronounced temperature increases. If not designed properly, such studies could be artifact-prone, with heat-induced APD shortening masking the ischemia-related effects. Increasing illumination intensity is a powerful tool that can lead to significant improvement of the signal-to-noise ratio of voltage-sensitive fluorescent signals and to a reduction of the concentration of voltage-sensitive dyes. Our finding that even high illumination intensities produce a purely thermal and fully reversible effect has important practical implications. Unlike phototoxicity, the thermal effects can be more readily mitigated by appropriate design of the experimental protocols: optimizing the duration of illumination cycle as well as perfusion and superfusion rates, thus paving the way for more efficient use of increased illumination intensities in optical mapping studies. AcknowledgmentsThis research was funded by the European Social Fund under the Global Grant measure and NIH Grants R01 HL 071762-05 and R03 TW008039-03. We also thank Vydmantas Kazakevičius for animal care and Megan Gribble for reading the manuscript and providing valuable comments. ReferencesM. Zochowskiet al.,
“Imaging membrane potential with voltage-sensitive dyes,”
Biol. Bull., 198
(1), 1
–21
(2000). http://dx.doi.org/10.2307/1542798 BIBUBX 0006-3185 Google Scholar
I. R. EfimovV. P. NikolskiG. Salama,
“Optical imaging of the heart,”
Circ. Res., 95
(1), 21
–33
(2004). http://dx.doi.org/10.1161/01.RES.0000130529.18016.35 CIRUAL 0009-7330 Google Scholar
V. D. Khaitet al.,
“Method for the three-dimensional localization of intramyocardial excitation centers using optical imaging,”
J. Biomed. Opt., 11
(3), 034007
(2006). http://dx.doi.org/10.1117/1.2204030 JBOPFO 1083-3668 Google Scholar
E. M. Hillmanet al.,
“Depth-resolved optical imaging of transmural electrical propagation in perfused heart,”
Opt. Express, 15
(26), 17827
–17841
(2007). http://dx.doi.org/10.1364/OE.15.017827 OPEXFF 1094-4087 Google Scholar
J. Kalifaet al.,
“Endoscopic fluorescence mapping of the left atrium: a novel experimental approach for high resolution endocardial mapping in the intact heart,”
Heart Rhythm, 4
(7), 916
–924
(2007). http://dx.doi.org/10.1016/j.hrthm.2007.03.009 1547-5271 Google Scholar
A. V. Zaitsevet al.,
“Wavebreak formation during ventricular fibrillation in the isolated, regionally ischemic pig heart,”
Circ. Res., 92
(5), 546
–553
(2003). http://dx.doi.org/10.1161/01.RES.0000061917.23107.F7 CIRUAL 0009-7330 Google Scholar
A. Matiukaset al.,
“New near-infrared optical probes of cardiac electrical activity,”
Am. J. Physiol. Heart Circ. Physiol., 290
(6), H2633
–H2643
(2006). http://dx.doi.org/10.1152/ajpheart.00884.2005 0363-6135 Google Scholar
A. Matiukaset al.,
“Near-infrared voltage-sensitive fluorescent dyes optimized for optical mapping in blood-perfused myocardium,”
Heart Rhythm, 4
(11), 1441
–1451
(2007). http://dx.doi.org/10.1016/j.hrthm.2007.07.012 1547-5271 Google Scholar
J. P. Wuskellet al.,
“Synthesis, spectra, delivery and potentiometric responses of new styryl dyes with extended spectral ranges,”
J. Neurosci. Methods, 151
(2), 200
–215
(2006). http://dx.doi.org/10.1016/j.jneumeth.2005.07.013 JNMEDT 0165-0270 Google Scholar
G. SalamaB. R. Choi,
“Images of action potential propagation in heart,”
News Physiol. Sci., 15 33
–41
(2000). 0886-1714 Google Scholar
M. E. Hardyet al.,
“Validation of a voltage-sensitive dye (di-4-ANEPPS)-based method for assessing drug-induced delayed repolarisation in beagle dog left ventricular midmyocardial myocytes,”
J. Pharmacol. Toxicol. Methods, 60
(1), 94
–106
(2009). http://dx.doi.org/10.1016/j.vascn.2009.03.005 JPTMEZ 1056-8719 Google Scholar
S. RohrB. M. Salzberg,
“Characterization of impulse propagation at the microscopic level across geometrically defined expansions of excitable tissue: multiple site optical recording of transmembrane voltage (MSORTV) in patterned growth heart cell cultures,”
J. Gen. Physiol., 104
(2), 287
–309
(1994). http://dx.doi.org/10.1085/jgp.104.2.287 JGPLAD 0022-1295 Google Scholar
P. Schafferet al.,
“Di-4-ANEPPS causes photodynamic damage to isolated cardiomyocytes,”
Pflugers Arch., 426
(6), 548
–551
(1994). Google Scholar
C. J. Hyattet al.,
“Synthesis of voltage-sensitive fluorescence signals from three-dimensional myocardial activation patterns,”
Biophys. J., 85
(4), 2673
–2683
(2003). http://dx.doi.org/10.1016/S0006-3495(03)74690-6 BIOJAU 0006-3495 Google Scholar
D. Filgueiras-Ramaet al.,
“High-resolution endocardial and epicardial optical mapping in a sheep model of stretch-induced atrial fibrillation,”
J. Vis. Exp., 53 e3103
(2011). http://dx.doi.org/10.3791/3103 Google Scholar
R. M. SmithS. S. VelamakanniE. G. Tolkacheva,
“Interventricular heterogeneity as a substrate for arrhythmogenesis of decoupled mitochondria during ischemia in the whole heart,”
Am. J. Physiol. Heart Circ. Physiol., 303
(2), H224
–H233
(2012). 0363-6135 Google Scholar
P. W. Venableet al.,
“Complex structure of electrophysiological gradients emerging during long-duration ventricular fibrillation in the canine heart,”
Am. J. Physiol. Heart Circ. Physiol., 299
(5), H1405
–H1418
(2010). http://dx.doi.org/10.1152/ajpheart.00419.2010 0363-6135 Google Scholar
M. E. Hardyet al.,
“Can optical recordings of membrane potential be used to screen for drug-induced action potential prolongation in single cardiac myocytes?,”
J. Pharmacol. Toxicol. Methods, 54
(2), 173
–182
(2006). http://dx.doi.org/10.1016/j.vascn.2006.02.013 JPTMEZ 1056-8719 Google Scholar
M. Warrenet al.,
“High-precision recording of the action potential in isolated cardiomyocytes using the near-infrared fluorescent dye di-4-ANBDQBS,”
Am. J. Physiol. Heart Circ. Physiol., 299
(4), H1271
–H1281
(2010). http://dx.doi.org/10.1152/ajpheart.00248.2010 0363-6135 Google Scholar
S. RohrB. M. Salzberg,
“Multiple site optical recording of transmembrane voltage (MSORTV) in patterned growth heart cell cultures: assessing electrical behavior, with microsecond resolution, on a cellular and subcellular scale,”
Biophys. J., 67
(3), 1301
–1315
(1994). http://dx.doi.org/10.1016/S0006-3495(94)80602-2 BIOJAU 0006-3495 Google Scholar
D. RosenbaumJ. Jalife, Optical Mapping of Cardiac Excitation and Arrhythmias, 458 Futura, Armonk, NY
(2001). Google Scholar
V. V. Fedorovet al.,
“Hibernator Citellusundulatus maintains safe cardiac conduction and is protected against tachyarrhythmias during extreme hypothermia: possible role of Cx43 and Cx45 up-regulation,”
Heart Rhythm, 2
(9), 966
–975
(2005). http://dx.doi.org/10.1016/j.hrthm.2005.06.012 1547-5271 Google Scholar
K. W. Linzet al.,
“Membrane potential and currents of isolated heart muscle cells exposed to pulsed radio frequency fields,”
Bioelectromagnetics, 20
(8), 497
–511
(1999). http://dx.doi.org/10.1002/(ISSN)1521-186X BLCTDO 0197-8462 Google Scholar
S. Nathet al.,
“Cellular electrophysiological effects of hyperthermia on isolated guinea pig papillary muscle. Implications for catheter ablation,”
Circulation, 88
(4 Pt 1), 1826
–1831
(1993). http://dx.doi.org/10.1161/01.CIR.88.4.1826 CIRCAZ 0009-7322 Google Scholar
J. L. Puglisiet al.,
“ influx through channels in rabbit ventricular myocytes during action potential clamp: influence of temperature,”
Circ. Res., 85
(6), e7
–e16
(1999). http://dx.doi.org/10.1161/01.RES.85.6.e7 CIRUAL 0009-7330 Google Scholar
R. Roscheret al.,
“Effects of dopamine on porcine myocardial action potentials and contractions at 37°C and 32°C,”
Acta Anaesthesiol. Scand., 45
(4), 421
–426
(2001). Google Scholar
T. Kiyosueet al.,
“Ionic mechanisms of action potential prolongation at low temperature in guinea-pig ventricular myocytes,”
J. Physiol., 468 85
–106
(1993). JPHYA7 0022-3751 Google Scholar
Y. C. Chenet al.,
“Heat stress responses modulate calcium regulations and electrophysiological characteristics in atrial myocytes,”
J. Mol. Cell Cardiol., 48
(4), 781
–788
(2010). http://dx.doi.org/10.1016/j.yjmcc.2009.08.006 0022-2828 Google Scholar
A. Nygrenet al.,
“Voltage-sensitive dye mapping in Langendorff-perfused rat hearts,”
Am. J. Physiol. Heart Circ. Physiol., 284
(3), H892
–H902
(2003). 0363-6135 Google Scholar
T. A. Simmerset al.,
“Effects of heating on impulse propagation in superfused canine myocardium,”
J. Am Coll. Cardiol., 25
(6), 1457
–1464
(1995). http://dx.doi.org/10.1016/0735-1097(94)00559-9 0735-1097 Google Scholar
S. J. Grahamet al.,
“Quantifying tissue damage due to focused ultrasound heating observed by MRI,”
Magn. Reson. Med., 41
(2), 321
–328
(1999). IJHYEQ 0265-6736 Google Scholar
M. W. Dewhirstet al.,
“Basic principles of thermal dosimetry and thermal thresholds for tissue damage from hyperthermia,”
Int. J. Hyperthermia, 19
(3), 267
–294
(2003). http://dx.doi.org/10.1080/0265673031000119006 IJHYEQ 0265-6736 Google Scholar
B. G. MitreaM. WelnerA. M. Pertsov,
“Monitoring intramyocardial reentry using alternating transillumination,”
in Conf. Proc. IEEE Eng. Med. Biol. Soc. 2009,
4194
–4197
(2009). Google Scholar
R. D. Waltonet al.,
“A novel near-infrared voltage-sensitive dye reveals the action potential wavefront orientation at increased depths of cardiac tissue,”
in Conf. Proc. IEEE Eng. Med. Biol. Soc. 2009,
4523
–4526
(2009). Google Scholar
|


