|
|
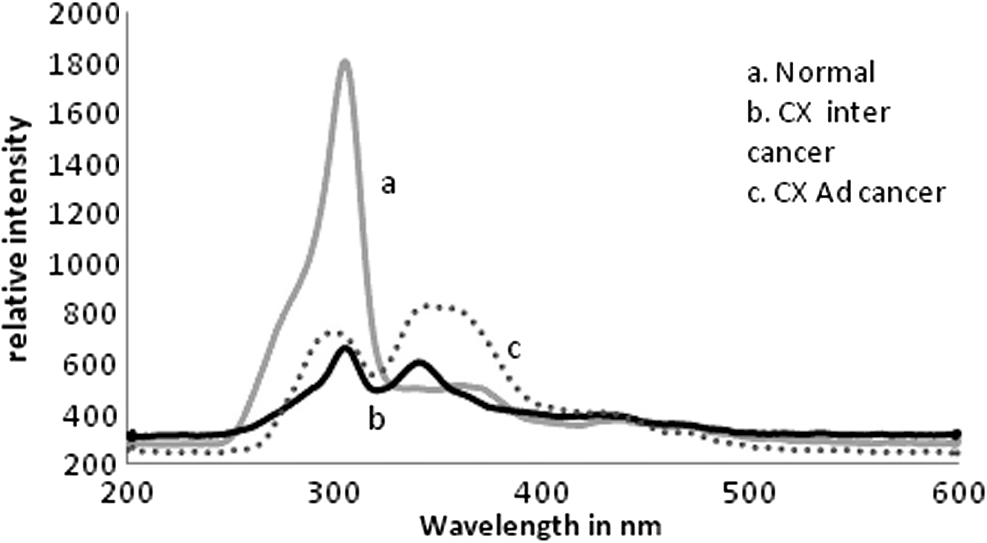
1.IntroductionWorldwide, cervical cancer is the most commonly diagnosed malignancy, and its mortality rate ranges from 50% to 60%. In the Eastern hemisphere, 85% of the reported cases occur in developing countries.1 For example, almost 27% of global mortality due to cervical cancer occurred in India in 2008. In contrast, in developed countries such as the United States, the rates of cervical cancer incidence and mortality are lower.2 This is mainly because in developing countries cancer screening and early detection programs have not yet been systematized. The most common cause for cervical cancer is human papillomavirus (HPV); in recent times, screening tests for HPV compete well with the conventional Pap smear cytology test. The sensitivity of cytology is about 60% for a single test and may go up to 90% for repeated tests for the same individual. In contrast, the HPV DNA test has sensitivity and specificity in the range of 90%, and in due course the combination of the two tests may yield better results. For detection of precancerous lesions, more invasive procedures such as visual inspection with acetic acid (VIA), visual inspection with Lugol iodine (VILI), and colposcopy are done. In a screening report from Zimbabwe, VIA was shown to have sensitivity of 76.7% in comparison to cytology of 44.3%, but the specificity was 64% for VIA and 90.6% for cytology. In recent studies conducted in China, VILI had a sensitivity of 53% and specificity of 82%; colonoscopy had a sensitivity of 56% and specificity of 79%.3,4 All these procedures are mildly or strongly invasive and resented by women, particularly in Asian and African countries, due to cultural ethos. In this context, the results of this paper indicate the feasibility of employing fluorescence spectroscopy of blood and urine as a totally noninvasive, nonintrusive technique for detection and screening of cervical cancer. This technique is appealingly simple, rapid, and inexpensive. Hence, it could be of significant value in first-line screening, diagnosis, or follow-up after treatment. Cancer detection using fluorescence spectroscopy based on native or labeled fluorescence of tumor tissue has been well established for decades. It has also found application in the clinical setting in the form of laser-induced fluorescence endoscopy and bronchoscopy.5 Alfano and colleagues6,7 made an important contribution in this line with their analysis of laser-induced fluorescence properties of cancerous and normal human tissues. Kapadia et al.8 used a He-Cd laser at 325 nm to show that tumor tissues have distinct and characteristic autofluorescence at around 450 nm due to endogenous fluorophores such as collagen and Nicotinamide adenine dinucleotide (NADH). Another important study was from Schomacker et al.9 who used a nitrogen laser at 337 nm to study colonic tissues; they also noticed that the fluorescence at 460 nm due to NADH is a sign of cancer. The work of Yuanlong et al.10 based on xenon lasers, showed that cancerous tissues of different etiologies exhibited fluorescence emission peaks at 630 and 690 nm due to endogenous porphyrin. After these early investigations, several other studies have been done on examination in vivo of cervix and uterus to diagnose malignant and premalignant conditions.11 Subsequently, Alfano and Yang12 introduced Stokes shift spectroscopy (SSS) to distinctly discriminate different fluorophores with high resolution. Despite several independent studies on the fluorescence property of cancer tissues, only a few have been conducted on blood and urine. Wolfbeis and Leiner13 reported the excitation/emission matrix of blood from patients with gynecological tumors. Karthikeyan et al.14 showed that in mice with chemically induced cancer, the porphyrin found in the cellular fraction of blood was significantly elevated (in comparison to that of healthy mice). Masilamani and colleagues15–17 showed that the elevation of porphyrin was also observed in humans. Another important study from Madhuri et al.18 was the detection of liver dysfunction from the fluorescence emission of blood plasma. These studies are great improvements in comparison to the preliminary report by Xu et al.19 on spectral features of blood. In this paper, we present the results of a study done to distinguish cervical cancer patients () from healthy subjects () based on the fluorescence emission spectra (FES) and SSS of blood and urine. FES was obtained from the cellular fraction of blood and urine by excitation at 400 nm. SSS was obtained from blood plasma and urine with of 70 nm. In the FES of blood cellular fraction, the ratio of intensity of the two bands due to neutral porphyrin and basic porphyrin () was 1 for normal controls and 3 for cervical cancers. In the SSS of plasma, the average ratio of intensity of the two bands due to tryptophan and collagen () was 1.9 for normal controls, 1.1 for early cervical cancers, and 0.9 for advanced cervical cancers. In the SSS of urine, the ratio of intensity of the two bands due to flavin and NADH () was 0.2 for normal controls and 0.8 for cancer patients. A discriminant analysis combining all these parameters showed a sensitivity of 80% and specificity of 78% for this technique. Through this study we show that fluorescence spectroscopy of blood and urine could develop into a noninvasive protocol for diagnosis and screening for cervical cancers and supplement currently employed techniques. 2.Materials and Methods2.1.Patients and Normal ControlsCervical cancer patients were recruited for this study from three different hospitals: GVN Cancer Hospital, Trichy, India; Rai Memorial Cancer Hospital, Chennai, India; and King Khalid University Hospital, Riyadh, Saudi Arabia. The ethics committees of all three hospitals approved the study, all cancer patients were informed about the investigation, and formal informed consent was obtained. All patients were newly diagnosed cancer patients, and their blood and urine samples were obtained before any treatment. A total of 50 cervical cancer patients were enrolled, of whom 18 had early-stage carcinoma and 32 had advanced-stage invasive carcinoma. The age of patients ranged from 20 to 56 years (median 45). An equal number of age-matched healthy volunteers (with formal informed consent) were also enrolled as controls and were subjected to the same procedures as cancer patients. Both controls and patients were required to be free from medications for 24 h before sample collection. 2.2.Sample ProcessingFrom each subject, 5 mL venous blood was collected and transferred into a sterile vial containing EDTA as anticoagulant. The vial was gently rocked five times for adequate mixing of EDTA and then centrifuged at 3000 rpm for 15 min to separate the plasma from cellular debris. Supernatant plasma (1 mL) was pipetted out carefully without disturbing the buffy coat layer. The plasma was used for analysis without any further treatment. The buffy coat layer was gently removed and discarded. From the cellular fraction sediments, 1 mL thick, viscous formed elements was pipetted out into a sterile vial containing 2 mL analytical-grade acetone. The mixture was vigorously shaken to ensure adequate and uniform mixing of acetone with the cellular fraction. Proper care was taken to avoid clumps. Acetone was used to extract the fluorophores from the inside of the cells. After thorough mixing, the mixture was centrifuged at 3000 rpm for 15 min. The supernatant acetone extract, now rich in fluorophores, was used for analysis. First voided, fasting urine (5 mL) was collected in a sterile vial from each subject and used for analysis without any other preparation. 2.3.Instruments and AnalysisWe used either a PerkinElmer Luminescence PE 45 for work in Saudi Arabia or an Elico LS 70 for work in India. Both instruments had red-sensitive photomultipliers, and both were calibrated to give similar readings in the wavelength range of 200 to 800 nm, with a resolution of 10 nm. FES were obtained by exciting the sample at 400 nm and capturing the emission spectra over the range of 425 to 675 nm. SSS were obtained by capturing the excitation spectra while continuously varying the emission wavelength. An optimal offset () of 70 nm was constantly maintained between the excitation and emission gratings.15–17 We tried offsets such as 20, 30, or 40 nm as others12,20 have tried. But gave the best distinction between the normal and diseased sample. This is understandable, as 70 nm is the Stokes shift between fluorophores of our interest. For example, for tryptophan, SSS was (); for collagen, (); and flavin adenine dinucleotide (FAD) (). FES were obtained for the acetone extracts of blood components and untreated urine. SSS were obtained for blood plasma and urine. For each spectrum, we measured the ratio of intensity of fluorescence peaks, which depends only on the concentration of different fluorophores and their microenvironment. Use of ratio parameters of the spectra gives a proper measure of biomarker concentration free from errors arising out of all instrument variabilities between different runs and sample variabilities across different patients and controls. 3.ResultsFor each patient or normal control, we obtained five different spectra from blood and urine: FES of acetone extract of blood components, FES of blood plasma, FES of urine, SSS of blood plasma, and SSS of urine. Before analyzing acetone extracts, we recorded the background fluorescence response of pure acetone by exciting it at different wavelengths. It gave a neat, single sharp band at 457 nm, corresponding to an excitation at 400 nm. This is most likely the Raman band due to C-H vibration of acetone, with a Stokes shift of . This was confirmed by excitation of acetone at 375, 425, 450, and 475 nm, for which the acetone spectrum showed corresponding Raman bands with an approximate Stokes shift of . Figure 1(a) shows the typical normalized FES of acetone extract of blood components from healthy subjects. It can be seen that there is a band at around 457 nm (Raman band of acetone), a shoulder at around 510 nm (flavin, mostly likely from the residual plasma), a well-defined band at 585 nm (basic form of porphyrin) and another at around 630 nm (neutral porphyrin), and yet another band at around 690 nm (protonated form of porphyrin). This is to be compared with Fig. 1(b), typical FES of acetone extract of blood components from advanced cervical cancer patients. Here again, there are five well-defined bands at 457, 510, 585, 630, and 690 nm. But the intensities of these bands are markedly different from those of the healthy blood extracts. It is important to note that both spectra are normalized with respect to the band with highest intensity of sample of the normal subject (for example, in Fig. 1 the band at 457 nm is highest) to obtain distinct discrimination against those of the malignant subjects. Fig. 1Fluorescence emission spectra (at excitation wavelength of 400 nm) of acetone extract of cellular components of normal controls (Nor) (a) and cancer patients (Ca) (b).  Comparing these spectral bands, one can see that the ratio between the fluorescence intensity at 630 nm and that at 585 nm (defined as ) is about 1 for normal controls, whereas for advanced cancer patients, it ranges from 2 to 3. This ratio represents the fluorescence of neutral porphyrin with respect to basic porphyrin. Another ratio parameter between the bands at 630 and 457 nm (defined as ) is about 0.2 for control but 0.6 for advanced cancer. This ratio represents the relative fluorescence intensity of neutral porphyrin with respect to that of the background acetone. Figure 2(a) shows the typical FES of urine of normal controls, and Fig. 2(b) shows that of advanced cancer patients. It can be clearly seen that, for the normal controls, there are two bands, one at 510 nm (flavin) with a shoulder at around 457 nm (NADH) and a weak band at 620 nm (porphyrin). But, for the malignant sample, the flavin band gets shifted to 520 nm and the 457-nm band gets depressed; the 620-nm band is only marginally elevated in comparison. The ratio parameter defined as is about 0.25 for normal controls and about 1 for advanced cancer patients. The ratio parameter defined as is about 1.2 for normal controls but goes up to 2.5 for cancer patients. Fig. 2Fluorescence emission spectra (at excitation wavelength of 400 nm) of urine of normal controls (Nor) (a) and cancer patients (Ca) (b). 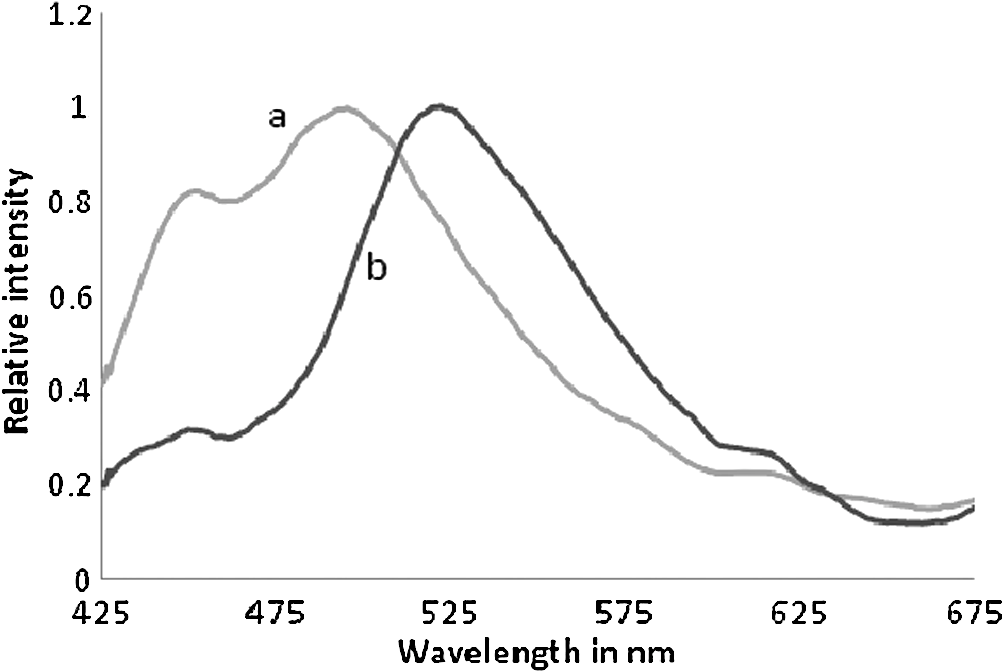 Figure 3(a) gives the typical SSS of urine of normal controls, and Fig. 3(b) gives the SSS of urine of advanced-stage cancer patients. Note that since normal samples typically have low intensity compared to cancer samples, the intensity of the normal graph has been multiplied five times to make the spectra comparable. There are two important bands, one at around 360 nm (NADH) and another at around 450 nm (flavin). The ratio between the bands defined as is around 0.3 for normal controls and 1.6 for advanced-stage cancer patients. That is, the relative concentration of flavin is elevated by about 500% in diseased urine. The FES of urine (shown above in Fig. 2) gives almost identical results as seen in the SSS of urine, but the difference is much accentuated in SSS. Fig. 3Stokes shift spectra SSS ( 70) of urine from normal controls (Nor) (a) and cancer patients (Ca) (b).  Figure 4 is again an SSS of urine but of a cancer patient only. This has two peaks: one around 390 nm and another at 450 nm (flavin) with a shoulder also around 360 nm (NADH). The peak around 390 nm is most likely the Soret band of hemoglobin (mostly due to porphyrin) of occult blood. Figure 5(a) and 5(b) are FES of plasma of normal controls and advanced cancer patients, respectively, obtained by excitation at 400 nm. It can be seen that the 510-nm band (flavin) and the 620-nm band (porphyrin) are significantly elevated in cancer patients. Note the one-to-one correspondence between the bands in FES of urine and plasma, although in urine, the biomarkers are more conspicuously elevated. Fig. 5Fluorescence emission spectra (at excitation wavelength of 400 nm) of blood plasma of normal controls (Nor) (a) and cancer patients (Ca) (b).  Here, it is important to mention that we have shown in our previous publications that all the above features of cervical cancer patients are also seen in most other cancers.21 That is, the previously described spectral features are generic to all cancer types. Using those features, we can discriminate samples of cancer patients from those of normal controls21 but cannot distinguish a breast cancer patient from a cervical cancer patient. However, the SSS of plasma shows distinct spectral features that are exclusive for lung cancer17 and pancreatic cancer22 as shown by our earlier reports. Similarly, we find that the SSS of plasma also has a unique spectral biomarker for cervical cancers, as shown below. It can be seen that in the SSS of plasma of normal controls, as shown in Fig. 6(a), there is main band at 305 nm (corresponding to the excitation band of tryptophan), a secondary band at 360 nm (corresponding to the excitation band of NADH), and a minor band at 440 nm (flavin). In contrast, in the SSS of plasma of cancer patients, as shown in Fig. 6(b), there is a new band at 340 nm for early cervical cancer. This band also grows stronger in Fig. 6(c) for advanced cervical cancer. The ratio parameter defined as is 3.7 for normal controls, 1.1 for early cervical cancer, and 0.85 for advanced cervical cancer. Note that this band at 340 nm is totally absent in normal controls and is exclusive to plasma of cervical cancers alone. Also, this spectral feature, most likely due to collagen, is observed in only 65% of cervical cancer patients. 4.Statistical AnalysisTo provide statistical validity for the observed spectral results, a set of ratio parameters (, , etc.,) were introduced. A particular ratio parameter—say, —is defined as the ratio of fluorescence intensities of two bands (). Mean and SD values of all the ratio parameters were calculated for each group of experimental subjects. One-way factorial ANOVA was used to calculate the level of physical significance (P) with a 95% confidence interval, with which each ratio variable discriminated normal subjects from diseased subjects. The area under the receiver operator characteristic (ROC) curve was obtained for each ratio parameter to determine the ability of the parameter to distinguish healthy controls from cancer patients (both early and advanced pooled together) (Table 1). Table 1Fluorescence ratio parameters (mean—SD) for controls and cervical cancer patients.
4.1.Stepwise Discriminant AnalysisThe present study is for discriminating between healthy and early cancer (group I); healthy and advanced cancer (group II); and early and advanced cancer (group III). The ratio variables ( to ) were the inputs for stepwise discriminant analyses to determine the sensitivity and specificity. Table 2 summarizes the true positive (sensitivity) and true negative (specificity) values of optical diagnosis. Table 2Summary of statistical analysis.
5.DiscussionCervical cancer represents a major health concern because of the high level of morbidity and mortality associated with it, in spite of the recent improvements in therapeutic and constructive modalities.23–27 In this paper, an attempt was made to compare the fluorescence emission and SSS of blood and urine of cervical cancer patients with those of normal controls. A set of ratio parameters, based on the relative intensities of spectral bands, were obtained and used as inputs for statistical analysis to determine the specificity, sensitivity, and diagnostic potential of this new, evolving technique. It can be seen from FES (Fig. 1) of acetone extract of cellular components that there are five well-defined bands at 457, 510, 585, 630, and 690 nm. But the intensities of these bands for cancer patients are markedly different from those of the controls. There is a two- to three-fold enhancement of porphyrin in the blood of cancer patients. For visual inspection, the urine samples from normal controls are pale green, and those of the cervical cancer patient are yellowish and occasionally yellowish red (possibly due to occult blood). Their spectral features are as shown below. The results of FES of urine (Fig. 2) shows that the bands at 510 nm (flavin) and 620 nm (porphyrin) both are significantly elevated in cervical cancer patients: the FES of blood plasma (Fig. 5) are similar to those of urine, but the changes in biomarker levels are less conspicuous. Such elevation could be appreciated more easily in SSS than FES of any sample, for instance of urine (Figs. 2 and 3) or plasma (Figs. 5 and 6). These are the decisive advantages of SSS over FES. Flavin is elevated not only relative to NADH but also in absolute quantity by two to three times in cancer patients in comparison to normal subjects. However, when we normalize the spectra, the discrimination becomes conspicuous. The depression around 457 nm is most likely due to reabsorption of emission of NADH by flavin (which has peak absorption at 460 nm). There could also be energy transfer from NADH to flavin. Figure 4 is of special significance. It is the SSS of urine of an advanced cervical cancer patient. Here the peak is at 390 nm and not at 450 nm, as is common for most of our malignant cases. This appears to be the Soret band of porphyrin of hemoglobin of occult blood common in cervical cancer patients. For some reason, this band becomes so distinct and prominent only in about 70% of malignant cases and only very rarely in normal controls. We are planning to do more systematic study by taking acetone or acetone-ethanol extractd of urine of normal and cervical cancer patients. This is scheduled for future publications. Our investigations, reported here and elsewhere,15–17 show that the elevation of fluorophores such as porphyrin and flavin observed in tumor tissue could also be observed in blood and urine. Another observation is that FES and SSS of urine are markedly similar to those of blood plasma. The only major difference is that we do not observe fluorescence due to tryptophan and collagen in urine. Tryptophan is an essential amino acid, and collagen is a structural protein. We find them only as traces in urine, though they are quite substantial in plasma. Perhaps they are filtered in the kidneys and restored into the system. All the features mentioned above are common to many cancers. There is nothing unique for cervical cancer samples so far. The most important result of this paper is the indication of collagen as an exclusive spectral biomarker for cervical cancer as indicated by the SSS of plasma. It is important to compare our study with a very similar one done by Ebenezar et al.20 on cervical cancer tissues. They described a synchronous fluorescence spectroscopic technique to assess the diagnostics potential for the detection and characterization of normal, moderately differentiated squamous cell carcinoma (MDSCC), and poorly differentiated squamous cell carcinoma (PDSCC) of cervical tissues. The biomarkers considered for their study were tryptophan, NADH, collagen, and FAD. In their study on tissue, as much as ours on blood and urine, FAD was found to be elevated and NADH decreased for cancer patients (always in comparison with the normal controls). On the other hand, their observation was that collagen levels had decreased in malignant tissue; but they decisively increased in blood plasma as observed by us. This is understandable, because malignancy erodes epithelium and releases the structural protein collagen, and whatever is released should go into circulation in the blood and hence the abnormal elevation of collagen in blood plasma. Another important difference is the absence of any remark in their paper about elevation of porphyrin on the tissue site, which is a common factor for all cancer tissues. Such elevation has been well substantiated in our study on blood and urine, although the reasons for abnormal elevation of porphyrin, and FAD for cancer tissue, are in dispute; nonetheless, they have been accepted as fluorescent biomarkers of cancer tissue. In short, what others have identified as spectral biomarkers in cancer tissue, we have been able to show in blood and urine. The most significant result of this paper is the identification of collagen in plasma as a cervical cancer tumor marker as indicated by the SSS of plasma. To explore the diagnostic potential of this technique, the contrast of each ratio parameter, (defined as the ratio between the particular value for the advanced cancer cases and the control) and area under the ROC (not shown) were obtained and shown in Table 1. It was found that the porphyrin elevation in acetone extract of cellular component () and the flavin elevation in urine () have better discrimination capabilities than the others, and the sensitivities and specificities based on these two parameters were averaged out to get the final score shown in Table 2. It is important to emphasize that the exclusive biomarker collagen was found distinctly only in 65% of the blood plasma of advanced cancer patients (28 of 32) more frequently and only occasionally in early cases (4 of 18). The present paper is based on a preliminary study with 50 patients of known malignancy and 50 normal controls. The entire set of patients had only cervical malignancy and did not have any other common infections such as tuberculosis, malaria, or hepatitis B or C. The same was true for the normal controls. Our objective was to discriminate only between these two sets. In the next phase, which is under progress in a cancer center in India, we are doing single-blind and double-blind studies, again with cancer patients and normal subjects. This will be followed by a clinical trial where samples from women in age group of 40 to 50 years are to be screened without any restriction of disease (including common infection and cervical malignancy). Only when the specificity and sensitivity are in the range of 80% will this technique become a potential diagnostic protocol. We are in the early stage of this long process, and this paper is only a proof of concept of a new spectral technique. 6.ConclusionsThis paper presents a preliminary, investigative study on the native fluorescence spectral characteristic of blood and urine of cervical cancer patients in comparison to that of normal controls. Using SSS and fluorescence emission spectroscopy, it has been shown that the relative fluorescence intensities of porphyrin, flavin, NADH, and collagen are distinctly different in cervical cancer patients. It has also been shown that this technique can distinguish cervical cancer patients from normal controls with a sensitivity of 80% and a specificity of 78%. Although the biochemical mechanism behind the elevation of these fluorophores is still not definitive, these biomolecules could serve as tumor markers for diagnosis, screening, and follow-up of cervical cancers. The importance of this new technique lies in its extreme simplicity, cost effectiveness, and noninvasive approach. This technique is not meant to replace current procedures, but only to supplement and/or complement the existing ones. This new technique, after a series of clinical trials, may be used as the first step in mass screening of high-risk women in developing countries, as it can be easily administered at primary health centers before expensive and advanced testing is recommended. It must also be noted that this technique can be used with greater advantage for periodic monitoring of disease regression or recurrence in cancer patients who are already under treatment; however, we are yet to demonstrate the applicability of this technique for prognostic evaluation in a clinical trial. AcknowledgmentsThis project was supported by King Saud University, Deanship of Scientific Research, of College of Science, Research Center. References, Globocan,Cervical cancer incidence and mortality worldwide in 2008,”
(2012) (Accessed August ). 2012). Google Scholar
R. Sankaranarayananet al.,
“A cluster randomized controlled trial of visual, cytology and human papillomavirus screening for cancer of the cervix in rural India,”
Int. J. Cancer, 116
(4), 617
–623
(2005). http://dx.doi.org/10.1002/(ISSN)1097-0215 IJCNAW 1097-0215 Google Scholar
“Visual inspection with acetic acid for cervical-cancer screening: test qualities in a primary-care setting,”
Lancet, 353
(9156), 869
–873
(1999). http://dx.doi.org/10.1016/S0140-6736(98)07033-0 LANCAO 0140-6736 Google Scholar
S. Cecchiniet al.,
“Testing cervicography and cervicoscopy as screening tests for cervical cancer,”
Tumori, 79
(1), 22
–25
(1993). TUMOAB 0300-8916 Google Scholar
Y. Kusunokiet al.,
“Early detection of lung cancer with laser-induced fluorescence endoscopy and spectrofluorometry,”
Chest, 118
(6), 1776
–1782
(2000). http://dx.doi.org/10.1378/chest.118.6.1776 CHETBF 0012-3692 Google Scholar
R. R. Alfanoet al.,
“Laser induced fluorescence spectroscopy from native cancerous and normal tissues,”
IEEE J. Quantum Electron., 20
(12), 1507
–1511
(1984). http://dx.doi.org/10.1109/JQE.1984.1072322 IEJQA7 0018-9197 Google Scholar
R. R. Alfanoet al.,
“Fluorescence spectra from cancerous and normal human breast and lung tissues,”
IEEE J. Quantum Electron., 23
(10), 1806
–1800
(1987). http://dx.doi.org/10.1109/JQE.1987.1073234 IEJQA7 0018-9197 Google Scholar
R. Kapadiaet al.,
“Laser induced fluorescence spectroscopy of human colonic mucosa,”
Gastroenterology, 99
(1), 150
–157
(1990). GASTAB 0016-5085 Google Scholar
K. T. Schomackeret al.,
“Ultraviolet laser induced fluorescence of colonic tissue: basic biology and diagnosis potential,”
Lasers Surg. Med., 12
(1), 63
–78
(1992). http://dx.doi.org/10.1002/(ISSN)1096-9101 LSMEDI 0196-8092 Google Scholar
Y. Yuanlonget al.,
“Characteristic autofluorescence for cancer diagnosis and its origin,”
Lasers Surg. Med., 7
(6), 528
–532
(1987). http://dx.doi.org/10.1002/(ISSN)1096-9101 LSMEDI 0196-8092 Google Scholar
A. Mahadevanet al.,
“Study of fluorescence properties of normal and neoplastic human cervical tissue,”
Lasers Surg. Med., 13
(6), 647
–655
(1993). http://dx.doi.org/10.1002/(ISSN)1096-9101 LSMEDI 0196-8092 Google Scholar
A. A. AlfanoY. Yang, Proc. SPIE, 5326 1
–7
(2004). http://dx.doi.org/10.1117/12.527961 PSISDG 0277-786X Google Scholar
O. WolfbeisM. Leiner,
“Mapping of the total fluorescence of human blood serum as a new method for its characterization,”
Anal. Chim. Acta, 167 302
–315
(1985). http://dx.doi.org/10.1016/S0003-2670(00)84422-0 ACACAM 0003-2670 Google Scholar
K. KarthikeyanV. MasilamaniS. Govindasamy,
“Spectrofluorimetric detection of DMBA-induced mouse skin carcinoma,”
Pathol. Oncol. Res., 5
(1), 46
–48
(1999). http://dx.doi.org/10.1053/paor.1999.0046 POREFR 1219-4956 Google Scholar
V. Masilamaniet al.,
“Cancer diagnosis by auto fluorescence of blood components,”
J. Lumines., 109
(3–4), 143
–154
(2004). JLUMA8 0022-2313 Google Scholar
V. Masilamaniet al.,
“Cancer detection by native fluorescence of urine,”
J. Biomed. Opt., 15
(5), 057003
(2010). http://dx.doi.org/10.1117/1.3486553 JBOPFO 1083-3668 Google Scholar
M. AlSalhiet al.,
“Lung cancer detection by native fluorescence spectra of body fluids—a preliminary study,”
J. Fluoresc., 21
(2), 637
–645
(2011). http://dx.doi.org/10.1007/s10895-010-0751-9 JOFLEN 1053-0509 Google Scholar
S. Madhuriet al.,
“Native fluorescence spectroscopy of blood plasma in the characterization of oral malignancy,”
Photochem. Photobiol., 78
(2), 197
–204
(2003). http://dx.doi.org/10.1562/0031-8655(2003)078<0197:NFSOBP>2.0.CO;2 PHCBAP 0031-8655 Google Scholar
X. Xuet al.,
“The characteristic fluorescence of the serum of cancer patients,”
J. Luminesc., 40–41 219
–220
(1988). http://dx.doi.org/10.1016/0022-2313(88)90163-9 JLUMA8 0022-2313 Google Scholar
J. EbenezarP. ArunaS. Ganesan,
“Synchronous fluorescence spectroscopy for the detection and characterization of cervical cancers in vitro,”
Photochem. Photobiol., 86
(1), 77
–86
(2010). http://dx.doi.org/10.1111/php.2009.86.issue-1 PHCBAP 0031-8655 Google Scholar
M. AlSalhiet al.,
“Detection of cancer by optical analysis of body fluids: a single blind study,”
Technol. Cancer Res. Treat., 10
(2), 145
–152
(2011). TCRTBS 1533-0346 Google Scholar
A. R. I. Al-Diabet al.,
“Detection of cancer of pancreas by native fluorescence of blood components: a preliminary report,”
Emirates Med. J., 25
(1), 29
–38
(2007). 0250-6882 Google Scholar
J. Ferlayet al., Cancer Incidence, Mortality and Prevalence Worldwide, IARC Press, Lyon, Globocan
(2000). Google Scholar
P. Pisaniet al.,
“Estimates of the worldwide mortality from 25 cancers in 1990,”
Int. J. Can., 83
(1), 18
–29
(1999). Google Scholar
N. ThekkekR. Richards-Kortum,
“Optical imaging for cervical cancer detection: solutions for a continuing global problem,”
Nat. Rev. Can., 8 725
–773
(2008). http://dx.doi.org/10.1038/nrc2462 NRCAC4 1474-175X Google Scholar
Y. N. Mirabalet al.,
“Reflectance spectroscopy for in vivo detection of cervical precancer,”
J. Biomed. Opt., 7
(4), 587
–594
(2002). http://dx.doi.org/10.1117/1.1502675 JBOPFO 1083-3668 Google Scholar
M. Canpolatet al.,
“Detection of precancerous cervical conditions using elastic light single-scattering spectroscopy,”
Proc. SPIE, 7573 75730V
(2010). http://dx.doi.org/10.1117/12.845830 0277-786X Google Scholar
|