|
|
1.IntroductionThe main components of articular cartilage are collagens, proteoglycans (PGs), and interstitial water, which accounts for 65% to 80% of the total tissue weight.1 Collagen establishes a fibrous network in the cartilage, and the fibrils in the surface orient themselves parallel to the articular surface, is more random in the middle layer and turn perpendicular to the cartilage-subchondral bone interface in the deep tissue.1 Such a fibrous network, when interacting with PGs and water, provides articular cartilage with its unique mechanical properties. The mechanical strength of collagen fibrils is controlled by the intra- and inter-molecular cross-linking of collagen molecules. Cartilage collagen has been estimated to have a half-life of over one hundred years.2 Therefore, advanced glycation end products (AGEs) can accumulate along aging in the tissue3 to act as cross-links. This can increase the mechanical stiffness of the cartilage.4–6 Potentially, age-related changes in the collagen network, especially in the cross-links, can make the cartilage more brittle. This may further contribute to an increased vulnerability of the cartilage to injury in old age.5 The quality and concentration of the collagen cross-links can be assessed by quantifying their natural fluorescence. Age-independent cross-links, i.e., hydroxylysyl pyridinoline (HP) and lysyl pyridinoline (LP),7 are measured at excitation/emission wavelengths of 8 or .9 Several compounds in cartilage fluoresce in the same wavelength range, e.g., 2,6-dimethyldifuro-8-pyrone (DDP), a cartilage-specific compound and a potential indicator of cartilage metabolism, fluoresces at .10 The AGEs are routinely assessed by their fluorescence at ,5,11–13 however, a specific AGE, pentosidine (Pent), has its fluorescence maximum at .14 High-performance liquid chromatography, HPLC, has been traditionally used for the quantification of Pent concentration.9 As HPLC analysis necessitates complex and destructive sample processing techniques: it is not feasible for in situ or in vivo measurements. The fluorescence of AGEs may be linked to the development of osteoarthritis (OA) in the cartilage. Typically, the fluorescence first diminishes around the chondrocytes as the cartilage matrix starts to degenerate.15 However, when OA progresses and cartilage degeneration is clinically evident, the intrinsic fluorescence ( and ) increases.16 The tensile strength of intact cartilage has been reported to be significantly correlated with the fluorescence ratio of Pent and pyridinoline after the samples are lyophilized and digested using proteinase K.17 Furthermore, significant differences in the fluorescence and mechanical properties between naturally aged and OA cartilage have been demonstrated.17 In the present study, we generate AGEs experimentally in bovine articular cartilage by incubating samples in a threose solution. According to Verzijl et al.5 threose generates at least -(carboxymethyl)lysine (CML), formyl threosyl pyrrole (FTP), threosidine, and Pent. Hence threose may be used to mimic one aspect of cartilage aging, i.e., the accumulation of AGEs. In this study, we investigate how the cartilage’s intrinsic fluorescence is modified by the threose treatment and how the generation of AGEs, as evidenced by HPLC, can be observed from intact tissue, i.e., without digestion or other processing of the cartilage. 2.Materials and Methods2.1.Sample PreparationIntact bovine knee joints (, ) were obtained from the local abattoir (Atria Oyj, Kuopio, Finland). After opening the joint, osteochondral samples () were removed from the upper lateral quandrant of the patellae. Four samples () within an area smaller than 25 mm in diameter were harvested from each patella. The control samples (, ) were immersed in a cell culture medium [Dulbecco’s modified Eagle’s medium (DMEM) low glucose , without phenol red, Sigma Aldrich Co., St. Louis, MO], with penicillin, streptomycin, 10 mM HEPES buffer solution, 1 mM L-glutamine (EuroClone S.p.A., Milano, Italy), and μg/ml vitamin C (Sigma Aldrich Co.). For the other samples, 100 mM L-threose (Sigma Aldrich Co.) was added in liquid to induce cross-link formation.5 The samples were incubated in 5% air atmosphere at 37°C. The incubation time for the control samples and the 12 samples with threose was 40 and 100 h for the six samples with threose treatment. Control samples () for 100 h threose treatment were also prepared but had to be rejected due to algae found in the medium after incubation for 100 h. For additional noncontact optical measurements (data not shown), the samples were removed after every 5 h from the incubator during the first 40 h and after every 15 h thereafter. After incubation, all the samples were changed into fresh control liquid (the same as the control incubation liquid), and the cartilage thickness was determined using a stereomicroscope at four locations around the edge of the sample.18 After the thickness measurements, the samples were frozen () until the fluorescence measurements. 2.2.Excitation-Emission Matrix MeasurementThe excitation-emission matrices (EEMs), representing the fluorescence of the samples, were measured using a bispectrometer (Fig. 1). In the bispectrometer, the sample was illuminated by a xenon arc lamp (Oriel M-66923 housing, Newport Corporation, Irvine, CA, and Osram XBO bulb, Osram AG, Winterthur, Switzerland) attached to a monochromator (DTMc300, Bentham Instruments Ltd., Berkshire, UK). The emitted light from the sample was collected in -geometry (illumination at the normal angle and detection at an angle of 45 deg) into a spectrograph (PMA-12, Hamamatsu Photonics K.K., Hamamatsu City, Japan). The setup allowed illumination and detection in the wavelength range 220 to 950 nm. Fig. 1Schematic presentation of the measurement setup using a bispectrometer. A monochromator was used to filter the light from the xenon light source. The light emitted from the sample was collected to an optical fiber in geometry and analyzed using a spectrograph detector. 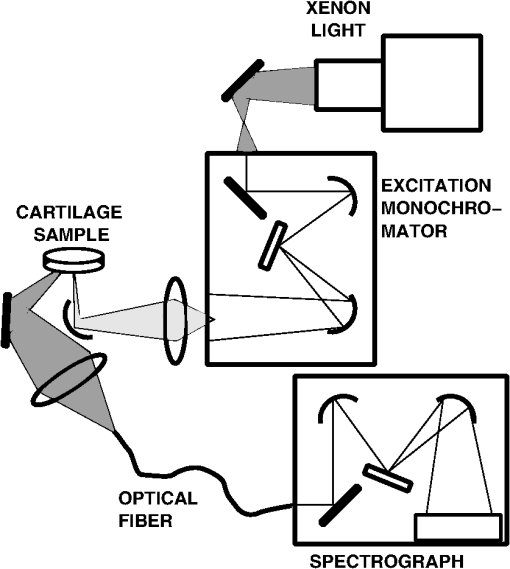 After thawing, the samples were kept moist and placed on top of an ultraviolet fused silica plate that was facing down on a droplet of the control liquid. The measurement was conducted from below. To compensate for the spectral and temporal changes of the light source, and to calculate the bispectral radiance factor,19 a non fluorescent reference material (SRS-02-010, Labsphere, Inc., North Sutton, NH) was measured sequentially along the samples. Each measurement took approximately 10 min. The reference was not immersed, but measured through the identical silica plate as the sample. The bispectral radiance factor of the liquid was subtracted from the measurement of each sample. The calculations were made using MATLAB (R2010a, MathWorks Inc., Natick, MA). 2.3.Analysis of Collagen Content and Cross-LinksThe samples were weighed, lyophilized, and weighed again to determine the water content of the cartilage. HP, LP, and Pent were assessed using the HPLC methodology presented in more detail in a previous study.20 Shortly, dried samples were acid hydrolyzed, evaporated, and dissolved into water. A single reversed-phase HPLC run was used to record the intrinsic fluorescence of the HP, LP, and Pent. The fluorescence at (excitation/emission) was used for HP and LP, and at to measure Pent. One additional run at was also made for Pent to find out whether its fluorescence can be excited in that range21 where the Pent absorption is known to be high.22 The cross-links were quantitated against pure standard compounds with known concentrations.9 The collagen concentration was calculated with the aid of hydroxyproline, the collagen specific amino acid, which was assessed spectrophotometrically.23 Pentosidine concentrations are expressed as mmol/mol collagen and HP and LP as mol/mol collagen. The HPLC system in use included a Quaternary Gradient Pump unit, PU-2089 Plus, an Intelligent Autosampler AS-2057 Plus, and an Intelligent Fluoresence Detector, FP-2020 by Jasco (Jasco Scandinavia AB, Mölndal, Sweden). The HPLC data was processed with Jasco Chrompass software (Jasco, Sweden). The LiChroCART® 125-4 column was from Merck Hitachi (Merck KGaA, Darmstadt, Germany). 2.4.Statistical AnalysisThe optical and biochemical parameters were mostly non-normally distributed. Therefore, correlations between the parameters were calculated by using the Spearman correlation analysis. The Wilcoxon Signed Rank test (for the 40 h group with dependent samples) and the Mann–Whitney U-test (for the 100 h group with independent samples) were used to evaluate the significance of the difference between the parameters of the control samples and the samples with threose treatments. The limit for statistically significant difference was set to . All the statistical analyses were conducted using MATLAB (R2010a, MathWorks Inc., Natick, MA). 3.ResultsThe thickness and water content showed no significant differences after the threose treatment. The Pent and LP concentrations, both normalized to collagen, increased significantly () with the time of incubation in threose (Table 1). The collagen concentration decreased during the threose incubation, and after 100 h, it was significantly () lower than that in the control group (Table 1). The changes in HP concentration increased significantly () during the 40 h threose treatment. However, the difference was insignificant after the 100 h treatment (Table 1). Table 1Cartilage thickness, water content, collagen concentration, and pentosidine, hydroxylysyl pyridinoline (HP), and lysyl pyridinoline (LP) concentrations (all three normalized to collagen) in the control samples and in the samples with 40 h and 100 h threose treatments. The pentosidine concentration in control samples was below the detection limit 0.004 mmol/mol.
bold p<0.01 compared to control samples, Wilcoxon Signed Rank test (for 40 h) or Mann–Whitney U-test (for 100 h). After the acquisition of the fluorescence EEMs, the fluorescence of the immersion liquid was subtracted and the EEMs were normalized by the wet weight of the samples. In order to show the wavelengths with specific changes after the threose treatment, the mean of the EEMs of the control samples was subtracted from the mean of the EEMs of the samples after the 40 and 100 h threose treatments (Fig. 2). In the threose treated samples, the fluorescence was found to increase in the visible range when excited at 400 nm (the characteristic AGE fluorescence) and at 490 nm (Fig. 2 and Table 2). In the ultraviolet band, excitations at 330 nm and 280 nm or below the fluorescence were reduced by more than 50%, as compared to the control (Table 2). Fig. 2Mean excitation-emission matrix (EEM) of the threose treated [(a) 40 h treatment, and (b) 100 h treatment, ] samples, with the mean EEM of the control samples () subtracted. The dashed lines denote the intersections used in the present study. The fluorescence at wavelengths above 650 nm is minimal, and the data is not presented. 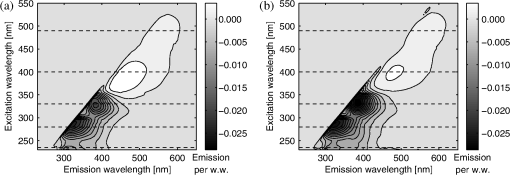 Table 2Total fluorescence emission (sum of the rows in the excitation-emission matrix) of control samples and samples with 40 or 100 h threose (THR) treatments. Excitation at wavelengths 235, 280, 330, 400, and 490 nm were selected.
bold p<0.01 compared to control samples, Wilcoxon Signed Rank test (for 40 h) or Mann–Whitney U-test (for 100 h). Significant correlations were found between the fluorescence parameters and the Pent or LP concentrations [Figs. 3(a) and 4]. Furthermore, the concentrations of Pent and LP were also significantly correlated [Fig. 3(b)]. Based on the local maximum correlations found at 235 and 330 nm (Fig. 3), they were selected as the wavelengths of interest (Table 2 and Figs. 4 and 5). The HP concentration was more weakly related with the EEM data, as evidenced by a lower correlation (the best was at , , ). The threose-induced changes in the fluorescence emissions in Pent and LP are similar at excitation wavelengths of 235 and 330 nm (Fig. 4). Fig. 3(a) Correlations between the pentosidine (Pent., dotted line) or lysyl pyridinoline (LP, solid line) concentrations and sums of rows in excitation-emission matrix when excited (ex., no marker) or column when emitted (em., with markers) at different wavelengths (the emission of the control immersion liquid was first subtracted). The horizontal lines highlight the maximum correlation coefficients found in one individual element of EEM. (b) Correlation between the Pent and LP concentrations in all samples (control, ; THR 40 h, ; THR 100 h, ). The best fit line is for illustration only. 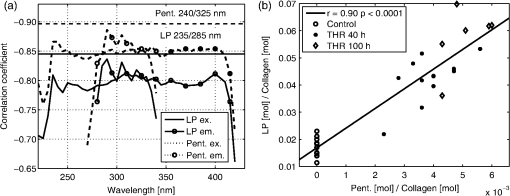 Fig. 4Correlations between the pentosidine [Pent., (b) and (d)] or lysyl pyridinoline [LP, (a) and (c)] concentrations and sums of row in EEM when excited at wavelengths 235 nm [(a) and (b)] or 330 nm [(c) and (d)] in all samples (control; ; THR 40 h; and THR 100 h; ). The best fit lines are for illustrations only. 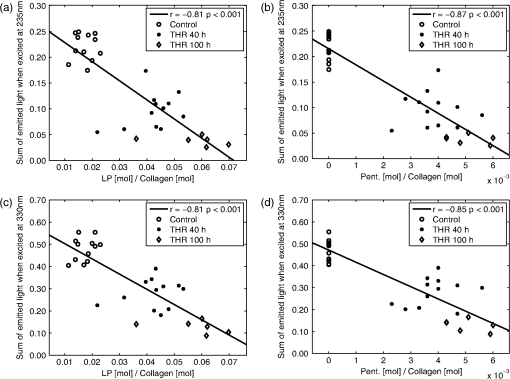 Fig. 5Mean fluorescence emission at one excitation wavelength in the control samples () and samples after threose treatment (THR 40 h; and THR 100 h; ). Excitations at wavelengths of 235, 280, 330, 400, and 490 nm were selected. The peaks in the two bottom plots are remnants of the Rayleigh scattering. 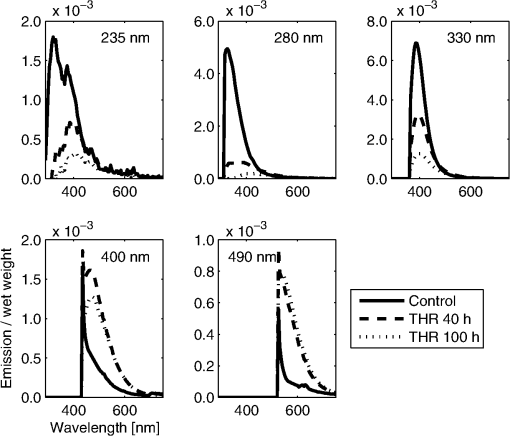 The emission spectra, excited at 330, 400, and 490 nm, showed a single fluorescence emission. At 330 nm excitation, the emission decreased with the incubation time in threose (Fig. 5). At 400 and 490 nm excitations, the threose treatment generated a fluorescence emission at 500 to 600 nm. When excited at 235 nm, the emission spectrum had two emission maxima, at approximately 330 and 400 nm. The 330 nm emission was dominant in the control samples. It decreased more rapidly than the 400 nm emission during the threose incubation, and after 40 h of incubation, the dominant emission was at 400 nm (Fig. 5). A similar trend, but not as clear, was also present when excited at 280 nm. 4.DiscussionIn the present paper, we investigated the feasibility of nondestructive evaluation of changes in cartilage cross-link concentration using intrinsic fluorescence measurements. Advantageously, the approach could allow a fast assessment of cross-links in intact cartilage. The changes in cross-link concentration were induced by threose treatments for 40 or 100 h and verified by HPLC analyses. We found that the increases in Pent and pyridinoline cross-link levels were significantly accompanied by the changes in fluorescence, as easily assessed by using individual excitation/emission pairs or sum of rows in the EEMs. Furthermore, complex fluorescence patterns related to the increase in AGEs after threose treatment were revealed. The Pent and LP concentrations were significantly inter-related after threose treatments. As their fluorescences overlapped, we could not effectively separate their individual contributions to the fluorescence signal. The measured EEMs of intact bovine articular cartilage were similar to those found earlier for human articular cartilage.24 The intrinsic fluorescence, when excited at wavelengths 400 or 490 nm, increased during threose treatment. The 400 nm light is known to excite the characteristic fluorescence of AGEs12 (usually ). Earlier, Nagaraj and Monnier25 generated fluorescent AGE compounds by incubating lens crystallins and ribonuclease A in L-threose. The time-dependent variations in fluorescence, similar to our findings, were related to FTP. After three days of treatment, the fluorescence started to decrease and then rose again.25 In the present study, the other increased fluorescence (excited at 490 nm) corresponds well with the fluorescence measured for bovine articular cartilage powder by Richards-Kortum and Sevick-Muraca.26 A similar fluorescence over 500 nm has been reported for human AGE modified collagen.15 In the present study, none of the fluorescence excited above a wavelength of 350 nm were significantly related with the changes in the Pent concentration. Therefore, the increased fluorescence in the visible range could not be used to estimate the cross-links of interest. The Pent concentration increased and the LP concentration was more than three times higher than that in the control samples after the 100 h threose treatment (Table 1). Surprisingly, the fluorescence emission at 380 to 400 nm, which has been related to pyridinoline and Pent, decreased during the threose treatment. This reduction of fluorescence may result from a decrease in the other fluorescent compounds, such as DDP (emission max. 395 nm10). Furthermore, after accumulation of AGE products, the diminished fluorescence may relate to an increased absorption that overruns the possible Pent and LP emissions. The Pent and the pyridinoline have their absorption maxima at the wavelengths below 350 nm7,22 When excited at 235 nm, the two emission maxima (350 and 400 nm) decrease at different rates during cross-link formation, consistent with the absorption curves.7,22 Unfortunately, the present data did not let us link the reduction of the fluorescence specifically to potential changes in cross-link absorption or to biochemical changes in tissue composition. The contributions of the Pent and LP absorptions could be evaluated, e.g., by using tissue phantoms with natural fluorophores and variable concentrations of Pent and LP. An additional Monte Carlo simulation of photon interactions in such phantoms could provide deeper insights into the role of Pent and LP absorption. These evaluations will be extensive and must be left for future work. The highest association between the fluorescence and the change in Pent concentration (, ) was found at . By using the sum of the emissions when excited at 235 or 330 nm, correlations of , , and , , respectively, were obtained. The corresponding values for LP were , (best at ), , (excitation 235 nm), and , (excitation 330 nm). As the LP and Pent concentration were highly interrelated in the samples (, ) and the fluorescence of LP and Pent overlap, it was not possible to identify specifically LP or Pent by the methods used. We performed one additional HPLC run at , i.e., using the Pent emission wavelengths. The fluorescence increased when excited around 250 nm (Fig. 2). The HPLC confirmed that the fluorescence was not related to pentosidine. We also performed a linear regression analysis to find the specific EEM elements that best represented either Pent or LP. That approach was not successful, either. The close interrelation between the LP and Pent concentrations after threose treatments is not typical of human articular cartilage during aging. In humans, the Pent concentration increases linearly after the age of 18 years, whereas the LP and HP concentrations remain nearly constant during aging.27 The mean concentration of Pent after 100 h of threose treatment ( of collagen) corresponds to that of 20 to 30 years old human cartilage.27 The LP concentration, both in the control and the treated samples, was smaller by an order of magnitude than the HP concentration. Therefore, in the present study, the impact of LP on the optical properties of the cartilage was probably minor compared to that of the total pyridinoline. Both the EEM and HPLC methods detect the intrinsic fluorescence of articular cartilage. When determining the collagen cross-links by the HPLC method, noncollagenous materials are removed by hydrolysis.9 An additional pepsin digestion in acetic acid can be used.28 This reduces the amount of fluorescent compounds in articular cartilage. Advantageously, the detection of the cross-link fluorescence in HPLC is performed after the compounds are separated chromatographically. The EEM method presented here instead detects all the fluorescent compounds in intact articular cartilage. When the emissions of different compounds overlap extensively, it is difficult to separate the signals related to the individual tissue components. Possibly, more rigorous data analysis or a time-resolved fluorescence detection could be used to separate the overlapping fluorescences. Interestingly, Elson et al.29 reported differences in fluorescence lifetime images between healthy and diseased human articular cartilage. In the present study, as in any study, there are limitations in the analysis and to the generalization of the results. The fluorescence matrices were normalized by the sample wet weight, and as the water content varied among samples, this can affect the relationship between the calculated optical parameters and the reference parameters. We also calculated the results after normalizing by tissue dry weight. This made no significant changes in the results, and the conclusions of the study were the same. Another limitation is the lack of the 100 h control group for 100 h threose treatment. In our earlier study with similar samples and treatments for six days,6 the properties in the control samples were nearly similar to our 40 h control group. Only the HP concentrations were higher, and we find the comparison of the 100 h threose treated samples with the 40 h control samples feasible. In summary, we increased the collagen cross-linking of bovine articular cartilage in vitro. The cross-link related fluorescence was assessed using a bispectrometer, and the measurements were compared with the HPLC analysis. New fluorescence compounds were observed in the tissue, however, the wavelengths with reduced intrinsic fluorescence were significantly related to the accumulation of pentosidine or of LP. Based on the present results, measurement of the whole EEM is not necessary, but the sum of the emissions at single wavelength excitations can be easily realized with a narrow band light and a broad band detector. Such a realization could result in fast, nondestructive estimation of cross-link changes, even though a completely specific analysis may be challenging. AcknowledgmentsStrategic funding of the University of Eastern Finland is gratefully acknowledged. Also, the financial support from the Ministry of Education, Finland (University of Eastern Finland grant, projects 5741/Kuopio and 10102/Joensuu), Sigrid Juselius Foundation, and the Kuopio University Hospital (EVO project 5041715/CT-rustokuvannus) is acknowledged. The authors wish to thank MSc Yevgeniya Kobrina for her help during the optical measurements, MSc Hannu Karjalainen for his help in the sample weighing, and Mrs Kaisa-Leena Tulla in conducting the HPLC analyses. ReferencesA. D. PearleR. F. WarrenS. A. Rodeo,
“Basic science of articular cartilage and osteoarthritis,”
Clin. Sports Med., 24
(1), 1
–12
(2005). http://dx.doi.org/10.1016/j.csm.2004.08.007 0278-5919 Google Scholar
N. Verzijlet al.,
“Effect of collagen turnover on the accumulation of advanced glycation end products,”
J. Biol. Chem., 275
(50), 39027
–39031
(2000). http://dx.doi.org/10.1074/jbc.M006700200 0021-9258 Google Scholar
N. Verzijlet al.,
“AGEing and osteoarthritis: a different perspective,”
Curr. Opin. Rheumatol., 15
(5), 616
–622
(2003). http://dx.doi.org/10.1097/00002281-200309000-00016 CORHES 1040-8711 Google Scholar
A. C. Chenet al.,
“Induction of advanced glycation end products and alterations of the tensile properties of articular cartilage,”
Arthrits. Rheum., 46
(12), 3212
–3217
(2002). http://dx.doi.org/10.1002/(ISSN)1529-0131 ARHEAW 0004-3591 Google Scholar
N. Verzijlet al.,
“Crosslinking by advanced glycation end products increases the stiffness of the collagen network in human articular cartilage: a possible mechanism through which age is a risk factor for osteoarthritis,”
Arthritis. Rheum., 46
(1), 114
–123
(2002). http://dx.doi.org/10.1002/(ISSN)1529-0131 ARHEAW 0004-3591 Google Scholar
H. T. Kokkonenet al.,
“Computed tomography detects changes in contrast agent diffusion after collagen cross-linking typical to natural aging of articular cartilage,”
Osteoarthr. Cartil., 19
(10), 1190
–1198
(2011). http://dx.doi.org/10.1016/j.joca.2011.07.008 OSCAEO 1063-4584 Google Scholar
D. Fujimoto,
“Isolation and characterization of a fluorescent material in bovine achilles tendon collagen,”
Biochem. Biophys. Res. Commun., 76
(4), 1124
–1129
(1977). http://dx.doi.org/10.1016/0006-291X(77)90972-X BBRCA9 0006-291X Google Scholar
M. Saito,
“Single-column high-performance liquid chromatographicfluorescence detection of immature, mature, and senescent cross-links of collagen,”
Anal. Biochem., 253
(1), 26
–32
(1997). http://dx.doi.org/10.1006/abio.1997.2350 ANBCA2 0003-2697 Google Scholar
R. A. Banket al.,
“Sensitive fluorimetric quantitation of pyridinium and pentosidine crosslinks in biological samples in a single high-performance liquid chromatographic run,”
J. Chrom. B Biomed. Sci. Appl., 703
(1–2), 37
–44
(1997). http://dx.doi.org/10.1016/S0378-4347(97)00391-5 0378-4347 Google Scholar
H. K. GahuniaR. ViethK. Pritzker,
“Novel fluorescent compound (DDP) in calf, rabbit, and human articular cartilage and synovial fluid,”
J. Rheumatol., 29
(1), 154
–160
(2002). JRHUA9 0315-162X Google Scholar
J. DeGrootet al.,
“Accumulation of advanced glycation endproducts reduces chondrocyte-mediated extracellular matrix turnover in human articular cartilage,”
Osteoarthr. Cartil., 9
(8), 720
–726
(2001). http://dx.doi.org/10.1053/joca.2001.0469 OSCAEO 1063-4584 Google Scholar
D. M. SaudekJ. Kay,
“Advanced glycation endproducts and osteoarthritis,”
Curr. Rheumatol. Rep., 5
(1), 33
–40
(2003). http://dx.doi.org/10.1007/s11926-003-0081-x 1523-3774 Google Scholar
N. Verzijlet al.,
“Age-related accumulation of maillard reaction products in human articular cartilage collagen,”
Biochem. J., 350 380
–387
(2000). http://dx.doi.org/10.1042/0264-6021:3500381 0264-6021 Google Scholar
D. R. SellV. M. Monnier,
“Structure elucidation of a senescence cross-link from human extracellular matrix: implication of pentoses in the aging process,”
J. Biol. Chem., 264
(36), 21597
–21602
(1989). 0021-9258 Google Scholar
G. J. Gibsonet al.,
“Degradation of the cartilage collagen matrix associated with changes in chondrocytes in osteoarthrosis: assessment by loss of background fluorescence and immunodetection of matrix components,”
J. Orthop. Res., 19
(1), 33
–42
(2001). http://dx.doi.org/10.1016/S0736-0266(00)00008-5 0736-0266 Google Scholar
M. Handlet al.,
“Fluorescent advanced glycation end products in the detection of factual stages of cartilage degeneration,”
Physiol. Res., 56
(2), 235
–242
(2007). PHRSEJ 0862-8408 Google Scholar
M. M. Temple-Wonget al.,
“Biomechanical, structural, and biochemical indices of degenerative and osteoarthritic deterioration of adult human articular cartilage of the femoral condyle,”
Osteoarthr. Cartil., 17
(11), 1469
–1476
(2009). http://dx.doi.org/10.1016/j.joca.2009.04.017 OSCAEO 1063-4584 Google Scholar
C. G. ArmstrongV. C. Mow,
“Variations in the intrinsic mechanical properties of human articular cartilage with age, degeneration, and water content,”
J. Bone Joint Surg. Am., 64
(1), 88
–94
(1982). 0021-9355 Google Scholar
“Physical measurement of light and radiation,”
Calibration Methods and Photoluminescent Standards for Total Radiance Factor Measurements,
(2007). Google Scholar
M. Kongsgaardet al.,
“Corticosteroid injections, eccentric decline squat training and heavy slow resistance training in patellar tendinopathy,”
Scandin. J. Med. Sci. Sports, 19
(6), 790
–802
(2009). Google Scholar
J. Kinnunenet al.,
“Collagen cross-link modified fluorescence excitation-emission matrix of articular cartilage,”
III Topical Problems of Biophotonics 2011, 59
–60 St. Petersburg-Nizhny Novgorod, Russia
(2011). Google Scholar
D. Slowikzlkaet al.,
“A sensitive and specific HPLC method for the determination of total pentosidine concentration in plasma,”
J. Biochem. Biophys. Method, 61
(3), 313
–329
(2004). http://dx.doi.org/10.1016/j.jbbm.2004.06.002 JBBMDG 0165-022X Google Scholar
L. B. Creemerset al.,
“Microassay for the assessment of low levels of hydroxyproline,”
BioTechniques, 22
(4), 656
–658
(1997). BTNQDO 0736-6205 Google Scholar
K. B. McGowanet al.,
“Biochemical quantification of DNA in human articular and septal cartilage using picogreen and hoechst 33258,”
Osteoarthr. Cartil., 10
(7), 580
–587
(2002). http://dx.doi.org/10.1053/joca.2002.0794 OSCAEO 1063-4584 Google Scholar
R. NagarajV. M. Monnier,
“Protein modification by the degradation products of ascorbate: formation of a novel pyrrole from the maillard reaction of l-threose with proteins,”
Biochim. Biophys. Acta. Protein Struct. Mol. Enzymol., 1253
(1), 75
–84
(1995). http://dx.doi.org/10.1016/0167-4838(95)00161-M 0167-4838 Google Scholar
R. Richards-KortumE. Sevick-Muraca,
“Quantitative optical spectroscopy for tissue diagnosis,”
Annu. Rev. Phys. Chem., 47 555
–606
(1996). http://dx.doi.org/10.1146/annurev.physchem.47.1.555 ARPLAP 0066-426X Google Scholar
R. A. Banket al.,
“Ageing and zonal variation in post-translational modification of collagen in normal human articular cartilage: the age-related increase in non-enzymatic glycation affects biomechanical properties of cartilage,”
Biochem. J., 330 345
–351
(1998). 0264-6021 Google Scholar
A. Uchiyamaet al.,
“Fluorophores from aging human articular cartilage,”
J. Biochem., 110
(5), 714
–718
(1991). JOBIAO 0021-924X Google Scholar
D. S. Elsonet al.,
“Multidimensional fluorescence imaging applied to biological tissue,”
Reviews in Fluorescence 2006, 477
–524 Springer US, Boston, MA
(2006). Google Scholar
|
||||||||||||||||||||||||||||||||||||||||||||||||||||||||||

