
|
|
1.IntroductionIntravital microscopy allows studies of molecular and cell biology to move from cell culture settings to living animal models of normal physiology, disease pathogenesis, and therapy.1–3 These studies continue to provide new, unexpected insights into dynamics of cell trafficking, spatial and temporal changes in gene expression, and heterogeneity of signal transduction.4–7 In particular, intravital microscopy has the advantage of analyzing these processes at single cell resolution, unlike whole body imaging techniques that detect responses in large populations of cells. Several different imaging technologies have been used for intravital microscopy. However, multiphoton microscopy using excitation light from femtosecond pulsed, near-infrared lasers has become the preferred method for microscopy in vivo because of increased imaging depth and reduced background signals relative to methods such as confocal microscopy.8 Intravital multiphoton microscopy commonly uses genetically encoded fluorescent proteins to investigate molecular and cellular pathways and track populations of cells over time in animals. Within the past decade, investigators have dramatically expanded the palette of fluorescent proteins beyond green fluorescent protein to generate molecules ranging from blue to near-infrared variants of different chromophore structures.9–11 Even for a general spectral category, such as orange and red fluorescent proteins, there are multiple variants that differ by properties including excitation and emission maxima, quantum yield, and relative brightness. The large number of fluorescent proteins provides new opportunities for multi-spectral imaging studies in vivo. However, the diversity of fluorescent proteins also complicates selection of proteins that can be detected independently with minimal or no cross talk, particularly when combining multiple colors. Ideally, combinations of fluorescent proteins could be excited with no or minimal requirement to change wavelengths of excitation light, since many two photon microscope systems have only a single near infrared laser. The time required to switch between different excitation wavelengths with a single laser may impede real time imaging of dynamic processes. Previous studies have analyzed two photon absorption profiles of isolated, purified fluorescent proteins in solution.12–14 While this design enhances control of experimental conditions, analyses of isolated proteins do not reproduce complexities of protein expression, autofluorescence, and other tissue properties in intact cells and living animals.15 To improve selection of sets of fluorescent proteins for multicolor imaging studies, we expressed 18 different fluorescent proteins in mammalian cells and characterized emission intensities of these proteins in three different detection channels (blue, green, and red) across a range of excitation wavelengths (690 to 1040 nm) commonly used for multiphoton microscopy. We also used intravital microscopy to measure two photon excitation-fluorescence emission profiles of a subset of fluorescent proteins expressed in breast cancer cells in an orthotopic mouse xenograft model. These studies inform and direct choices of fluorescent proteins for in vivo imaging studies by multiphoton microscopy. 2.Materials and Methods2.1.Cell CulturesHuman embryonic kidney 293T cells (Open Biosystems) and MDA-MB-231 human breast cancer cells (ATCC) were cultured in DMEM (Life Technologies, Carlsbad, CA) with 10% fetal bovine serum (Hyclone Thermo Fisher Scientific, Waltham, MA), 1% glutamine, and 0.1% penicillin and streptomycin. 2.2.Fluorescent Proteins and PlasmidsWe used plasmids for the following fluorescent proteins: mTagBFP, EBFP, ECFP, cerulean, mTurquoise (gift of Joachim Goedhart), EGFP, AcGFP, YFP, citrine; mOrange2, TagRFP-T, tdTomato, mCherry, mPlum (gifts of Roger Tsien); mKate2, katushka, FP650, and mNeptune (gifts of Dmitriy Chudakov).16–27 All plasmids used a CMV promoter to drive expression of fluorescent proteins. Spectral properties of fluorescent proteins used in this study are shown in Table 1. Table 1Spectral properties of fluorescent proteins used in this study.
2.3.DNA Transfection and Lentiviral TransductionWe transiently transfected 293T cells with plasmids for various fluorescent proteins using calcium phosphate precipitation as described previously.28 All transfections were performed with the same amount of plasmid DNA (0.5 µg) per well in 12 well plates. We prepared lentiviral vectors for mTagBFP, mTurquoise, citrine, mOrange2, and mCherry by transient transfection of 293T cells.29 Lentiviruses were used to stably transduce different populations of MDA-MB-231 cells with these fluorescent proteins. 2.4.Cell-Based Imaging293T cells expressing fluorescent proteins were transferred to 35 mm dishes one day following transfection and used for imaging experiments the next day. As a control for cellular autofluorescence, we also used mock-transfected cells that did not express a fluorescent protein. For imaging studies, cells were switched to modified Earle’s balanced salt solution (MEBSS)30 and placed on a warming plate (Tokai Hits, MATS-U5050S) set to 37°C. We used a FV1000 MPE Twin system (Olympus) for microscopy. The system has a Mai-Tai DeepSee laser (Spectra-Physics) with tuning range from 690 to 1040 nm. All imaging was performed with a , 1.05 NA, water immersion objective (Olympus). To generate excitation spectral profiles for various fluorescent proteins, we increased the wavelength of excitation light by 10 nm increments between 690 and 1040 nm. Over this range, power at the laser source decreased from 3.2 to 1 W. The percent of laser power delivered to the cell sample was held constant over the full range of excitation wavelengths for a given fluorescent protein with values typically at 4% to 6%. Emission light was separated by dichroic mirrors into three detection channels: 1. 420 to 460 nm; 2. 495 to 540 nm; and 3. 575 to 630 nm. Percent of laser power delivered to samples and detector settings were adjusted minimally to avoid saturated pixels and reduce background noise for each experiment, and these settings remained constant for a given fluorescent protein. We quantified data for fluorescence intensity in each detection channel at individual excitation wavelengths by region of interest analysis (Fluoview software, Olympus), and we normalized fluorescence intensity measurements to account for differences in laser power at each wavelength. Background fluorescence intensity was 100 to 120 units for all experiments. We graphed mean values for normalized fluorescence intensity for each fluorescent protein ( cells per fluorescent protein). 2.5.Intravital MicroscopyThe University of Michigan Committee for Care and Use of Animals approved all animal studies. MDA-MB-231 breast cancer cells were implanted orthotopically into the 4th inguinal mammary fat pads of NOD/SCID mice (Taconic).31 We performed intravital microscopy when tumors reached approximately 4 to 5 mm diameter, which occurred two to three weeks after implantation for all studies. We anesthetized mice with 1% to 2% isoflurane and maintained mice on 0.5% to 1% isoflurane throughout the procedure. We surgically exposed the mammary fat pad tumor with minor modifications of a previously described protocol.8 Briefly, we incised the abdominal skin without disturbing the underlying peritoneal membrane or internal abdominal organs. We rotated a skin flap containing the intact mammary fat pad tumor xenograft away from the abdomen to minimize transmitted respiratory motion and pinned the skin flap to a 3 to 4 mm thick piece of polydimethylsiloxane (PDMS). We glued a 2 to 3 mm thick ring of PDMS around the exposed tumor to contain sterile phosphate buffered saline as an aqueous interface for the microscope objective. We covered the exposed skin surface and peritoneal membrane with sterile 0.9% saline. We placed mice directly on a 37°C warming plate for imaging procedures. At the end of imaging, we closed the surgical incision with sterile wound clips. We acquired images near the center of each tumor in the - plane at -axis depths listed in figure legends. We imaged each tumor with a range of excitation profiles as described for cell-based imaging studies and quantified fluorescence intensity from individual MDA-MB-231 cells by region of interest analysis as described above. For analyses of fluorescence from mTurquoise and mOrange2 proteins in tumor xenografts, we corrected fluorescence intensity for differences in laser output at 760, 770, and 780 nm and then normalized values for each cell to the value obtained at 760 nm. 3.Results3.1.Live Cell ImagingTo optimize selection of fluorescent proteins for multi-color two photon microscopy in living cells, we transiently transfected 293T cells with 18 different fluorescent proteins with emissions ranging from blue to far red. We selected 293T cells for these experiments because these cells transfect readily, allowing us to efficiently test a large series of fluorescent proteins. For blue and cyan fluorescent proteins, we analyzed mTagBFP, EBFP, ECFP, cerulean, and mTurquoise, respectively. For 420 to 460 nm emitted light, mTagBFP was excited effectively with a broad range of light ranging from 700 to 890 nm, peaking at 760 to 810 nm [Fig. 1(a)]. EBFP and mTurquoise also emitted readily detectable fluorescence in the 420 to 460 nm detection channel. Both proteins showed peak fluorescence with 800 to 810 nm excitation, and fluorescence from mTurquoise was produced by excitation wavelengths up to 920 nm. All proteins produced fluorescence in the 495 to 540 nm detection channel with a rank order of fluorescence intensity of [Fig. 1(b)]. Peak fluorescence emission for all proteins occurred with 800 to 810 nm excitation, and mTagBFP, mTurquoise, and ECFP were excited by wavelengths up to 900 nm. There was substantially reduced light in the 575 to 630 nm range for all five proteins, although both mTagBFP and mTurquoise produced detectable light above background signal in this detection channel [Fig. 1(c)]. Fig. 1Two photon excitation wavelengths and fluorescence emission intensities of blue and cyan fluorescent proteins expressed in 293T cells. Fluorescence intensities were measured by region of interest analysis of light detected at (a) 420 to 460 nm, (b) 495 to 540 nm, and (c) 575 to 630 nm. Panel d shows autofluorescence intensities in the same three detector channels from mock-transfected 293T cells not expressing a fluorescent protein.  We also measured autofluorescence from mock-transfected cells that did not express a fluorescent protein. Cellular autofluorescence peaked at 750 nm excitation with comparable emissions in 420 to 460 and 495 to 540 nm channels and relatively less fluorescence detected at 570 to 630 nm. This autofluorescence profile previously has been attributed to emission from pyridine nucleotides NAD(P)H.32 Fluorescence emission from mTagBFP at 420 to 460 nm was substantially higher than autofluorescence at 750 nm excitation. For other blue and cyan fluorescent proteins, fluorescence emission in the 420 to 460 nm channel was minimally above background autofluorescence intensity, but these proteins were clearly detectable above background in the 495 to 540 channel except for cerulean. Using selected variants of green and yellow fluorescent proteins (EGFP, AcGFP, citrine, and YFP), only EGFP with 700 to 800 nm two photon excitation produced light detectable in the 420 to 460 nm channel [Fig. 2(a)]. The 420 to 460 nm light from EGFP was maximal at 750 nm excitation. As expected, fluorescence from these proteins was detected best at 495 to 540 nm with relative maximum fluorescence intensities of [Fig 2(b)]. Two photon excitation from 750 to 920 nm produced relatively uniform, high level fluorescence from EGFP, while AcGFP was excited by a narrower range of laser light between 800 and 920 nm. Citrine and YFP also were excited by a wide range of two photon laser light from 750 to 950 nm, albeit producing lower intensities of fluorescence than EGFP or AcGFP. We also detected fluorescence emission from EGFP and AcGFP at 575 to 630 nm using excitation wavelengths comparable to those measured for emission between 495 to 540 nm [Fig. 2(c)]. Fig. 2Fluorescence intensity measurements for green and yellow fluorescent proteins imaged in intact 293T cells in response to a range of two photon excitation wavelengths. Intensity measurements were recorded in detector channels for light emission at (a) 420 to 460 nm, (b) 495 to 540 nm, and (c) 575 to 630 nm. 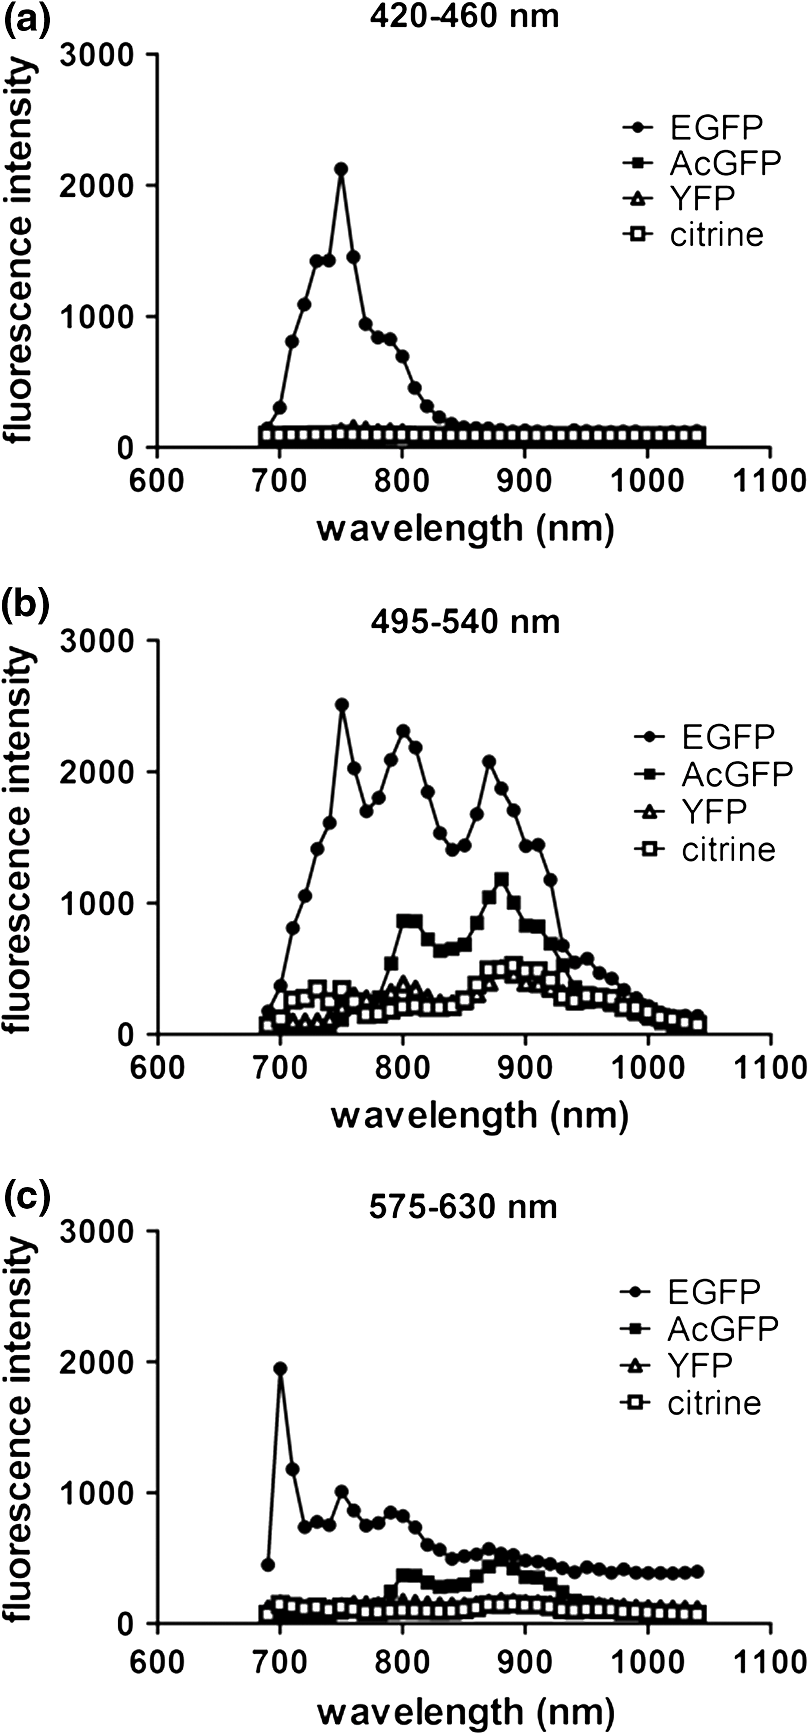 Recent studies have developed several fluorescent proteins with red and far red emissions to capitalize on enhanced transmission of these wavelengths of light through tissues.25,27,33 We analyzed several of these new fluorescent proteins (mOrange2, tdTomato, TagRFP-T, mCherry, katushka, mKate2, mPlum, mNeptune, eqFP650) in living 293T cells. Only mOrange2 produced minimal fluorescence emissions at 420 to 460 nm and 495 to 540 nm, respectively, with peak fluorescence intensity produced by 800 nm laser excitation [Fig. 3(a) and 3(b)]. tdTomato and mKate2 also produced modest fluorescence emission in the 495 to 540 nm channel with two photon excitation at 800 nm (tdTomato) and 880 nm (tdTomato and mKate2). Under our experimental conditions, all of the tested red and far red fluorescent proteins produced 575 to 630 nm light following two photon excitation with 760 to 780 nm laser light [Fig. 3(c)]. At these excitation wavelengths, mKate2 produced notably higher fluorescence intensity at 575 to 630 nm than other fluorescent proteins. These data reproduce observations made with purified red fluorescent proteins showing efficient two photon excitation at relatively shorter wavelengths due to higher energy transitions.34 mKate2 also showed a second peak of higher fluorescence emission when excited from 870 to 960 nm, and this protein was detected readily above background through 1040 nm. Similar to results in the 495 to 540 nm detection channel, tdTomato and mOrange2 also produced a second smaller peak of 575 to 630 nm fluorescence emission at 880 nm excitation. 3.2.Intravital MicroscopyDetection of fluorescent proteins by intravital microscopy is complicated by factors including autofluorescence, light scattering, and preferential transmission of longer wavelengths of light through tissue due to absorption by molecules including hemoglobin and lipids.35 To investigate effects of living tissue on two photon emission profiles of selected fluorescent proteins, we used an orthotopic tumor xenograft model of human breast cancer. For these experiments, we used MDA-MB-231 breast cancer cells, which have the advantage of efficiently forming orthotopic tumor xenografts in immunocompromised mice. We stably transduced MDA-MB-231 breast cancer cells with mTagBFP, mTurquoise, citrine, mOrange2, or mCherry, respectively. These proteins were selected as representative blue-cyan, green-yellow, and red fluorescent proteins that could enable multi-spectral imaging with minimal cross-talk between emission channels based on live cell imaging. We imaged orthotopic tumor xenografts containing MDA-MB-231-mTagBFP, MDA-MB-231-citrine, or MDA-MB-231-mCherry transduced cells at depths of 100, 150, and 200 µm below the tumor surface and measured fluorescence emissions in the same three detector channels used for cell-based imaging following two photon excitation from 690 to 1040 nm. For tumors with MDA-MB-231-mTagBFP cells, we detected fluorescence in all three emission channels when imaging 100 or 150 µm below the tumor surface [Fig. 4(a) and 4(b)]. Fluorescence was highest in the 420 to 460 nm detection channel, although substantial amounts of light also were detected in the longer wavelength channels. Similar to live cell imaging, two photon excitation at 800 nm produced the highest fluorescence emission at 420 to 460 nm. When imaging tumors at 200 µm depth, detected fluorescence was comparable in all three output channels. Since near infrared light used for excitation has greater tissue penetration than blue light, it is likely that the inability to detect mTagBFP at 200 µm depth is due to attenuation and scattering of emitted fluorescence rather than excitation light not reaching this protein [Fig. 4(c)]. Fig. 4Two photon intravital microscopy of orthotopic tumor xenografts of MDA-MB-231 breast cancer cells stably transduced with mTagBFP. Two photon excitation and fluorescence intensity measurements at (a) 420 to 460 nm, (b) 495 to 540 nm, and (c) 575 to 630 nm were measured at (a) 100, (b) 150, and (c) 200 µm depths within a tumor.  At 100 µm, tumors with MDA-MB-231-citrine cells predominantly produced fluorescence in the expected detection channel of 495 to 540 nm light [Fig. 5(a)]. Peak fluorescence emission occurred with 810 nm two photon excitation. With greater imaging depths, there was no change in wavelength of two photon laser light that produced peak fluorescence emission from MDA-MB-231-citrine cells [Fig. 5(b) and 5(c)]. However, relative differences between fluorescence emitted in the 495 to 540 nm versus 575 to 630 nm channels decreased on images obtained at 150 and 200 µm. Fig. 5Two photon excitation and three detector channel fluorescence intensity measurements of citrine stably expressed in MDA-MB-231 tumor xenografts. Measurements were obtained (a) 100, (b) 150, and (c) 200 µm below the tumor surface.  Tumors with MDA-MB-231-mCherry cells showed a similar pattern to MDA-MB-231-citrine tumors on progressively deeper images. We detected peak fluorescence from mCherry in the 575 to 630 nm detection channel using 760 nm two photon laser excitation on images obtained 100, 150, and 200 µm below the tumor surface [Fig. 6(a) to 6(c)]. Fluorescence emission at 575 to 630 nm was the predominant signal detected from MDA-MB-231-mCherry cells on images at 100 and 150 µm. At 200 µm, mCherry still produced highest fluorescence in the 575 to 630 nm detection channel, although signal intensity was only modestly higher than that detected in the other two detection channels. Fig. 6Fluorescence intensity measurements of mCherry in MDA-MB-231 tumor xenografts in response to a range of two photon excitation wavelengths. Fluorescence measurements at (a) 420 to 460 nm, (b) 495 to 540 nm, and (c) 575 to 630 nm were determined (a) 100, (b) 150, and (c) 200 µm below the tumor surface.  To illustrate dual color imaging and the trade-offs in measured fluorescence intensity produced by shifting excitation wavelengths, we implanted MDA-MB-231 cells expressing either mTurquoise or mOrange2 into the same tumor xenograft. Based on data from cell culture experiments, we focused on excitation wavelengths of 760 to 780 nm. At an imaging depth of 50 μm, increasing excitation wavelength from 760 to 780 nm significantly increased fluorescence intensity from mTurquoise in the 495 to 540 detection channel and decreased measured fluorescence output at 575 to 630 nm from cells expressing mOrange2, respectively ( and for 770 and 780 nm, respectively) [Fig. 7(a) and 7(b)]. Relative to fluorescence intensity measured at 760 nm excitation, fluorescence from mTurquoise increased by 55% and mOrange2 decreased by 20%, respectively. These results show that small increments in excitation wavelength produce notable changes in fluorescence emission from two different proteins used for intravital microscopy. Fig. 7Intravital microscopy of tumors comprised of MDA-MB-231 cells stably expressing mTurquoise or mOrange2. (a) Representative fluorescence images at 50 μm depth within a tumor showing fluorescence from mTurquoise (495 to 540 nm detection channel), mOrange2 (575 to 630 nm detection channel), and merged images at 760, 770, and 780 nm excitation. (b) Graph depicts for relative fluorescence intensity from each protein normalized to laser power output and fluorescence intensity at 760 nm excitation.…*, ; **, .  4.DiscussionOngoing development of fluorescent proteins presents new opportunities and challenges for advancing multi-spectral imaging of cellular and molecular events in intact cells and living animals.36,37 Fluorescent proteins with enhanced brightness and a wide range of colors enable increasingly sophisticated studies of protein dynamics and subcellular localization with two photon intravital microscopy.38,39 However, capitalizing on these opportunities requires detailed knowledge of two photon excitation profiles of fluorescent proteins to minimize cross-talk among emission outputs and understand how changes in excitation wavelength alter fluorescence output in vitro and in vivo. To advance applications of multiphoton microscopy for live cell imaging and intravital microscopy, we expressed a large number of commonly used fluorescent proteins in living cells and measured fluorescence emission in response to a wide range of two photon excitation wavelengths. Emitted light was separated into three commonly used detector channels for blue, green, and red light (420 to 460, 495 to 540, and 575 to 630 nm, respectively) to assess to what extent a single fluorescent protein was detected in single or multiple channels. Although not done in this study, our data could be used to direct selection of different dichroic mirrors to optimize detection and discrimination among desired combinations of fluorescent proteins. Among tested blue and cyan fluorescent proteins, mTagBFP produced substantially higher fluorescence when imaged in intact cells. This protein also was excited across a broader range of two photon laser wavelengths than EBFP, ECFP, cerulean, or mTurquoise, suggesting that it could be combined with red fluorescent proteins using 750 to 800 nm excitation. All of the tested blue and cyan fluorescent proteins could be detected in both 420 to 460 and 495 to 540 nm channels using two photon excitation wavelengths up to 900 nm, which would limit multi-spectral imaging with green or yellow fluorescent proteins unless a second two photon excitation wavelength is used. For green and yellow proteins tested in this study, EGFP had the highest fluorescence intensity across a broad range of two photon excitation wavelengths from 750 to 920 nm. While detected fluorescence from EGFP was greatest in the 495 to 540 nm channel, this protein produced substantial fluorescence at 420 to 460 nm when excited with two photon wavelengths . AcGFP and EGFP also had lesser amounts of fluorescence emission detected at 575 to 630 nm. While fluorescence intensity measured from citrine and YFP was lower than either AcGFP or EGFP, light emitted from the yellow proteins had the advantage of being detected only in the 495 to 540 nm channel. As described previously for purified proteins in solution, red fluorescent proteins expressed in cells showed two photon excitation at 750 to 760 nm.12,13,33 mKate2 showed the highest fluorescence intensity, while other red fluorescent proteins produced comparable fluorescence. mKate2 also produced fluorescence in response to the broadest range of two photon excitation. We predominantly detected the tested orange and red fluorescent proteins in the 575 to 630 nm channel. These excitation and emission properties of red fluorescent proteins enable multi-spectral imaging with blue and cyan proteins using a single excitation wavelength , as we demonstrated for intravital microscopy. Previous studies have shown that red and far red fluorescent proteins have both higher and lower energy transitions that produce fluorescence in response to short (700 to 800 nm) or long () two photon laser excitation, respectively.12,13,33 Due to the resonance enhancement effect, these shorter wavelength transitions may dominate the excitation profile and provide optimal excitation at wavelengths much shorter than predicted by single photon excitation profiles.40 For orange and red fluorescent proteins other than mKate2, we only detected light emission in response to two photon excitation at 750 to 800 nm. We likely did not identify fluorescence from longer wavelengths of laser light since we maintained a constant percentage of laser power delivered to cells or tissue across the full range of excitation wavelengths. The two photon laser used for this study produces less power at longer wavelengths, resulting in progressively lower power of excitation light delivered to the sample. This problem could be overcome by increasing the percentage of laser light output at longer wavelengths, although caution is required to avoid thermal damage to tissues if adjustments are not made properly when switching among different laser wavelengths and/or imaging depths. Fluorescent proteins are used extensively for extended tracking of cell populations, monitoring changes in gene expression, and analyzing protein localization by intravital, multiphoton microscopy.6,41,42 We generated orthotopic tumor xenografts of human breast cancer cells, a common model for intravital microscopy, and analyzed a subset of proteins with fluorescence emission predominantly in one of our three different detector channels. Peak excitation wavelengths for tested fluorescent proteins did not differ notably between isolated cells and intravital microscopy. However, in vivo imaging generally showed reduced selectivity for fluorescence emission restricted to the expected detector channel as compared with live cells, particularly for imaging cells deeper within tumors. Greater fluorescence in off-target channels likely is due to increased tissue autofluorescence in animal tissues as compared with isolated cells. We established feasibility of multispectral imaging in vivo combining a blue or cyan protein (mTurquoise) and an orange or red protein (mOrange2) with a single excitation wavelength as has been suggested based on a prior study with purified proteins.34 We also highlighted how small incremental changes in selected excitation wavelength significantly affect fluorescence emission from each protein. Results of the current study will inform selection of a single laser excitation wavelength for optimal detection of both blue and red fluorescent proteins, particularly for experiments in which one fluorescent protein is expressed at relatively lower levels. Our data also suggest pairing mTagBFP with mCherry or mKate2 for combined imaging of blue and red fluorescent proteins using a single excitation wavelength of 760 nm. Since fluorescence emission from citrine remains within the 495 to 540 nm detection channel, this protein could be added as a third marker in combination with mTagBFP and mCherry or mKate2. Relative to purified proteins, measuring responses of fluorescent proteins expressed in living cells to various wavelengths of two photon excitation is complicated by intrinsic fluorescence of intracellular molecules. Dinucleotides [nicotinamide adenine dinucleotide (NAD), flavin adenine dinucleotide (FAD)], derivatives of vitamins, and other molecules are excited by the range of two photon laser wavelengths used in this study and emit fluorescence from 400 to 600 nm.43 Typically, fluorescence from these molecules is weaker than fluorescent proteins. Intrinsic fluorescence contributes to background and may limit detection of fluorescent proteins in vivo, particularly if proteins are expressed at low levels. This problem may be mitigated by analyzing spatial localization of fluorescence within cells since endogenous fluorescence is not distributed uniformly throughout a cell, unlike the unfused fluorescent proteins we transiently or stably expressed in cells. However, discrimination between intrinsic fluorescence and fluorescent fusion proteins with restricted intracellular localization may be more challenging for imaging living cells and tissues. While intrinsic cellular fluorescence may account for apparent detection of some fluorescent proteins in multiple emission channels as quantified by region of interest analysis, this represents actual conditions encountered when measuring fluorescence signals in vivo. Another limitation of in vivo analysis of fluorescent proteins is potential differences in levels of expression in cells. To minimize this effect, we transfected cells under identical conditions, used the same strong CMV promoter to drive expression of transiently expressed fluorescent proteins, and quantified fluorescence intensity in multiple cells. Nevertheless, small differences in fluorescence intensity among fluorescent proteins could be due to variations in amounts of mature protein in separate sets of cells. In addition, levels of expression for fluorescent proteins stably expressed in MDA-MB-231 breast cancer cells are lower than those achieved by transient transfection of 293T cells, which diminishes target-to-background signal. Multiphoton microscopy has revolutionized imaging of intact tissues and living animal models of normal physiology and disease states. Since one of the main advantages of intravital microscopy is imaging the same subject over time, investigators commonly use fluorescent proteins to stably mark defined populations of cells or analyze cell signaling. Our measurements of two photon excitation and fluorescence profiles in intact cells and tissues complement prior studies of two photon absorption properties of isolated fluorescent proteins in solution. These data will advance selection of fluorescent proteins for multispectral, multiphoton microscopy in cells, tissues, and living animals. AcknowledgmentsThis work was supported by United States National Institutes of Health National Cancer Institute Grants R01CA136553, R01CA136829, R01CA142750, and P50CA093990. The authors thank James Lopez for helpful discussions. ReferencesR. Germainet al.,
“A decade of imaging cellular motility and interaction dynamics in the immune system,”
Science, 336
(6089), 1676
–1681
(2012). http://dx.doi.org/10.1126/science.1221063 SCIEAS 0036-8075 Google Scholar
E. Brownet al.,
“Dynamic imaging of collagen and its modulation in tumors in vivo using second-harmonic generation,”
Nat. Med., 9
(6), 796
–800
(2003). http://dx.doi.org/10.1038/nm879 1078-8956 Google Scholar
M. PittetR. Weissleder,
“Intravital imaging,”
Cell, 147
(5), 983
–991
(2011). http://dx.doi.org/10.1016/j.cell.2011.11.004 11CIAS Google Scholar
T. PhanA. Bullen,
“Practical intravital two-photon microscopy for immunological research: faster, brighter, deeper,”
Immunol. Cell Biol., 88
(4), 438
–444 http://dx.doi.org/10.1038/icb.2009.116 ICBIEZ 0818-9641 Google Scholar
V. Sanz-Morenoet al.,
“ROCK and JAK1 signaling cooperate to control actomyosin contractility in tumor cells and stroma,”
Cancer Cell, 20
(2), 229
–245
(2011). http://dx.doi.org/10.1016/j.ccr.2011.06.018 CCELER 1042-2196 Google Scholar
D. Kedrinet al.,
“Intravital imaging of metastatic behavior through a mammary imaging window,”
Nat. Methods, 5
(12), 1019
–1021
(2008). http://dx.doi.org/10.1038/nmeth.1269 1548-7091 Google Scholar
D. Fukumuraet al.,
“Tumor microvasculature and microenvironment: novel insights through intravital imaging in pre-clinical models,”
Microcirculation, 17
(3), 206
–225
(2010). http://dx.doi.org/10.1111/micc.2010.17.issue-3 MCCRD8 0275-4177 Google Scholar
M. Egeblad,
“Visualizing stromal cell dynamics in different tumor microenvironments by spinning disk confocal microscopy,”
Dis. Model Mech., 1
(2–3), 155
–167
(2008). http://dx.doi.org/10.1242/dmm.000596 Google Scholar
N. Shaneret al.,
“A guide to choosing fluorescent proteins,”
Nat. Methods, 2
(12), 905
–909
(2005). http://dx.doi.org/10.1038/nmeth819 1548-7091 Google Scholar
G. Filonovet al.,
“Bright and stable near-infrared fluorescent protein for in vivo imaging,”
Nat. Biotechnol., 29
(8), 757
–761
(2011). http://dx.doi.org/10.1038/nbt.1918 NABIF9 1087-0156 Google Scholar
K. PiatkevichV. Verkhusha,
“Guide to red fluorescent proteins and biosensors for flow cytometry,”
Methods Cell Biol., 102 431
–461
(2011). http://dx.doi.org/10.1016/B978-0-12-374912-3.00017-1 MCBLAG 0091-679X Google Scholar
M. Drobizhevet al.,
“Two-photon absorption properties of fluorescent proteins,”
Nat. Methods, 8
(5), 393
–399
(2011). http://dx.doi.org/10.1038/nmeth.1596 1548-7091 Google Scholar
M. Drobizhevet al.,
“Absolute two-photon absorption spectra and two-photon brightness of orange and red fluorescent proteins,”
J. Phys. Chem B, 113
(4), 855
–859
(2009). http://dx.doi.org/10.1021/jp8087379 JPCBFK 1520-6106 Google Scholar
M. Drobizhevet al.,
“Color hues in red fluorescent proteins are due to internal quadratic Stark effect,”
J. Phys. Chem. B, 113
(39), 12860
–12864
(2009). http://dx.doi.org/10.1021/jp907085p JPCBFK 1520-6106 Google Scholar
Y. WuJ. Qu,
“Two-photon autofluorescence spectroscopy and second-harmonic generation of epithelial tissue,”
Opt. Lett., 30
(22), 3045
–3047
(2005). http://dx.doi.org/10.1364/OL.30.003045 OPLEDP 0146-9592 Google Scholar
O. Subachet al.,
“Conversion of red fluorescent protein into a bright blue probe,”
Chem. Biol., 15
(10), 1116
–1124
(2008). http://dx.doi.org/10.1016/j.chembiol.2008.08.006 CBOLE2 1074-5521 Google Scholar
M. Rizzoet al.,
“An improved cyan fluorescent protein variant useful for FRET,”
Nat. Biotechnol., 22
(4), 445
–449
(2004). http://dx.doi.org/10.1038/nbt945 NABIF9 1087-0156 Google Scholar
G. Pattersonet al.,
“Use of the green fluorescent protein and its mutants in quantitative fluorescence microscopy,”
Biophys. J., 73
(5), 2782
–2790
(1997). http://dx.doi.org/10.1016/S0006-3495(97)78307-3 BIOJAU 0006-3495 Google Scholar
J. Goedhartet al.,
“Bright cyan fluorescent protein variants identified by fluorescence lifetime screening,”
Nat. Methods, 7
(2), 137
–139
(2010). http://dx.doi.org/10.1038/nmeth.1415 1548-7091 Google Scholar
O. Griesbecket al.,
“Reducing the environmental sensitivity of yellow fluorescent protein. Mechanism and applications,”
J. Biol. Chem., 276
(31), 29188
–29194
(2001). http://dx.doi.org/10.1074/jbc.M102815200 JBCHA3 0021-9258 Google Scholar
L. Wanget al.,
“Evolution of new nonantibody proteins via iterative somatic hypermutation,”
Proc. Natl. Acad. Sci. U. S. A., 101
(48), 16745
–16749
(2004). http://dx.doi.org/10.1073/pnas.0407752101 PNASA6 0027-8424 Google Scholar
N. Shaneret al.,
“Improved monomeric red, orange and yellow fluorescent proteins derived from Discosoma sp. red fluorescent protein,”
Nat. Biotechnol., 22
(12), 1567
–1572
(2004). http://dx.doi.org/10.1038/nbt1037 NABIF9 1087-0156 Google Scholar
D. Shcherboet al.,
“Bright far-red fluorescent protein for whole-body imaging,”
Nat. Methods, 4
(9), 741
–746
(2007). http://dx.doi.org/10.1038/nmeth1083 1548-7091 Google Scholar
N. Shaneret al.,
“Improving the photostability of bright monomeric orange and red fluorescent proteins,”
Nat. Methods, 5
(6), 545
–55
(2008). http://dx.doi.org/10.1038/nmeth.1209 1548-7091 Google Scholar
M. Lin,
“Autofluorescent proteins with excitation in the optical window for intravital imaging in mammals,”
Chem. Biol., 16
(11), 1169
–1179
(2009). http://dx.doi.org/10.1016/j.chembiol.2009.10.009 CBOLE2 1074-5521 Google Scholar
D. Shcherboet al.,
“Far-red fluorescent tags for protein imaging in living tissues,”
Biochem. J., 418
(3), 567
–574
(2009). http://dx.doi.org/10.1042/BJ20081949 BIJOAK 0264-6021 Google Scholar
D. Shcherboet al.,
“Near infrared fluorescent proteins,”
Nat. Methods, 7
(10), 827
–829
(2010). http://dx.doi.org/10.1038/nmeth.1501 1548-7091 Google Scholar
K. Lukeret al.,
“Imaging CXCR4 signaling with firefly luciferase complementation,”
Anal. Chem., 80
(14), 5565
–5573
(2008). http://dx.doi.org/10.1021/ac8005457 ANCHAM 0003-2700 Google Scholar
M. Smithet al.,
“CXCR4 regulates growth of both primary and metastatic breast cancer,”
Cancer Res., 64
(23), 8604
–8612
(2004). http://dx.doi.org/10.1158/0008-5472.CAN-04-1844 CNREA8 0008-5472 Google Scholar
G. Lukeret al.,
“Characterization of phosphine complexes of technetium(III) as transport substrates of the multidrug resistance P-glycoprotein and functional markers of P-glycoprotein at the blood-brain barrier,”
Biochemistry, 36
(46), 14218
–14227
(1997). http://dx.doi.org/10.1021/bi971931z MIRBD9 0144-0578 Google Scholar
K. Lukeret al.,
“Imaging ligand-dependent activation of CXCR7,”
Neoplasia, 11
(10), 1022
–1035
(2009). 1522-8002 Google Scholar
S. Huanget al.,
“Two-photon fluorescence spectroscopy and microscopy of NAD(P)H and flavoprotein,”
Biophys J., 82
(5), 2811
–2825
(2002). http://dx.doi.org/10.1016/S0006-3495(02)75621-X BIOJAU 0006-3495 Google Scholar
G.-J. Kremerset al.,
“Fluorescent proteins at a glance,”
J. Cell Sci., 124
(Pt 2), 157
–160
(2011). http://dx.doi.org/10.1242/jcs.072744 JNCSAI 0021-9533 Google Scholar
S. Tilloet al.,
“A new approach to dual-color two-photon microscopy with fluorescent proteins,”
BMC Biotechnol., 10 6
(2010). http://dx.doi.org/10.1186/1472-6750-10-6 BBMIE6 1472-6750 Google Scholar
K. LukerG. Luker,
“Applications of bioluminescence imaging to antiviral research and therapy: multiple luciferase enzymes and quantitation,”
Antiviral Res., 78
(3), 179
–187
(2008). http://dx.doi.org/10.1016/j.antiviral.2008.01.158 ARSRDR 0166-3542 Google Scholar
O. Stepanenkoet al.,
“Modern fluorescent proteins: from chromophore formation to novel intracellular applications,”
Biotechniques, 51
(5), 313
–314
(2011). BTNQDO 0736-6205 Google Scholar
D. Chudakovet al.,
“Fluorescent proteins and their applications in imaging living cells and tissues,”
Physiol. Rev., 90
(3), 1103
–1163
(2010). http://dx.doi.org/10.1152/physrev.00038.2009 PHREA7 0031-9333 Google Scholar
S. Giampieriet al.,
“Intravital imaging illustrates transforming growth factor beta signaling switches during metastasis,”
Cancer Res., 70
(9), 3435
–3439
(2010). http://dx.doi.org/10.1158/0008-5472.CAN-10-0466 CNREA8 0008-5472 Google Scholar
B. GligorijevicJ. Condeelis,
“Stretching the timescale of intravital imaging in tumors,”
Cell Adh. Migr., 3
(4), 313
–315
(2009). http://dx.doi.org/10.4161/cam 1933-6918 Google Scholar
M. Drobizhevet al.,
“Resonance enhancement of two-photon absorption in fluorescent proteins,”
J. Phys. Chem. B, 111
(50), 14051
–14054
(2007). http://dx.doi.org/10.1021/jp075879k JPCBFK 1520-6106 Google Scholar
S. Giampieriet al.,
“Localized and reversible TGFbeta signalling switches breast cancer cells from cohesive to single cell motility,”
Nat. Cell Biol., 11
(11), 1287
–1296
(2009). http://dx.doi.org/10.1038/ncb1973 NCBIFN 1465-7392 Google Scholar
E. Hirataet al.,
“In vivo fluorescence resonance energy transfer imaging reveals differential activation of Rho-family GTPases in glioblastoma cell invasion,”
J. Cell Sci., 125
(Pt 4), 858
–868
(2012). http://dx.doi.org/10.1242/jcs.089995 JNCSAI 0021-9533 Google Scholar
W. Zipfelet al.,
“Live tissue intrinsic emission microscopy using multiphoton-excited native fluorescence and second harmonic generation,”
Proc. Natl. Acad. Sci. U. S. A., 100
(12), 7075
–7080
(2003). http://dx.doi.org/10.1073/pnas.0832308100 PNASA6 0027-8424 Google Scholar
|


