|
|
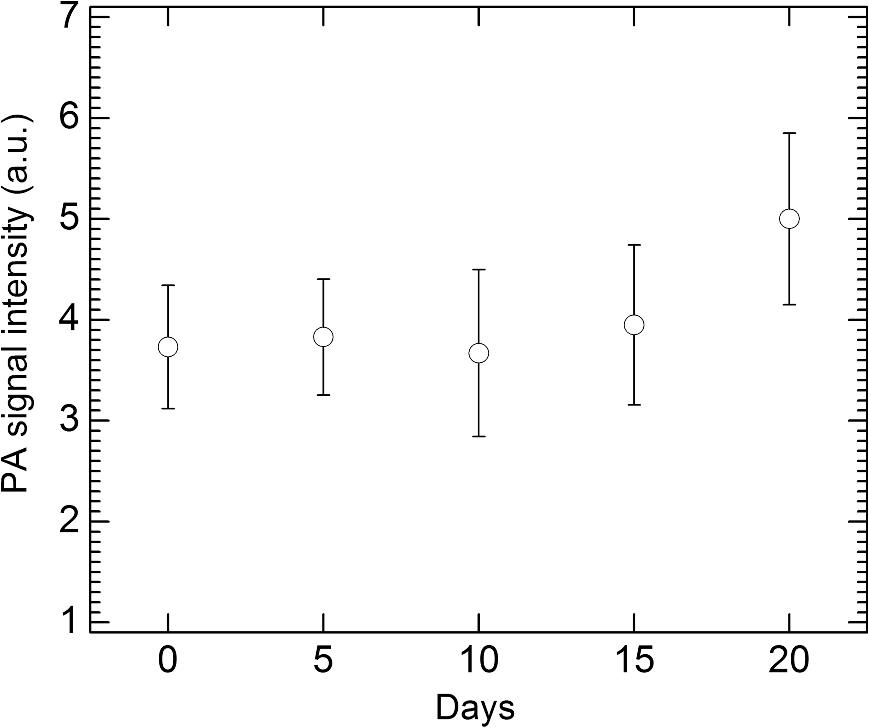
1.IntroductionIn the early stage of inflammatory arthritis, angiogenesis and increased vascularity is noted in and around the synovium within the affected joints.1–6 Blood contains a variety of chromophores such as oxygenated hemoglobin, deoxygenated hemoglobin, both highly absorptive in the visible to near-infrared (NIR) spectral region, and water whose absorption becomes strong in the NIR region above 950 nm. Nonionizing and noninvasive optical modalities are highly desirable for imaging inflammatory arthritis because optical contrast is intrinsically sensitive to tissue abnormalities and functions such as enhanced blood content due to the angiogenesis.7–10 Diffuse optical imaging modalities possess an excellent sensitivity to inflammation, but have limited utility in clinical settings because they cannot provide sufficient anatomical details in the target joint given their limited spatial resolution due to the strong light scattering in tissues.11 The emerging photoacoustic tomography (PAT) is a hybrid imaging technique combining both optical contrast and ultrasonic resolution. PAT, presenting the same optical contrast as in diffuse optical imaging, is capable of obtaining richer anatomical details due to its much higher spatial resolution that especially benefits the imaging of small joint structures of human hands and feet. These peripheral joints are among the earliest to be affected by some inflammatory arthritis and are widely accepted to be the best markers of overall disease. In previous studies, the performance of PAT in imaging normal human peripheral joints has been demonstrated.12,13 The feasibility of this novel technique in differentiating inflammatory arthritic joints from normal ones has also been explored on ex vivo animal organs.14,15 In this study, we, for the first time to the best of our knowledge, examined the capability of PAT in evaluating angiogenesis in articular tissues in vivo for the purpose of diagnosing arthritis. This study was conducted on a well-established adjuvant-induced arthritis (AIA) rat model which is a rodent model similar clinically and pathologically to human rheumatoid arthritis.16–18 To quantify the photoacoustic signal enhancement in the arthritic joint as a result of angiogenesis, the ankle joints of the rat was imaged at two different wavelengths, 1064 nm and 532 nm. In this work, PAT of a joint was achieved in a fast speed by using a commercial ultrasound unit without affecting its original imaging functions. This arrangement enables the same object to be scanned in both ultrasound and PAT modes using the same receiving probe at the same view angle, which facilitates off-line image coregistration, and better interpretation and analysis of PAT outcomes. 2.Materials and MethodsFemale Lewis rats with body weights of 150 g were provided by Charles River Laboratory. Fifteen mg powdered mycobacterium butyricum (DIFCO Labs, New York, NY) were added in two ml of mineral oil (Paraffin oil; Fisher Scientific) and ground well in a mortar and pestle for about 30 min. To induce AIA, 0.4 ml of this suspension was then injected into the base of the rat tail under aseptic conditions. Twenty days after adjuvant injection, more than 90% of rats developed arthritis, showing joint histological changes including leukocyte invasion preceding joint swelling.19,20 Before imaging the ankle joint, hair on the rat legs, in the region of interest, were completely removed by applying hair removal lotion to avoid light and ultrasound blockage by the hair. During each PAT and ultrasound scan, as well as during the adjuvant injection, a dose of Ketamine plus Xylasine administered intramuscularly was used to anesthetize the rat. In total, 12 normal ankle joints and 12 ankle joints affected by AIA were imaged. University of Michigan animal care procedures and protocol were followed in handling the rats for experiments. 2.1.Experimental DetailsSchematic of the experimental arrangement for PAT and ultrasound imaging of rat legs is given in Fig. 1. Pulsed light from an laser (Brilliant B, Quantel, Bozeman, MT, USA) with wavelength of 532 or 1064 nm and pulse repetition rate of 10 Hz was expanded to about one cm in diameter by using a beam expander comprising a plano-concave lens and a biconvex lens. The beam, after being split in two by a beam splitter and further expanded by a pair of cylindrical lenses, illuminated the target joint of the rat from the two sides for uniform light illumination around the joint. The energy density of the laser at the illuminating spot was adjusted to below the ANSI safety limit. During image acquisition, the rat leg immersed in water was fixed by using surgical tape on a platform with an angle of inclination of 30 deg. PAT and ultrasound images from the target joint were acquired by a commercial ultrasound unit (z.one, Zonare Medical Systems, Inc., Mountain View, CA, USA) with a L10-5 linear probe. The probe, with a total of 128 elements with a pitch of 0.3 mm and a detection bandwidth from 5 to 10 MHz, was placed about 2 cm above the rat leg with intervening water and aligned parallel to the platform. According to our measurement on phantoms, this probe can achieve a lateral resolution of 330 μm.21 Currently, the imaging speed, i.e., the maximum frame rate, of PAT facilitated with the z.one ultrasound and the L10-5 array is limited by the laser repetition rate of 10 Hz. However, although real-time data acquisition is achievable, the image reconstruction and display have to be done off-line on a PC, which limits the display speed. In this study, to achieve a better signal-to-noise ratio, each two-dimensional (2-D) PAT image was averaged over 100 frames. The detailed technical aspects of this imaging system on PAT mode have already been introduced in our previous publication.22 Before PAT, gray-scale ultrasound of the target joint was conducted first to find the best view in visualizing articular tissues. Then, without moving the sample or the probe, photoacoustic signals were acquired from the same joint. The image was then reconstructed from the raw data by a modified back-projection algorithm which has been introduced before.23,24 For simplicity, we assume that the light fluence was homogenous in the imaged section, which is reasonable considering the imaged object was small and the object was also illuminated from both sides with the direction of the light beams perpendicular to the transducer plane. Fig. 1Schematic of the experimental setup for PAT and ultrasound imaging of rat ankle joint. BS: beam splitter; M: mirror; W: light access windows; CL: cylindrical lens and T: ultrasonic transducer. 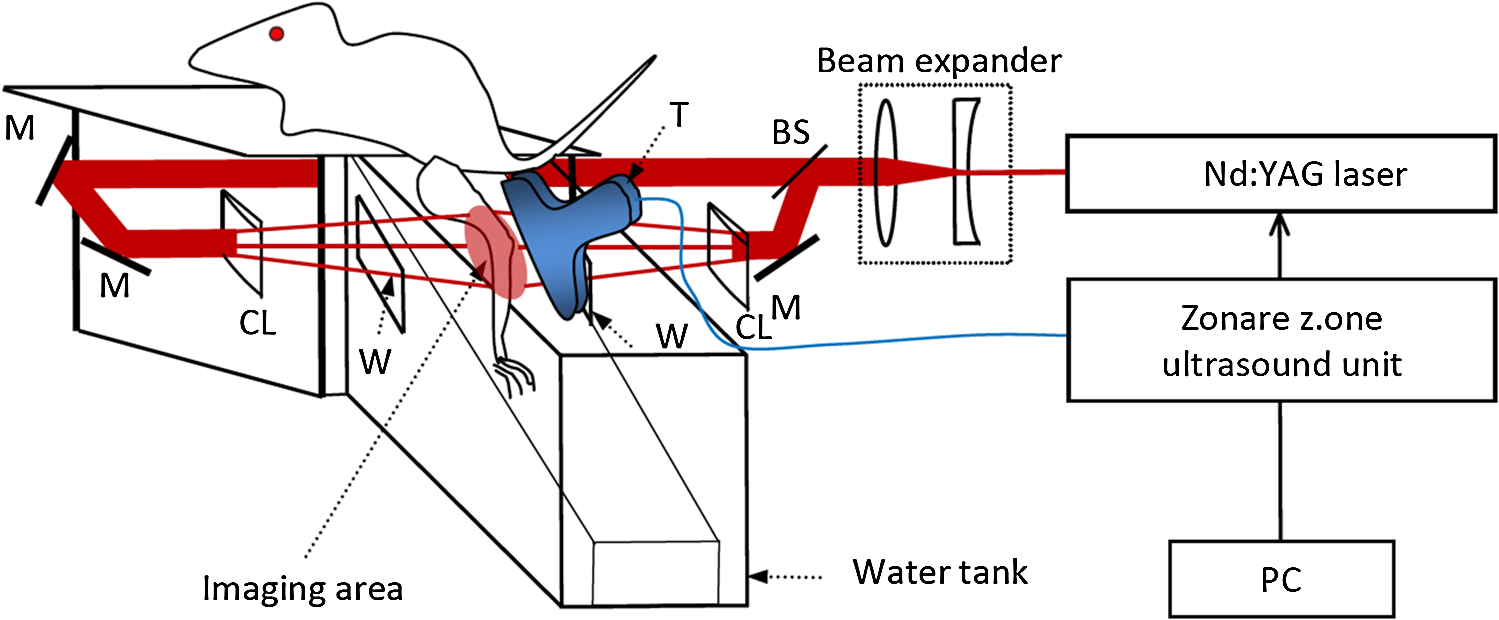 Two different laser wavelengths, 1064 nm and 532 nm, were employed for this study. Our laser provides very stable energy and high quality beam at both of these two wavelengths, benefiting repeated study and quantitative measurements. Since at 532 nm, the optical absorption coefficient of hemoglobin is orders of magnitude larger than any other chromophores present in the articular tissues, the contrast presented by the images at 532 nm is mainly determined by the blood contents. Although 532-nm wavelength is good choice for blood-contrast imaging and the measurement of angiogenesis, the imaging depth at 532 nm is limited due to the very strong attenuation of visible light in biological tissues. The limited imaging depth, although acceptable for studying the peripheral joints of small animals, could be a problem for future clinical applications on large human joints. 1064-nm wavelength, though coming with lower contrast-to-noise ratio in imaging blood in biological tissues, enables significantly enhanced imaging depth. The contrast at 1064 nm demonstrates not only the content of hemoglobin but also the content of water which could also be interesting in evaluating articular tissue edema as a result of inflammation. Arthritis inflammation usually causes biological and chemical changes of synovial fluid which is composed of water, protein, proteoglycans, glycosaminoglycans and lipid. In the future, spectroscopic imaging with multiple wavelengths, especially those in the infrared region where lipid and collagen have strong optical absorption,25 could realize quantitative assessment of many other chromophores in articular tissues. Due to the difference in optical absorption between oxygenated and deoxygenated hemoglobin, spectroscopic PAT could also help to assess the blood oxygenation in articular tissues, which may render clinical significance as it has been demonstrated that hypoxia is another physiological marker of inflammatory arthritis.26,27 To confirm arthritis in the joints and verify angiogenesis, standard histology examination of imaged joints was conducted after the imaging experiment. Whole legs were harvested and fixed in 10% neutral buffered formalin for 48 h. Tissues were decalcified for five days in a formic acid-based decalcifying solution (Immunocal, Decal Chemical Co., Tallman, NY) followed by rinsing and processing to paraffin by standard histological methods. Hematoxylin-and-eosin stained slides were evaluated by a board-certified veterinary pathologist on an Olympus BX-45 light microscope. Photos were taken using an Olympus DP-72 microscope-mounted 12.5 megapixel digital camera with the software provided by the manufacturer. 3.ResultsIn Fig. 2, representative photomicrographs of an arthritic and a normal rat ankle joints are given. As shown in the low magnification of the arthritic joint in Fig. 2(a), we can see extensive pannus (granulation tissue, arrows) in and around the joint, as well as dense intra-articular aggregates of inflammatory cells (asterisk). With the same magnification, Fig. 2(b) from the control normal joint shows clear space (arrows) in place of the granulation tissue. The normal joint fluid is not generally visible as it washes out of the section during tissue processing. In Fig. 2(c), high magnification of granulation tissue in the arthritic joint shows increased vascularity consisting of numerous capillaries (arrows). This area has a high number of inflammatory cells consisting predominantly of neutrophils and macrophages. There is also bony lysis with remodeling as evidenced by increased osteoclasts at the surface of the adjacent bone (arrowheads). In Fig. 2(d), an additional high magnification of soft tissue in the arthritic joint shows increased vascularity (arrows) in the form of small capillaries. In Fig. 2(e), inflammation-associated joint remodeling in the arthritic rat is evidenced by bony proliferation and loss of the normally well-defined cortical surface on the talus bone, in comparison with Fig. 2(f), showing the normal cortical surface of the talus in the control joint. Fig. 2Representative photomicrographs of the arthritic (a, c, d, e) and the normal (b, f) rat tibiotarsal (ankle) joints. (a) and (b): original magnification , . (c) and (d): original magnification , μm. (e) and (f): original magnification , μm. N: navicular bone, C: calcaneus, Ta: Talus, T: tibia.  As an example, the PAT and the ultrasound images of a rat ankle joint affected by inflammatory arthritis are given in Fig. 3. Despite the differences in image contrast, there is some resemblance between the PAT and ultrasound images. In comparison with the imaging results from a normal control as shown in Fig. 4, we can see tissue swelling in the region of interest (square) as a result of arthritis. More importantly, it is evident that, in comparison with the PAT image from the normal joint, there is increased signal intensity around the target joint affected by arthritis, which is believed to be mainly due to angiogenesis in the inflammatory tissues. In order to quantify the photoacoustic signal enhancement as a result of arthritis, the signal intensity in the PAT image was averaged in an area () surrounding the ankle joint (as shown by the squares in both PAT and ultrasound images). In the ultrasound image in color scale from the same joint that is coregistered naturally with the PAT image, we can recognize the target joint clearly, which facilitates the selection of the area in the PAT image for signal averaging. With the PAT images from a number of 12 arthritic joints, it was found that the average of the photoacoustic signal intensity in the area of the ankle joint was at 1064 nm which was significantly larger than an average of from the 12 normal ankle joints [as shown in Fig. 5(a)]. Fig. 3(a) PAT image at 1064 nm of a rat ankle joint affected by inflammatory arthritis. (b) The corresponding ultrasound image of the same joint. 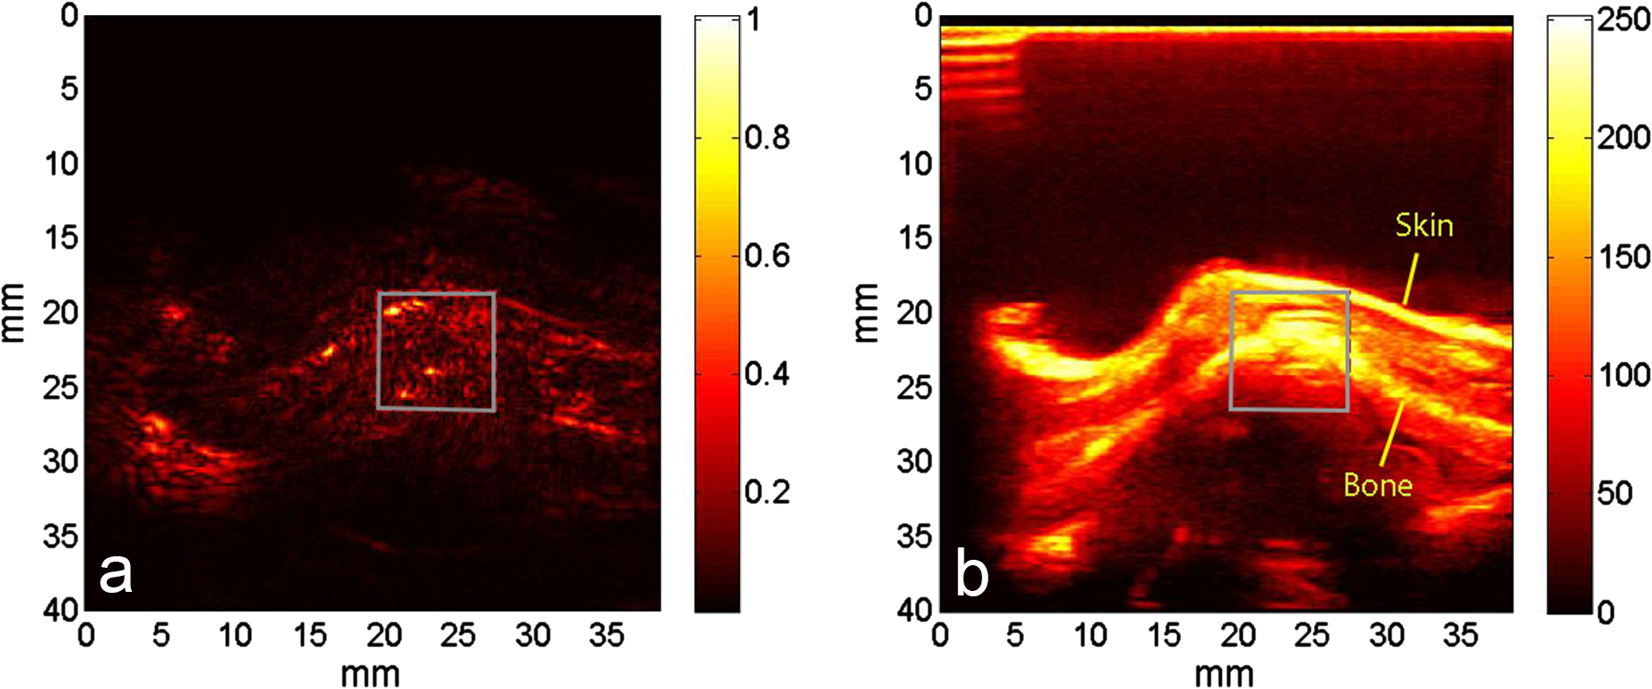 Fig. 4(a) PAT image at 1064 nm of a normal rat ankle joint. (b) The corresponding ultrasound image of the same joint. 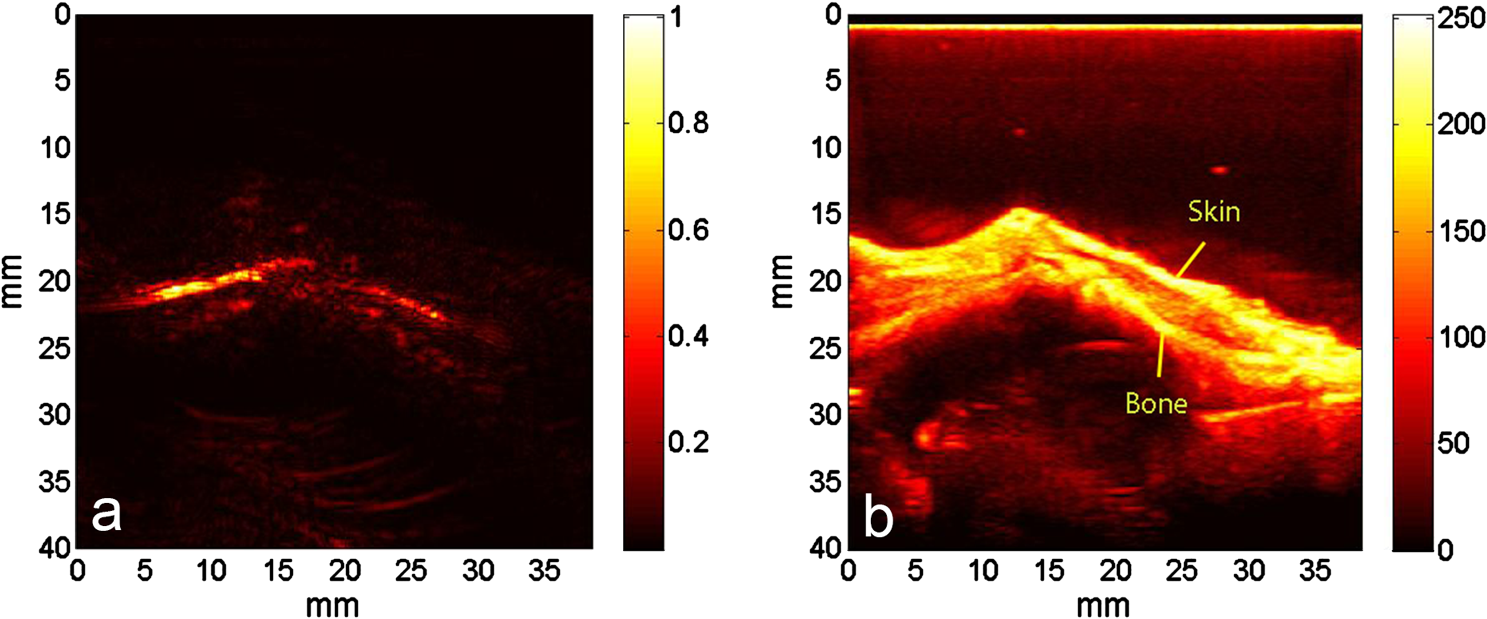 Fig. 5Average of the photoacoustic (PA) signal intensity in the area of ankle joint (a) at 1064 nm and (b) at 532 nm, for both normal rats and those affected by inflammatory arthritis. 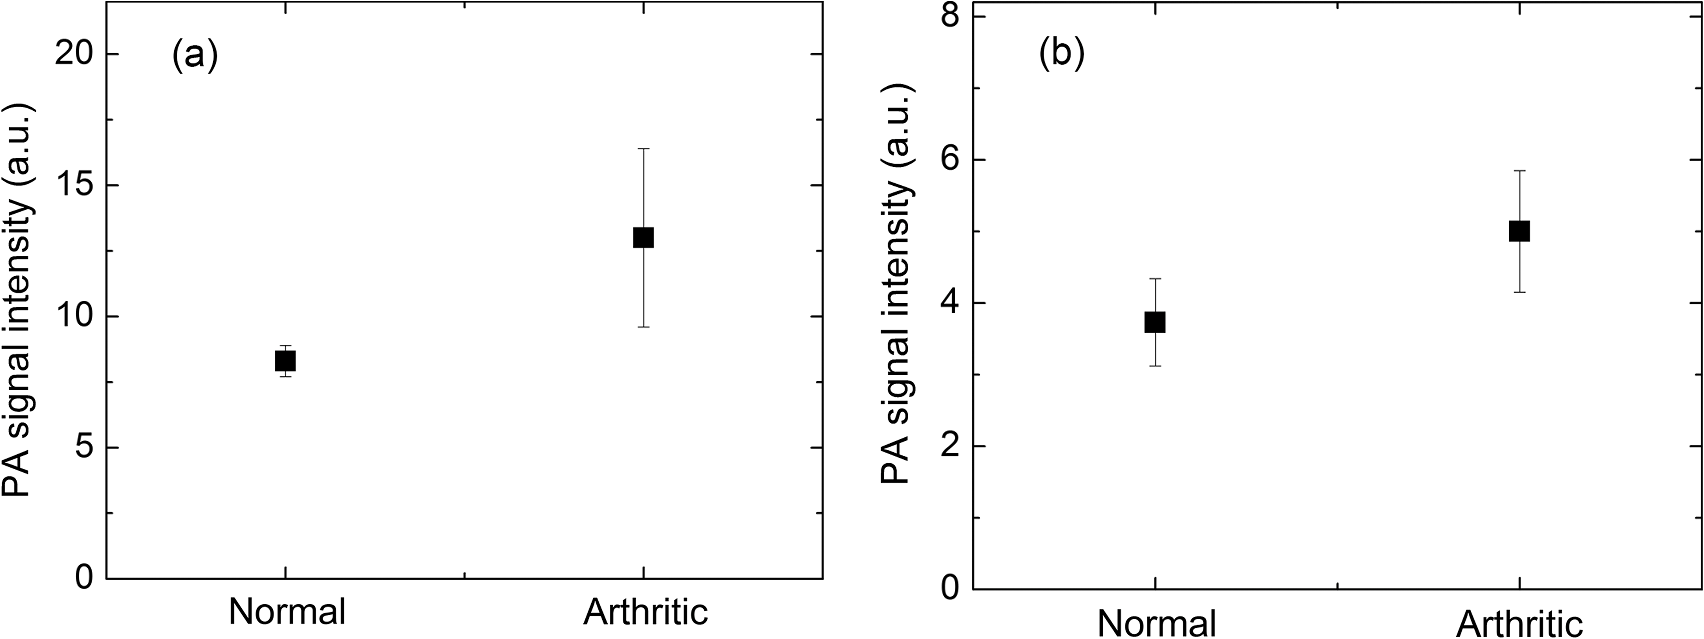 In order to determine if the findings from PAT are relevant to the optical wavelength, PAT images of the arthritic and the normal joints were also acquired using the laser light at 532 nm wavelength, as shown in the example images in Figs. 6 and 7. Similar to the findings from the images at 1064 nm, we also noticed the tissue swelling and, more importantly, the enhanced photoacoustic signals in the images from the arthritic joints. With the results from a number of 12 arthritic joints, the average of the photoacoustic signal intensity in the area of the ankle joint was at 532 nm which was significantly larger than an average of from 12 normal ankle joints [as shown in Fig. 5(b)]. Fig. 6(a) PAT image at 532 nm of a rat ankle joint affected by inflammatory arthritis. (b) The corresponding ultrasound image of the same joint. 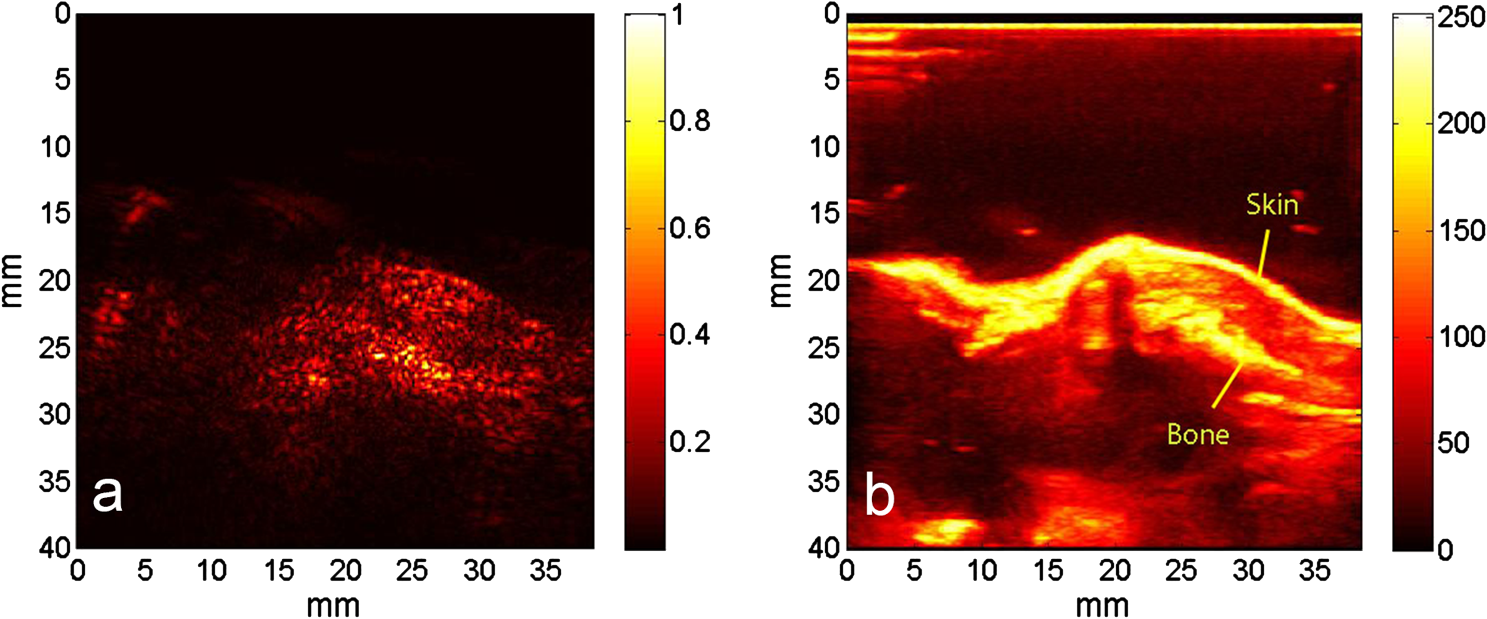 Fig. 7(a) PAT image at 532 nm of a normal rat ankle joint. (b) The corresponding ultrasound image of the same joint. 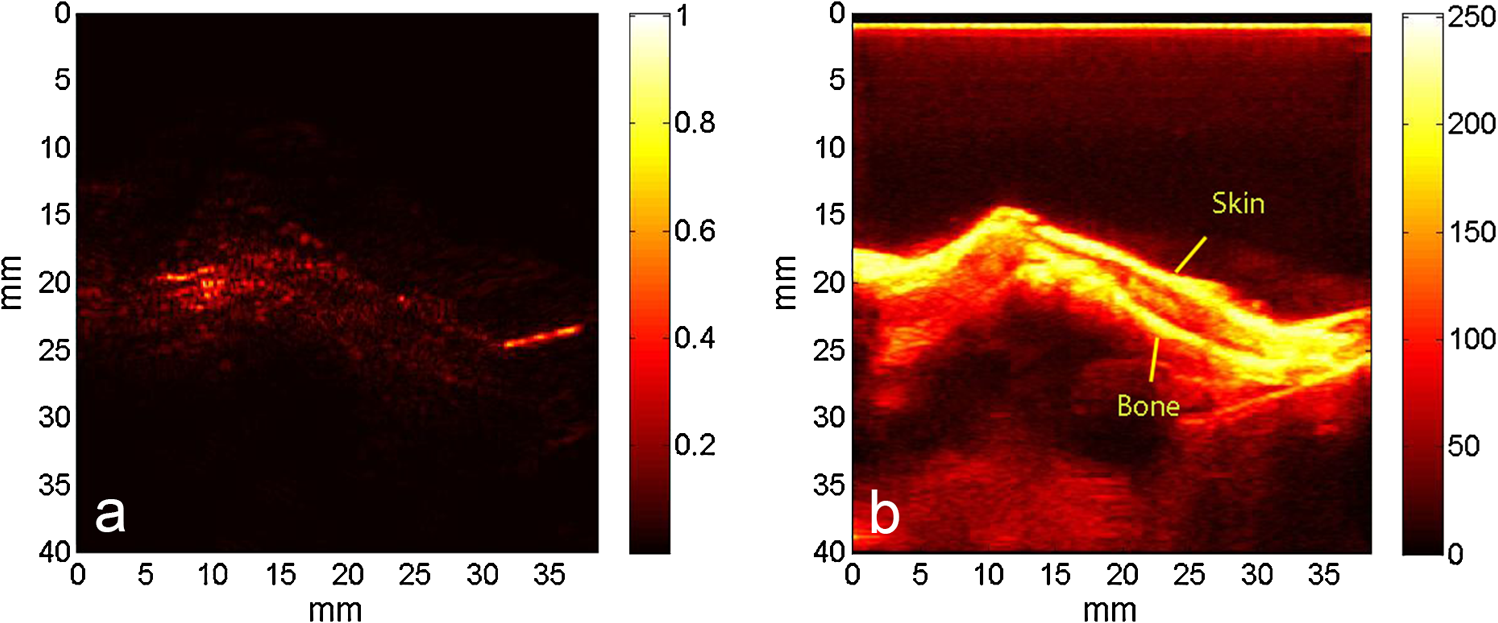 Since both PAT and ultrasound are noninvasive, this dual-modality imaging system enables repeated study on a same group of rats over a period of time. By using laser wavelength at 532 nm, we also monitored the evolution of arthritis in rat ankle joints from day 0 to day 20 after adjuvant injection. The average photoacoustic signal intensity in the area of the ankle joint as a function of time was calculated over a number of 12 specimens, as shown in Fig. 8. It is interesting to note that there was no significant change in the photoacoustic signal intensity until day 15, while on day 20, there was a steep enhancement in the photoacoustic signals in the affected joints. This matches what we observed of the procedure of joint swelling after adjuvant injection as well as the finding reported in the literature which demonstrated that the increase in clinical score was steep and happened only after day 12 post adjuvant injection.20 4.Conclusion and DiscussionWe have examined the feasibility of a PAT and ultrasound dual-modality imaging system, built on a commercial ultrasound unit, in evaluating the angiogenesis associated with inflammatory arthritis. The in vivo experiment on an arthritis rat model demonstrated that PAT and ultrasound images from the same joint have some resemblance, although they are based on different optical and ultrasonic contrast. The rat ankle joints affected by inflammatory arthritis showed increased photoacoustic signal intensities as compared to those of the normal joints. Since hemoglobin is the major chromophore in articular tissues in the visible and NIR spectral regions, this signal enhancement confirms the increased blood content resulting from neo-vascularity in the arthritis affected joints. Photoacoustic findings correlate positively with the histology result that revealed new blood vessels including capillaries created in the arthritic joints. This study suggests that PAT, in conjugation with conventional ultrasound imaging, could provide a powerful new tool in early diagnosis and treatment monitoring of inflammatory arthritis, given its excellent sensitivity in evaluating angiogenesis. Statistical analysis of the data from a number of specimens, as shown in Figs. 5 and 8, demonstrated large standard deviations. One possible explanation is the large animal-to-animal difference in the response rates to the same adjuvant injection. Another possible reason could be the limitation related to 2-D imaging. Since both morphological and functional changes, such as microvascular anomalies, in arthritic joints contain three-dimensional (3-D) volumetric information, 2-D imaging of a single plane through the joint may not quantify these morphological and functional changes accurately and, therefore, may lead to large standard deviation in quantitative measurement. Future work will include focusing on 3-D imaging, including both PAT and ultrasound of a target joint by conducting a circular scan around the joint, which could lead to better quantification of angiogenesis in arthritic joints. AcknowledgmentsThe authors thank Alisa Koch, MD, at University of Michigan for the support in the animal model, and Ingrid L. Bergin for the contribution to the histology section. This study is sponsored by NIH Grants R01AR055179 and R01AR060350. ReferencesO. FitzGeraldB. Bresnihan,
“Synovial vascularity is increased in rheumatoid arthritis: comment on the article by Stevens et al.,”
Arthritis Rheum., 35
(12), 1540
–1541
(1992). http://dx.doi.org/10.1002/(ISSN)1529-0131 ARHEAW 0004-3591 Google Scholar
A. E. Koch,
“Angiogenesis: implications for rheumatoid arthritis,”
Arthritis Rheum., 41
(6), 951
–962
(1998). http://dx.doi.org/10.1002/(ISSN)1529-0131 ARHEAW 0004-3591 Google Scholar
A. J. Hayes,
“Angioneogenesis in rheumatoid arthritis,”
Lancet, 354
(9176), 423
–424
(1999). http://dx.doi.org/10.1016/S0140-6736(05)75838-4 LANCAO 0140-6736 Google Scholar
E. M. PaleologJ. M. Miotla,
“Angiogenesis in arthritis: role in disease pathogenesis and as a potential therapeutic target,”
Angiogenesis, 2
(4), 295
–307
(1999). http://dx.doi.org/10.1023/A:1009229508096 AGIOFT 0969-6970 Google Scholar
D. A. Walsh,
“Angiogenesis and arthritis,”
Rheumatology., 38
(2), 103
–112
(1999). http://dx.doi.org/10.1093/rheumatology/38.2.103 1462-0324 Google Scholar
A. E. Koch,
“Angiogenesis as a target in rheumatoid arthritis,”
Ann. Rheum. Dis., 62
(II), ii60
–ii67
(2003). http://dx.doi.org/10.1136/ard.62.suppl_2.ii60 ARDIAO 0003-4967 Google Scholar
A. Schwaighoferet al.,
“Classification of rheumatoid joint inflammation based on laser imaging,”
IEEE Trans. Biomed. Eng., 50
(3), 375
–382
(2003). http://dx.doi.org/10.1109/TBME.2003.808827 IEBEAX 0018-9294 Google Scholar
Z. Yuanet al.,
“Three-dimensional diffuse optical tomography of osteoarthritis: initial results in the finger joints,”
J. Biomed. Opt., 12
(3), 034001
(2007). http://dx.doi.org/10.1117/1.2737420 JBOPFO 1083-3668 Google Scholar
A. H. Hielscheret al.,
“Sagittal laser optical tomography for imaging of rheumatoid finger joints,”
Phys. Med. Biol., 49
(7), 1147
–1163
(2004). http://dx.doi.org/10.1088/0031-9155/49/7/005 PHMBA7 0031-9155 Google Scholar
A. K. Scheelet al.,
“First clinical evaluation of sagittal laser optical tomography for detection of synovitis in arthritic finger joints,”
Ann. Rheum. Dis., 64
(2), 239
–245
(2005). http://dx.doi.org/10.1136/ard.2004.024224 ARDIAO 0003-4967 Google Scholar
D. Golovkoet al.,
“Optical imaging of rheumatoid arthritis,”
Int. J. Clin. Rheumtol., 6
(1), 67
–75
(2011). http://dx.doi.org/10.2217/ijr.10.105 1758-4272 Google Scholar
X. WangD. L. ChamberlandD. A. Jamadar,
“Noninvasive photoacoustic tomography of human peripheral joints toward diagnosis of inflammatory arthritis,”
Opt. Lett., 32
(20), 3002
–3004
(2007). http://dx.doi.org/10.1364/OL.32.003002 OPLEDP 0146-9592 Google Scholar
Y. SunE. SobelH. Jiang,
“Quantitative three-dimensional photoacoustic tomography of the finger joints: an in vivo study,”
J. Biomed. Opt., 14
(6), 064002
(2009). http://dx.doi.org/10.1117/1.3257246 JBOPFO 1083-3668 Google Scholar
D. L. ChamberlandX. WangB. J. Roessler,
“Photoacoustic tomography of carrageenan-induced arthritis in a rat model,”
J. Biomed. Opt., 13
(1), 011005
(2008). http://dx.doi.org/10.1117/1.2841028 JBOPFO 1083-3668 Google Scholar
D. L. Chamberlandet al.,
“Photoacoustic tomography: a new imaging technology for inflammatory arthritis–as applied to tail spondylitis in rats,”
Clin. Exp. Rheumatol., 27
(2), 387
–388
(2009). CERHDP 0392-856X Google Scholar
P. H. Wooley,
“Animal models of rheumatoid arthritis,”
Curr. Opin. Rheumatol., 3
(3), 407
(1991). http://dx.doi.org/10.1097/00002281-199106000-00013 CORHES 1040-8711 Google Scholar
M. M. Halloranet al.,
“The role of an epithelial neutrophil-activating peptide-78-like protein in rat adjuvant-induced arthritis,”
J. Immunol., 162
(12), 7492
–7500
(1999). JOIMA3 0022-1767 Google Scholar
S. Shahraraet al.,
“Amelioration of rat adjuvant-induced arthritis by Met-Rantes,”
Arthritis Rheum., 52
(6), 1907
–1919
(2005). http://dx.doi.org/10.1002/(ISSN)1529-0131 ARHEAW 0004-3591 Google Scholar
J. D. TaurogD. C. ArgentieriR. A. McReynolds,
“Adjuvant arthritis,”
Method. Enzymol., 162 339
–355
(1988). http://dx.doi.org/10.1016/0076-6879(88)62089-1 MENZAU 0076-6879 Google Scholar
D. A. Barneset al.,
“Polyclonal antibody directed against human RANTES ameliorates disease in the lewis rat adjuvant-induced arthritis model,”
J. Clin. Invest., 101
(12), 2910
–2919
(1998). http://dx.doi.org/10.1172/JCI2172 JCINAO 0021-9738 Google Scholar
L. Moet al.,
“Compact ultrasound scanner with simultaneous parallel channel data acquisition capabilities,”
in Proc. IEEE International Ultrasonics Symposium,
1342
–1345
(2008). Google Scholar
X. Wanget al.,
“Photoacoustic imaging with a commercial ultrasound system and a custom probe,”
Ultrasound Med. Biol., 37
(3), 484
–492
(2011). http://dx.doi.org/10.1016/j.ultrasmedbio.2010.12.005 USMBA3 0301-5629 Google Scholar
M. XuL. H. Wang,
“Time-domain reconstruction for thermoacoustic tomography in a spherical geometry,”
IEEE Trans. Med. Imaging, 21
(7), 814
–822
(2002). http://dx.doi.org/10.1109/TMI.2002.801176 ITMID4 0278-0062 Google Scholar
X. Wanget al.,
“Photoacoustic tomography of biological tissues with high cross-section resolution: reconstruction and experiment,”
Med. Phys., 29
(12), 2799
–2805
(2002). MPHYA6 0094-2405 Google Scholar
H. W. Wanget al.,
“Label-free bond-selective imaging by listening to vibrationally excited molecules,”
Phys. Rev. Lett., 106
(23), 238106
(2011). http://dx.doi.org/10.1103/PhysRevLett.106.238106 PRLTAO 0031-9007 Google Scholar
J. R. Levick,
“Hypoxia and acidosis in chronic inflammatory arthritis; relation to vascular supply and dynamic effusion pressure,”
J. Rheumatol., 17
(5), 579
–582
(1990). JORHE3 Google Scholar
C. R. Stevenset al.,
“Hypoxia and inflammatory synovitis: observations and speculation,”
Ann. Rheum. Dis., 50
(2), 124
–132
(1991). http://dx.doi.org/10.1136/ard.50.2.124 ARDIAO 0003-4967 Google Scholar
|