|
|
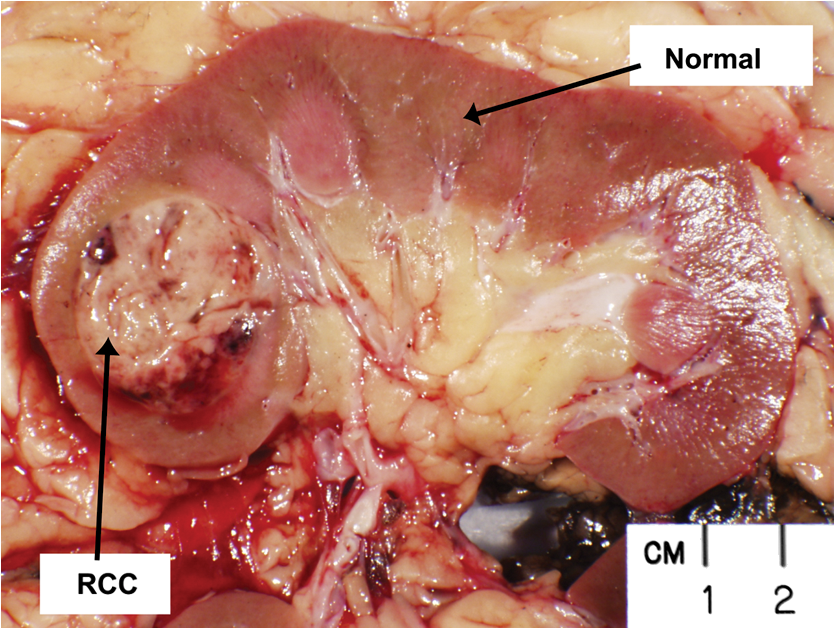
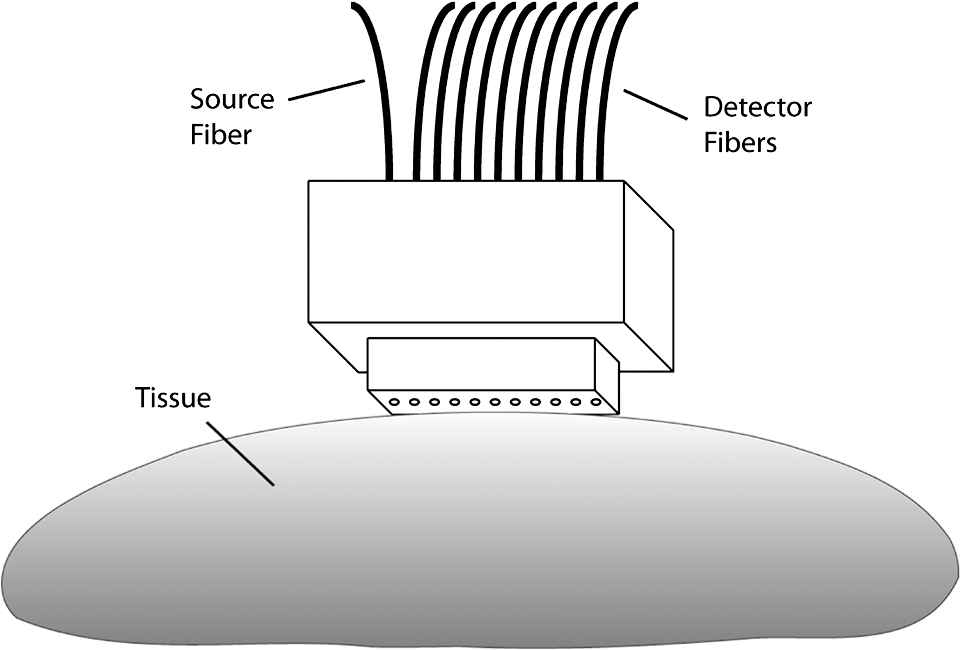
1.IntroductionRenal parenchymal tumors, most frequently renal cell carcinomas (RCC), are the sixth most common malignancy diagnosed in men and the eighth most common in women in the United States. In 2012, it is predicted that there will be more than 64,000 new cases of renal cancer in the United States, with roughly 14,000 deaths occurring from the disease.1 Traditionally, these tumors were detected by the classical triad of gross hematuria, flank pain, and an abdominal mass,2 but currently fewer than 10% of patients have these symptoms or signs, and more than half the tumors are detected as incidental findings on abdominal imaging performed for unrelated symptoms, such as abdominal pain. Most incidentally found renal tumors are fairly small (less than 4 cm), and they generally have an excellent prognosis with minimally invasive procedures. Traditionally, nonmetastatic RCCs have been treated with curative intent by radical nephrectomy, a major surgery with concomitant postoperative complications and frequently accompanied by worsening overall kidney function. This procedure can now frequently be performed laparoscopically using robotic technology, reducing morbidity over an open surgical approach without compromising oncologic outcome in appropriately selected cases.3 Furthermore, there is compelling evidence that, for appropriately selected patients, nephron-sparing surgery, in which a partial rather than a total nephrectomy is performed, is as effective as radical nephrectomy.4 These nephron-sparing treatments, originally performed for obligate reasons (solitary kidney, severe renal impairment, bilateral tumors, etc.), have become increasingly popular and now represent standard therapy for tumors that are anatomically amenable to such an approach. Again, based on technical and anatomical considerations, such therapies can often be done laparoscopically with as much success as open surgery in appropriately selected cases. Over the past five years, there has been increasing interest in further reducing morbidity by the use of minimally invasive techniques,5 particularly radiologically driven ones. These have primarily focused on thermotherapies, including radiofrequency ablation (RFA)6 and cryotherapy.7 These techniques, though still considered experimental by some, are becoming increasingly mainstream. In short- and medium-range follow-up, outcomes approach those for extirpative surgeries.8 Patient and lesion selection appears to be directly proportional to outcomes; smaller, more peripheral lesions tend to have better outcomes. Nephron-sparing minimally invasive treatments are particularly helpful in patients with hereditary causes of RCC, such as von Hippel-Lindau and Birt-Hogg-Dubé syndromes, as these patients tend to have multiple and recurrent renal tumors.9 However, many of these tumors arise in anatomical locations that would prevent them from being amenable to percutaneous RFA or cryotherapeutic approaches. These lesions include centrally located tumors near the major renal blood vessels, in which a “heat sink” effect significantly reduces the efficacy of thermotherapies, primarily by moderating temperatures. Although there have been various attempts to make tumors more sensitive to those therapies by using pretreatment with targeted antiangiogenic therapies, the efficacy of such approaches remains unknown and certainly may add complexity and expense to existing therapies. Furthermore, roughly 20% to 30% of small renal space occupying lesions are indeterminant cysts (Bozniak 2 s and 3 s), which are not ideal thermotherapeutic approaches and can pose increasing challenges for laparoscopic partial nephrectomy.10 Thus, approximately 40% of newly diagnosed small renal lesions, which represent as many as two-thirds of the newly diagnosed renal tumors, are not always amenable to current minimally invasive nephron-sparing interventions. Photodynamic therapy (PDT) using laser excitation of a photosensitizer to generate reactive oxygen species in tumors has been approved by health regulatory agencies worldwide and has been used in a wide variety of cancers.11,12 Though it has not been used in clinical scenarios for renal parenchymal tumors, there is little reason to expect, particularly based upon the highly vascular nature of these tumors, that they would not be amenable—indeed ideal—for PDT approaches combined with state-of-the-art imaging and percutaneous applications. The purpose of this study was to obtain optical property information—the absorption and scattering coefficients—from lesions in freshly excised kidneys. This data may then be incorporated into treatment planning models for interstitial PDT to assess the feasibility of PDT to treat renal cancers. 2.Materials and Methods2.1.Research Population Recruitment and Tissue Handling2.1.1.Method of subject identificationSubjects who were patients of attending physicians in the Department of Urology at the University of Rochester Medical Center and were scheduled to receive surgery for kidney cancer were eligible to participate in this study. 2.1.2.Process of consentThe study, risks, and benefits of participation were presented to subjects. Consent forms approved by the University of Rochester’s Research Subjects Review Board (RSRB) were presented to patients at the time of their office visit. 2.1.3.Inclusion/exclusion criteriaSubjects enrolled in this study were males and females over the age of 18 who were undergoing surgery at Strong Memorial Hospital for renal cancer. Pediatric patients ( of age) were not enrolled. Samples from patients with known infectious diseases such as AIDS, hepatitis, and tuberculosis were not collected. Optical property measurements were performed on 16 kidneys collected over two years, with interpretable spectra obtained from 14 of these subjects. 2.1.4.Sample collectionKidneys were collected during surgical nephrectomies. There was no deviation from routine clinical surgical practice. Specimens collected during surgery were handled under the supervision of a pathologist prior to, during, and after the optical property measurements. If the surgeon decided that any excised kidney required immediate evaluation by pathology, that specimen was not included in this study. Nephrectomy specimens were brought directly from the operating room to the laboratory for optical measurements. A pathologist performed the initial dissection of the specimen as per standard surgical pathology grossing procedures on a bench adjacent to the diffuse reflectance spectroscopy setup. This ensured a clean, flat-cut surface against which the spectroscopy probe could be positioned with good contact. By visual inspection, the pathologist then identified normal and neoplastic tissue on which optical measurements would be performed. A representative dissected kidney is shown in Fig. 1. The measurements were taken using a custom diffuse reflectance spectroscopy system. The spectroscopy probe, shown schematically in Fig. 2, made gentle contact with the surface of the tissue being interrogated. The nephrectomy specimen was then immediately taken to the surgical pathology laboratory, where it was accessioned and processed as per routine practice. 2.2.Diffuse Reflectance SpectroscopyWhite light, steady-state diffuse reflectance measurements were performed at each of the normal and neoplastic regions of the specimen using techniques that have been developed and optimized in the laboratory over the past decade. Our instrumentation and method of data reduction for performing quantitative diffuse reflectance spectroscopy have been described in detail elsewhere.13,14 Broadband light from a xenon lamp was delivered to the surface of the tissue via an optical fiber with a 400-μm core diameter, which is terminated in a probe of our own design and construction (Fig. 2). The probe also holds a linear array of 20 detection fibers (200-μm core diameter) positioned at regular 1-mm spacings at distances of 1 to 20 mm from the source fiber. In the studies reported here, adequate signal-to-noise was obtained from the first 10 of these fibers, corresponding to source-detector separations ranging from 1 to 10 mm. We confirmed that measurements from these 10 fibers were sufficient by systematically deleting data from the most remote fiber and refitting the remaining points until a change in the returned optical properties was observed. For all kidneys analyzed, five to eight source-detector separations were adequate for accurate recovery of optical properties. The flat, polished surface of the probe made good contact with the clean, flat-cut surface of the tissue under investigation, allowing white light from the source fiber to be injected into the specimen surface. The distal ends of the detection fibers were gathered into a bundle that terminated in a ferrule. At the end of the ferrule, the fibers were arranged in a row and positioned in the focal plane of a 0.275-m imaging spectrograph (SpectraPro-275, Princeton Instruments/Acton, Acton, MA). The fibers were imaged on to the surface of a thermoelectrically cooled, , 16-bit CCD camera (Pixis512, Princeton Instruments/Acton, Trenton, NJ). The detector fiber position was imaged along one axis of the CCD array, and the spectral information over the range of 630 to 800 nm was recorded along the other. Thus, at each wavelength in the data set, the experiment captured a spatially resolved attenuation measurement. Typical signal integration times for measurements described here were approximately 5 s. The raw data were corrected for system throughput and fiber cross-talk and then processed through a Savitzky-Golay smoothing filter. From these attenuation measurements, the absorption () and transport scattering coefficients () of the tissue were extracted. 2.3.Extraction of Optical PropertiesA broadly accepted theoretical description of light propagation in biological tissues is the Boltzmann transport equation.15 This equation treats light propagation as energy transport, in which absorption and scattering are the dominant attenuation mechanisms. We have previously demonstrated the accuracy of an approximation to this expression known as the approximation, which expands the Boltzmann transport equation in Legendre polynomials up to third order.16 The diffuse reflectance predicted by this model explicitly depends on the optical properties of the sample and can therefore be used to extract these properties from measured data. The , rather than the diffusion approximation, was used here because of its validity over a wider range of possible optical properties. When light is introduced into tissue, it is attenuated by wavelength-dependent scattering and absorption. In a diffuse reflectance measurement, a fraction of the multiply scattered light is emitted from the tissue surface, where it is collected by one of the probe fibers, as illustrated schematically in Fig. 2. With increasing distance from the source fiber, the amplitude of the reflectance signal is diminished, because light exiting the tissue at larger source-detector separations has traversed a greater path length. These spatially resolved diffuse reflectance data may be fit using an appropriate theoretical model to obtain and without assumptions regarding the composition of the tissue. Here, the model of light transport was fit to the measured reflectance using a constrained nonlinear optimization routine found in the MATLAB optimization toolbox (Mathworks, Natick, MA). The fitting function, , to be minimized was the sum of the squared error between the measured dataset at each wavelength and the model, scaled by the measured diffuse reflectance at each source-detector separation, as shown in the equation where are radially resolved measurements and are reflectance values at positions computed using the approximation with test optical properties. All 10 source-detector separations, , were used simultaneously to compute for each set of test optical properties. Constrained minimization was performed using the interior point algorithm included in MATLAB’s fmincon function, with and extracted as free parameters. The values of and were both constrained to be positive in the fit, and the value of the scattering anisotropy (g) was assumed to be 0.85.16,17 The transport scattering coefficient, , was constrained to be monotonically decreasing with increasing wavelength, as this has been demonstrated experimentally.18,19 Values of and were assumed in the approximation, using a Henyey-Greenstein phase function with g. The values of and corresponding to a minimized were stored in an array. The radially resolved measurement for each wavelength in the dataset was analyzed using an identical procedure.2.4.Monte Carlo Model of Interstitial PDTPDT of renal tumors would be performed by introducing an optical fiber or fibers directly into the tumor under image guidance. Simulations of light propagation in tissue from cylindrical diffusing tip fibers were performed using Monte Carlo (MC) modeling. The particular code used was developed in our laboratory and incorporates a rigorous model of cylindrical diffusing fibers implemented on a graphics processing unit.20 Briefly, the model uses a realistic description of cylindrical diffusing fibers to launch photon packets into the surrounding tissue, with standard MC techniques being used to control photon propagation.21 Interactions between photon packets and the diffuser after launch are also considered. MC simulations were used to model two scenarios. The first consisted of an ellipsoidal tumor embedded in a normal kidney. The tumor had equatorial radii of 1.1 cm and a polar radius of 1.3 cm, with a semi-infinite region of normal kidney tissue surrounding it. This tumor size was determined by averaging measured tumor dimensions from clinical images and assuming an ellipsoidal tumor shape. In this case, the optical properties used were those extracted from fits to measured diffuse reflectance in both normal kidney and tumor tissue, with each being assigned to the appropriate region of the sample. Based on the treatment wavelengths used for currently available and anticipated PDT photosensitizers, simulations were run at 630, 652, 670, 692, and 780 nm for each kidney sample. The second model consisted of a homogeneous sample of either normal kidney or tumor tissue. Optical properties were set uniformly to match those extracted from fits to measured diffuse reflectance in normal or tumor tissue. Simulations of both normal and tumor tissue were run at 50 discrete wavelengths from 630 to 800 nm for each kidney sample. This allowed for modeling of a characteristic light propagation distance at each of the measured wavelengths. For all MC simulations, 1,000,000 photons were launched from a 2-cm-long diffuser. In all cases, the tissue sample was represented with a grid of cuboid voxels, each with dimensions of 0.026 cm. A Henyey-Greenstein phase function with g was used for all simulations. 3.Results3.1.Diffuse Reflectance SpectroscopyWe analyzed data from 14 kidneys. The results obtained from two kidneys were not interpretable due to low signal levels. Figure 3 shows representative diffuse reflectance spectra acquired from the RCC region of a freshly excised human kidney. The spectra were corrected for measured system throughput, background signal, and cross-talk in the CCD. Individual traces correspond to different source-detector separations on the diffuse reflectance probe, which range from approximately 1 to 10 mm. Fig. 3Measured diffuse reflectance spectra at the first five source-detector separations collected from a kidney region identified as RCC. Spectra were corrected for measured optical system throughput, background, and cross-talk in the CCD. Individual traces correspond to different source-detector separations on the diffuse reflectance probe, with their locations relative to the source fiber given in the legend. 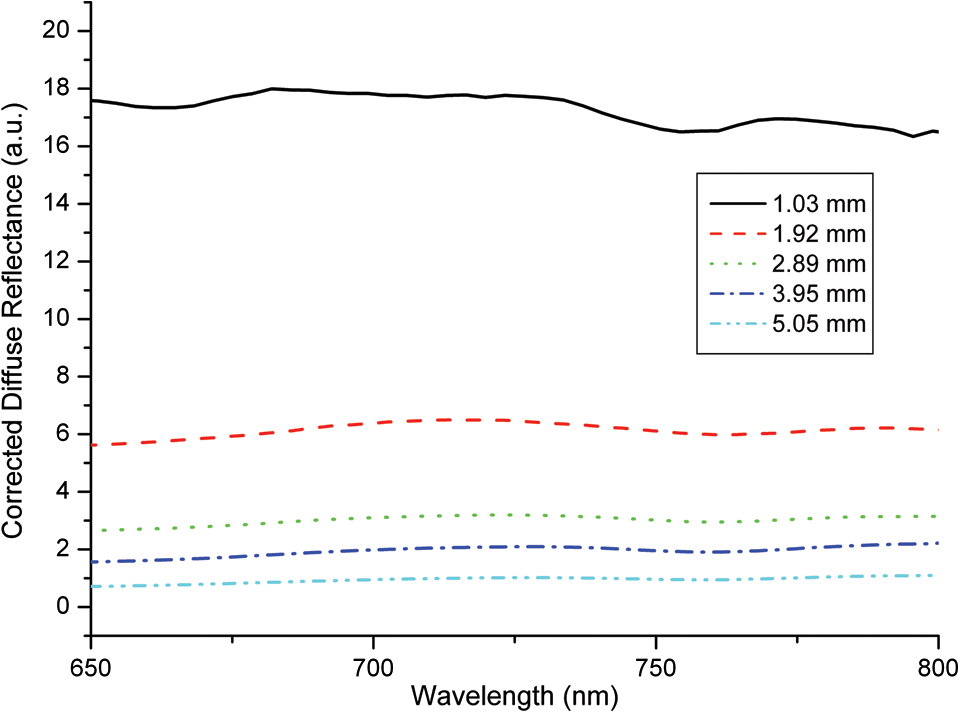 3.2.Kidney Optical PropertiesThe optical properties of tumor and normal kidney tissue were extracted at each wavelength by fitting a model of light transport to the measured data using a constrained nonlinear optimization routine as described in Sec. 2. An example of such a fit is shown in Fig. 4. The individual data points are corrected, normalized diffuse reflectance measurements made at 780 nm in a representative RCC. Each point was acquired at a different source-detector separation [r (mm)] using the probe as described above. The fit shown in Fig. 4 yielded optical properties of and . Fig. 4The individual data points are corrected, normalized diffuse reflectance measurements made at 780 nm in a representative RCC. Each point was acquired at a different source-detector separation [r (mm)]. Error bars are the standard deviations of three repeated measurements of the same sample. The fit of the model to these data yielded optical properties of and . 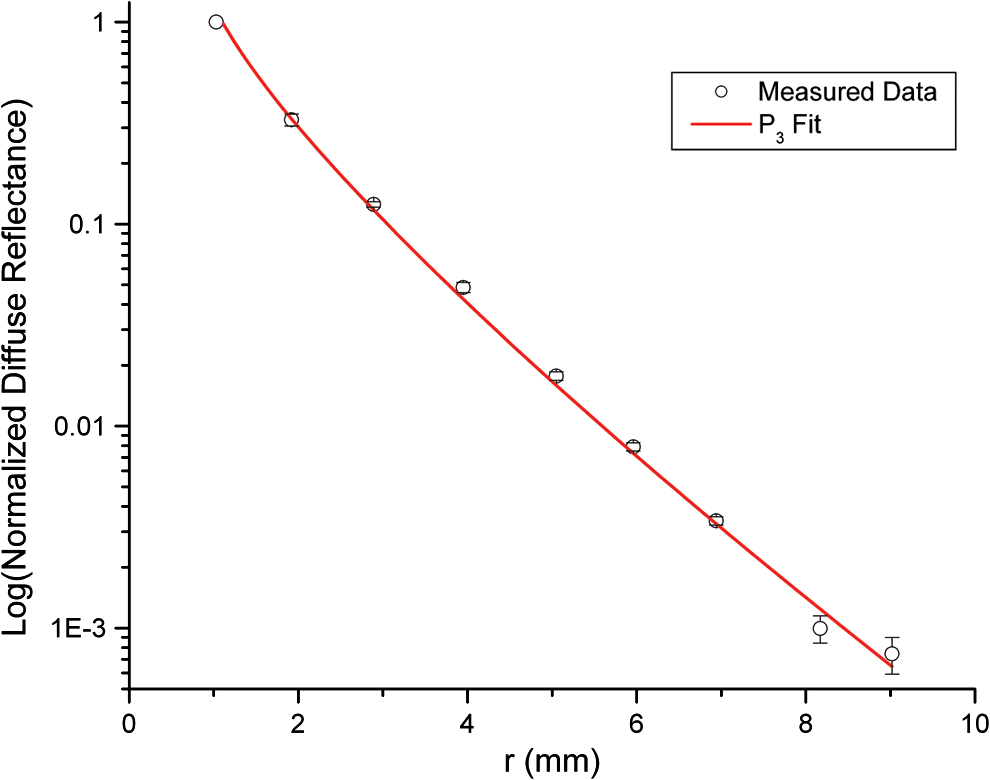 By analyzing spatially resolved reflectance at each measured wavelength, absorption and scattering spectra over the measured spectral range were determined for each kidney sample. Examples from two lesion types are shown in Fig. 5. In these two cases, was lower in the tumor than in the normal kidney tissue. However, this trend was not reproducible across all of the kidney samples (data not shown). The spectra exhibit decreased absorption and scattering with increasing wavelength, as expected. The absorption feature near 759 nm corresponds to a peak characteristic of deoxyhemoglobin. Fig. 5Values of (a) and (b) extracted from fitting the model to measured diffuse reflectance spectra from a kidney diagnosed with RCC. In this case, both and are lower for tumor tissue than for kidney parenchyma. However, this was not reproducible for all RCC samples. (c) and (d) extracted from fitting the model to measured diffuse reflectance spectra from a urothelial carcinoma and adjacent normal parenchyma. In this case, is higher in the tumor. 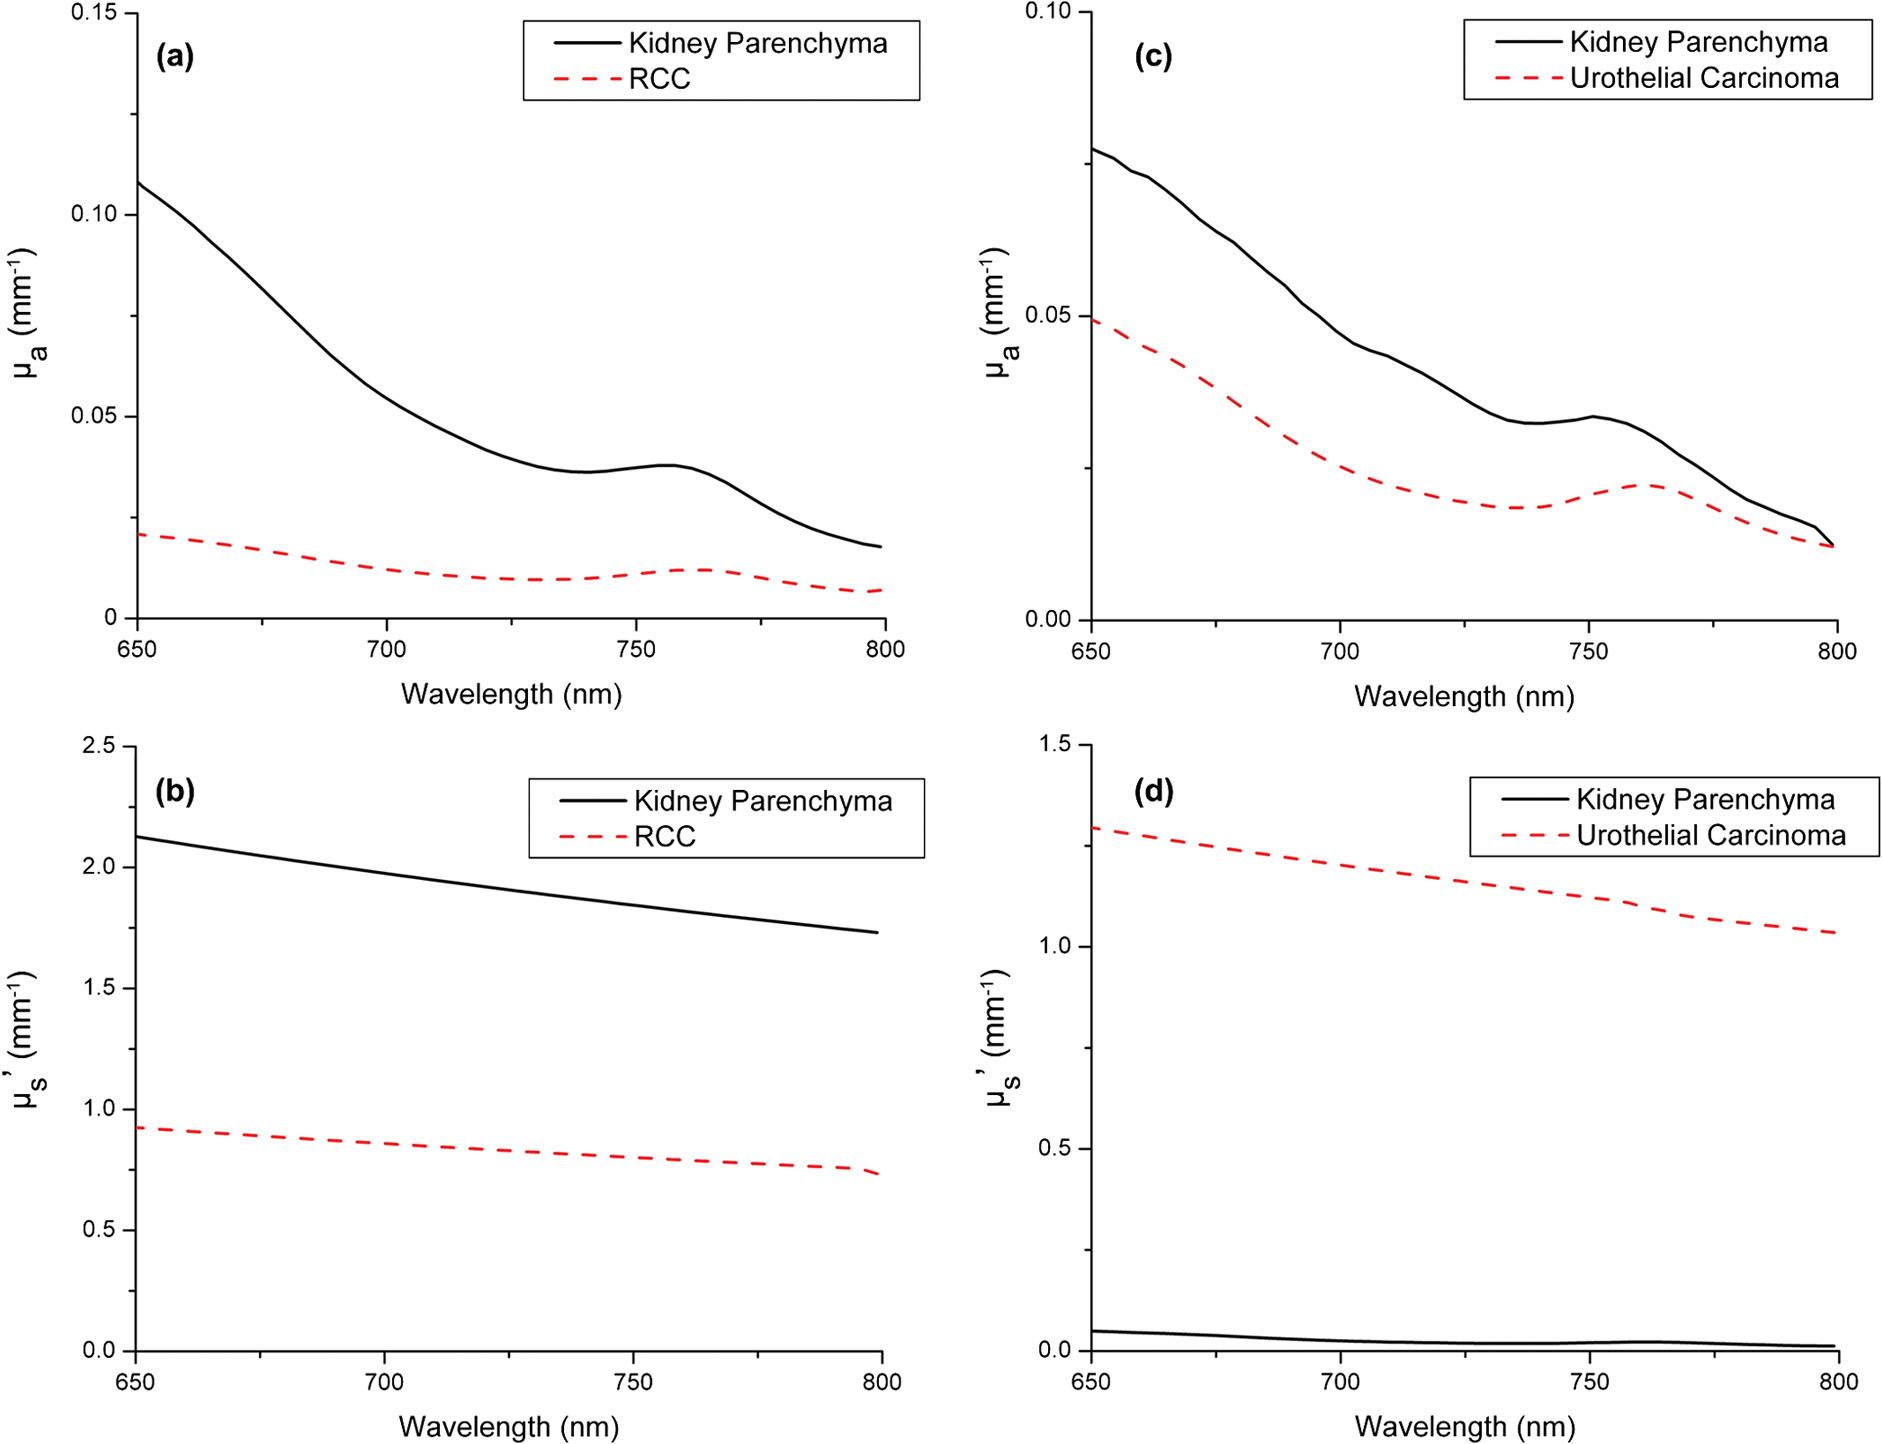 The recovered values of ranged from 0.016 to for RCC conventional; 0.003 to for oncocytoma; 0.02 to for urothelial carcinoma; 0.14 to for RCC, papillary type 1; 0.5 to for RCC, papillary multifocal; and 0.017 to for kidney parenchyma. The recovered values of ranged from 0.48 to for RCC conventional; 1.23 to for oncocytoma; 1.06 to for urothelial carcinoma; 0.25 to for RCC, papillary type 1; 1.32 to for RCC, papillary multifocal; and 0.11 to for kidney parenchyma. These recovered optical properties yielded values of the transport albedo [] that ranged from 0.49 to 0.99. The recovery of transport albedos lower than 0.98 indicates that the approximation was an appropriate choice over the diffusion approximation.16 3.3.Monte Carlo ModelingMonte Carlo simulations of light propagation from cylindrical diffusing fibers were run using the optical properties extracted from each of the kidney samples. A representative fluence distribution generated by the delivery of of 630-nm light from a 2-cm-long diffuser is shown in Fig. 6. This wavelength corresponds to the long wavelength absorption maximum of the FDA-approved photosensitizer Photofrin. The figure shows fluence deposited in the surrounding tissue using optical properties that were derived from a kidney diagnosed with urothelial carcinoma. In order to examine this fluence distribution more carefully, cuts were made through the fluence distribution perpendicular to the diffuser axis. The results of this are shown in Fig. 7(a) for a 2-cm-long diffuser delivering , with each contour line corresponding to a fluence increment of . The outer black line in the figure represents the boundary between tumor and normal tissue, as described previously. The inner black line represents the boundary between tumor tissue and the diffuser. Fig. 63D rendering of the simulated fluence distribution around an optical fiber with the proximal end of a 2-cm-long diffusing segment of the fiber positioned at above the boundary separating the tumor and normal tissue regions. Tumor optical properties were set to , , and , which correspond to values extracted from an urothelial carcinoma at 630 nm, as shown in Fig. 5(c) and 5(d). Voxel size was . 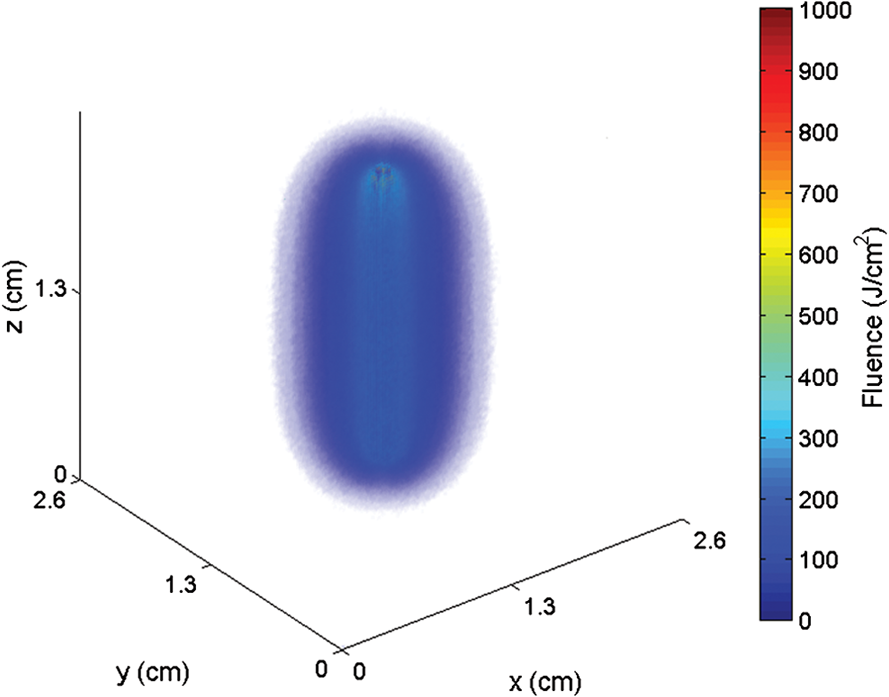 Fig. 7Contour plots of cuts through simulated fluence distributions around a 2-cm-long diffusing fiber at (a) 630 nm and (b) 780 nm, with a total fluence of 100 J cm−1 delivered. Each contour line corresponds to a fluence increment of 50 J cm−2. The simulated volume consists of an ellipsoidal tumor region, with equatorial radii of 1.1 cm and a polar radius of 1.3 cm, surrounded by a semi-infinite region of normal tissue. The boundary between tumor and normal tissue is shown as the outer black line; the boundary with the diffuser is shown as the inner black line. The optical properties correspond to values extracted from the tumor and normal regions of a kidney diagnosed with urothelial carcinoma, as shown in Fig. 5(c) and 5(d).  Figure 5 reproduces in the human kidney the well-known observation that absorption and scattering in tissue both decrease with increasing wavelength in this spectral range. It is therefore appealing to consider the use of photosensitizers with longer wavelength absorption in interstitial PDT of the kidney. This potential is shown in Fig. 7, where fluence deposition is modeled at 630 and 780 nm. At the longer wavelength, the penetration of light is greatly improved compared to 630 nm. For a delivered fluence of , of the tumor volume received a light dose of at least at 630 nm. This increased to approximately 50% of the tumor volume at 780 nm. Additionally, nearly 30% of the tumor received a light dose of or more at 780 nm, compared to at 630 nm. This trend was reproducible across all samples, with the percentage of the tumor receiving a prescribed light dose increasing by an average of 2.2-fold as a result of changing the wavelength from 630 to 780 nm. Increasing the fluence delivered by the cylindrical diffuser to extended the contour to the simulated boundary of the tumor (not shown). In order to describe a characteristic distance of light propagation from a cylindrical diffusing fiber, MC simulations were run using homogeneous optical properties in a semi-infinite tissue volume surrounding a 2-cm-long diffuser. A zeroth order modified Bessel function of the second kind, , is a useful analytic approximation to light emitted from an infinitely long cylinder. Thus, a function of the form was fit to radially averaged cuts through simulated fluence distributions at the axial midpoint of the diffuser. Here, is the fluence at radial position , is a zeroth order modified Bessel function of the second kind, and is a characteristic light propagation distance, which we define as the distance from the diffuser over which light is attenuated to of its value at the fiber surface. A representative fit to a simulation run with and is shown in Fig. 8. The optical properties used correspond to values extracted from a typical RCC at 780 nm. The fit shown is typical and of good quality. The value extracted from this fit was 3.43 mm. The results of this are shown in Fig. 9 for optical properties from a typical kidney diagnosed with RCC. An increased penetration depth with increasing wavelength was found for all measured tumor samples. The mean penetration depths for the five tumor types in this study and for the normal kidneys are collected in Table 1 for five wavelengths selected for relevance to clinical PDT.Fig. 8Results of fitting a zeroth order modified Bessel function of the second kind, [Eq. (2)], to a cut through the simulated fluence around a 2-cm-long diffuser. The fluence plotted is the radially averaged simulated fluence at the axial midpoint of the diffuser. Optical properties were set to , , and , which correspond to values extracted from a representative RCC at 780 nm. From such fits, the characteristic propagation distance, , is obtained. 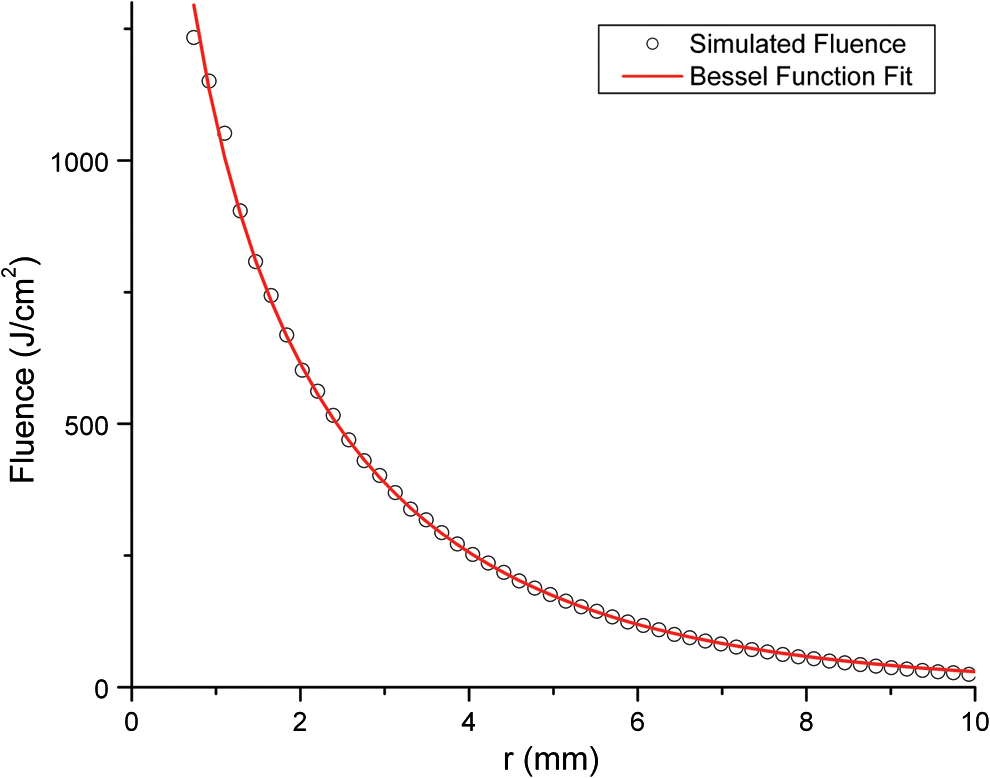 Fig. 9Simulated light propagation distance, , based on Bessel function fit to the simulated radial distribution of fluence in Fig. 8, for a kidney diagnosed with RCC.  Table 1Mean characteristic light propagation distances, in mm, at five selected wavelengths, separated by diagnosis. Wavelengths were selected to correspond with the absorption peaks of Photofrin (630 nm), Foscan (652 nm), methylene blue (670 nm), benzoporphyrin derivative (BPD, 692 nm), and next-generation photosensitizers (780 nm). Uncertainties shown are standard deviations over multiple samples, and values in parentheses indicate range over multiple samples.
4.DiscussionRenal parenchymal tumors, most frequently RCC, are increasingly being detected earlier as incidental radiological findings. These tumors are often detected when they are small enough such that radical nephrectomy, either by open surgery or laparoscopy, is not necessary. Patients who have only one kidney, have bilateral disease, or are too frail to undergo surgery are not normally treated by nephrectomy. Minimally invasive, kidney-sparing therapies based on percutaneous approaches such as RFA and cryotherapy have their own limitations, particularly in well perfused organs like the kidney. There is therefore a compelling rationale for considering image-guided, interstitial PDT in this context, and this motivated the study of the optical properties of RCC, other less common lesions, and normal kidney parenchyma. The light dose delivered by a cylindrical diffusing fiber in interstitial PDT is generally specified in joules per unit length of diffuser, . This fluence is provided by delivering light to the fiber at a given fluence rate, in , for a prescribed treatment time. These fluence rates22,23 are typically in the range of 100 to , with total fluences of 150 to . The fluence delivered by the single diffuser in the simulations reported here ranged from 100 to , which, at a typical fluence rate of , corresponds to treatment times of 11 to 66 min. If deemed clinically necessary, these times could be reduced by increasing the fluence rate or inserting additional fibers. The characteristic propagation distance, , which we have defined, corresponds to the distance in the tissue at which the deposited fluence falls to of the maximum value immediately adjacent to the fiber. The propagation distances shown in Table 1 translate to diameters around a single diffuser of at 630 nm to 5.6 mm at 780 nm. It is important to emphasize that this does not define the zone that can be treated effectively. As illustrated in Fig. 7, the area that receives a specified, clinically relevant fluence is typically larger than the characteristic propagation distance. Also, as suggested above, multiple diffuser fibers can be used to treat a larger volume. This is commonly done in PDT treatment of the prostate,24 where fibers are inserted on a grid specified by a template, with an approximate spacing of 5 to 7 mm between diffusers. The size and arrangement of this grid can be tailored to fit the tumor of an individual patient. Treatment plans designed to optimize diffuser placement and the total fluence delivered may be developed based on estimates of optical properties or on their direct interstitial measurement. The heterogeneity in tumor optical properties reported in this study provides strong rationale for direct pretreatment optical property determinations using interstitial optical fiber-based spectroscopy. PDT may also be informed by radiation therapy treatment plans, which specify therapeutic doses to target volumes and identify sensitive surrounding healthy tissue. The wavelengths used for MC simulation were chosen to correspond to the absorption maxima of several clinically relevant PDT photosensitizers. The wavelength of 630 nm corresponds to Photofrin, a porphyrin photosensitizer, which is currently approved to treat a number of diseases, including esophageal, endobronchial, and bladder cancers and Barrett’s esophagus with high grade dysplasia.12,25 Foscan, also known as Temoporfin or mTHPC, has an absorption maximum of 652 nm and is approved in Europe for recurrent, inoperable head and neck cancers, and it is being investigated in ongoing clinical trials for the treatment of other neoplastic conditions.25,26 Simulations performed at 670 nm were chosen to correspond to the absorption of photosensitizers such as HPPH or methylene blue. HPPH has been used in the treatment of thoracic malignancies,27,28 Barrett’s esophagus,29 and early cancers and precancers of the oral cavity.30 Methylene blue is FDA-approved as a diagnostic dye and is the only known treatment for methemoglobinemia. Methylene blue has also been used successfully as a photosensitizer in a number of PDT studies.31–33 Benzoporphyrin derivative (BPD), also known as verteporfin, has an absorption maximum of 692 nm and is approved worldwide for the treatment of age-related macular degeneration.12 The wavelength of 780 nm was chosen to correspond to the absorption of some emerging photosensitizers, such as TOOKAD34 and others still in preclinical development,35 which are designed to take advantage of increased penetration of light in this spectral range. Based on our findings, these next-generation sensitizers with high absorption at 780 nm and beyond would be favorable candidates for clinical trials of interstitial PDT of renal cancers. We conclude that image-guided, interstitial PDT in selected populations of patients with kidney tumors is feasible and should be considered a viable treatment option. AcknowledgmentsThe authors thank Susan Schoen, Elizabeth M. Smith, Maureen Kiernan, and Kay Rust in the Department of Urology for help with patient recruiting and tissue accrual. We thank Laurie Baxter from the Department of Pathology for coming to our laboratory to section the kidneys. We are grateful for JoAnne McNamara’s help with Research Subject Review Board protocols and consent forms. This work was supported by NIH Grant CA68409 awarded by the National Cancer Institute. ReferencesR. SiegelD. NaishadhamA. Jemal,
“Cancer statistics, 2012,”
CA Cancer J. Clin., 62
(1), 10
–29
(2012). http://dx.doi.org/10.3322/caac.20138 CAMCAM 0007-9235 Google Scholar
H. T. CohenF. J. McGovern,
“Renal-cell carcinoma,”
N. Engl. J. Med., 353
(23), 2477
–2490
(2005). http://dx.doi.org/10.1056/NEJMra043172 NEJMAG 0028-4793 Google Scholar
M. D. Dunnet al.,
“Laparoscopic versus open radical nephrectomy: a 9-year experience,”
J. Urol., 164
(4), 1153
–1159
(2000). http://dx.doi.org/10.1016/S0022-5347(05)67131-5 JOURAA 0022-5347 Google Scholar
B. R. LaneA. C. Novick,
“Nephron-sparing surgery,”
Br. J. Urol., 99
(5b), 1245
–1250
(2007). http://dx.doi.org/10.1111/bju.2007.99.issue-5b BJURAN 0007-1331 Google Scholar
E. O. Olwenyet al.,
“Radiofrequency ablation versus partial nephrectomy in patients with solitary clinical T1a renal cell carcinoma: comparable oncologic outcomes at a minimum of 5 years of follow-up,”
Eur. Urol., 61
(6), 1156
–1161
(2012). http://dx.doi.org/10.3410/f.717951122.793456423 Google Scholar
R. J. Zagoria,
“Percutaneous image-guided radiofrequency ablation of renal malignancies,”
Radiol. Clin. North Am., 41
(5), 1067
–1075
(2003). http://dx.doi.org/10.1016/S0033-8389(03)00074-5 0033-8389 Google Scholar
T. PowellC. WhelanB. F. Schwartz,
“Laparoscopic renal cryotherapy: biology, techniques and outcomes,”
Minerva Urol. Nefrol., 57
(2), 109
–118
(2005). 0393-2249 Google Scholar
T. K. Choueiriet al.,
“Thermal ablation vs surgery for localized kidney cancer: a surveillance, epidemiology, and end results (SEER) database analysis,”
Urology, 78
(1), 93
–98
(2011). http://dx.doi.org/10.1016/j.urology.2011.01.068 0090-4295 Google Scholar
E. A. Singeret al.,
“Impact of genetics on the diagnosis and treatment of renal cancer,”
Curr. Urol. Rep., 12
(1), 47
–55
(2011). http://dx.doi.org/10.1007/s11934-010-0156-y 1527-2737 Google Scholar
N. S. CurryN. K. Bissada,
“Radiologic evaluation of small and indeterminant renal masses,”
Urol. Clin. North Am., 24
(3), 493
–505
(1997). http://dx.doi.org/10.1016/S0094-0143(05)70398-0 0094-0143 Google Scholar
P. Harrod-Kim,
“Tumor ablation with photodynamic therapy: introduction to mechanism and clinical applications,”
J. Vasc. Interv. Radiol., 17
(9), 1441
–1448
(2006). http://dx.doi.org/10.1097/01.RVI.0000231977.49263.DE JVIRE3 1051-0443 Google Scholar
P. Agostiniset al.,
“Photodynamic therapy of cancer: an update,”
CA Cancer J. Clin., 61
(4), 250
–281
(2011). http://dx.doi.org/10.3322/caac.v61:4 CAMCAM 0007-9235 Google Scholar
M. G. NicholsE. L. HullT. H. Foster,
“Design and testing of a white-light, steady-state diffuse reflectance spectrometer for determination of optical properties of highly scattering systems,”
Appl. Opt., 36
(1), 93
–104
(1997). http://dx.doi.org/10.1364/AO.36.000093 APOPAI 0003-6935 Google Scholar
E. L. HullM. G. NicholsT. H. Foster,
“Quantitative broadband near-infrared spectroscopy of tissue-simulating phantoms containing erythrocytes,”
Phys. Med. Biol., 43
(11), 3381
–3404
(1998). http://dx.doi.org/10.1088/0031-9155/43/11/014 PHMBA7 0031-9155 Google Scholar
A. Ishimaru, Wave Propagation and Scattering in Random Media, IEEE Press, New York, NY
(1997). Google Scholar
E. L. HullT. H. Foster,
“Steady-state reflectance spectroscopy in the P3 approximation,”
J. Opt. Soc. Am. A, 18
(3), 584
–599
(2001). http://dx.doi.org/10.1364/JOSAA.18.000584 JOAOD6 0740-3232 Google Scholar
B. C. WilsonS. L. Jacques,
“Optical reflectance and transmittance of tissues: principles and applications,”
IEEE J. Quantum Electron., 26
(12), 2186
–2199
(1990). http://dx.doi.org/10.1109/3.64355 IEJQA7 0018-9197 Google Scholar
C. R. Simpsonet al.,
“Near-infrared optical properties of ex vivo human skin and subcutaneous tissues measured using the Monte Carlo inversion technique,”
Phys. Med. Biol., 43
(9), 2465
–2478
(1998). http://dx.doi.org/10.1088/0031-9155/43/9/003 PHMBA7 0031-9155 Google Scholar
N. Hondaet al.,
“Determination of the tumor tissue optical properties during and after photodynamic theapy using inverse Monte Carlo method and double integrating sphere between 350 and 1000 nm,”
J. Biomed. Opt., 16
(5), 058003
(2011). http://dx.doi.org/10.1117/1.3581111 JBOPFO 1083-3668 Google Scholar
T. M. BaranT. H. Foster,
“New Monte Carlo model of cylindrical diffusing fibers illustrates axially heterogeneous fluorescence detection: simulation and experimental validation,”
J. Biomed. Opt., 16
(8), 085003
(2011). http://dx.doi.org/10.1117/1.3613920 JBOPFO 1083-3668 Google Scholar
L. WangS. L. JacquesL. Zheng,
“MCML—Monte Carlo modeling of light transport in multi-layered tissues,”
Comput. Methods Programs Biomed., 47
(2), 131
–146
(1995). http://dx.doi.org/10.1016/0169-2607(95)01640-F CMPBEK 0169-2607 Google Scholar
H. Patelet al.,
“Motexafin lutetium-photodynamic therapy of prostate cancer: short- and long-term effects on prostate-specific antigen,”
Clin. Cancer Res., 14
(15), 4869
–4876
(2008). http://dx.doi.org/10.1158/1078-0432.CCR-08-0317 1078-0432 Google Scholar
C. J. Lightdaleet al.,
“Photodynamic therapy with porfimer sodium versus thermal ablation therapy with laser for palliation of esophageal cancer: a multicenter randomized trial,”
Gastrointest. Endosc., 42
(6), 507
–512
(1995). http://dx.doi.org/10.1016/S0016-5107(95)70002-1 0016-5107 Google Scholar
A. Johanssonet al.,
“Realtime light dosimetry software tools for interstitial photodynamic therapy of the human prostate,”
Med. Phys., 34
(11), 4309
–4321
(2007). http://dx.doi.org/10.1118/1.2790585 MPHYA6 0094-2405 Google Scholar
A. E. O’ConnorW. M. GallagherA. T. Byrne,
“Porphyrin and nonporphyrin photosensitizers in oncology: preclinical and clinical advances in photodynamic therapy,”
Photochem. Photobiol., 85
(5), 1053
–1074
(2009). http://dx.doi.org/10.1111/php.2009.85.issue-5 PHCBAP 0031-8655 Google Scholar
S. B. BrownE. A. BrownI. Walker,
“The present and future role of photodynamic therapy in cancer treatment,”
Lancet Oncol., 5
(8), 497
–508
(2004). http://dx.doi.org/10.1016/S1470-2045(04)01529-3 LOANBN 1470-2045 Google Scholar
G. M. Loewenet al.,
“Endobronchial photodynamic therapy for lung cancer,”
Lasers Surg. Med., 38
(5), 364
–370
(2006). http://dx.doi.org/10.1002/(ISSN)1096-9101 LSMEDI 0196-8092 Google Scholar
C. B. Simoneet al.,
“Photodynamic therapy for the treatment of non-small cell lung cancer,”
J. Thorac. Dis., 4
(1), 63
–75
(2012). http://dx.doi.org/10.3978/j.issn.2072-1439.2011.11.05 JTDOBK 2072-1439 Google Scholar
H. R. Navaet al.,
“Photodynamic therapy (PDT) using HPPH for the treatment of precancerous lesions associated with Barrett’s esophagus,”
Lasers Surg. Med., 43
(7), 705
–712
(2011). http://dx.doi.org/10.1002/lsm.21112 LSMEDI 0196-8092 Google Scholar
U. Sunaret al.,
“Monitoring photobleaching and hemodynamic responses to HPPH-mediated photodynamic therapy of head and neck cancer: a case report,”
Opt. Express 14969
–14978
(2010). http://dx.doi.org/10.1364/OE.18.014969 Google Scholar
J. L. Williamset al.,
“Methylene blue and the photodynamic therapy of superficial bladder cancer,”
J. Photochem. Photobiol. B, 4
(2), 229
–232
(1989). http://dx.doi.org/10.1016/1011-1344(89)80010-7 JPPBEG 1011-1344 Google Scholar
K. Orthet al.,
“Intraluminal treatment of inoperable oesophageal tumours by intralesional photodynamic therapy with methylene blue,”
The Lancet, 345
(8948), 519
–520
(1995). http://dx.doi.org/10.1016/S0140-6736(95)90617-7 LOANBN 1470-2045 Google Scholar
J. P. Tardivoet al.,
“Treatment of melanoma lesions using methylene blue and RL50 light source,”
Photodiagnosis Photodyn. Ther., 1
(4), 345
–346
(2004). http://dx.doi.org/10.1016/S1572-1000(05)00005-0 1572-1000 Google Scholar
C. Frammeet al.,
“Evaluation of the new photosensitizer Tookad (WST09) for photodynamic vessel occlusion of the choroidal tissue in rabbits,”
Invest. Ophthalmol. Vis. Sci., 47
(12), 5437
–5446
(2006). http://dx.doi.org/10.1167/iovs.06-0532 IOVSDA 0146-0404 Google Scholar
G. LiR. K. Pandey,
“Synthesis, comparative photosensitizing efficacy, human serum albumin (site II) binding ability, and intracellular localization characteristics of novel benzobacteriochlorins derived from vic-Dihydroxybacteriochlorins,”
J. Med. Chem., 46
(25), 5349
–5359
(2003). http://dx.doi.org/10.1021/jm030341y JMCMAR 0022-2623 Google Scholar
|