|
|
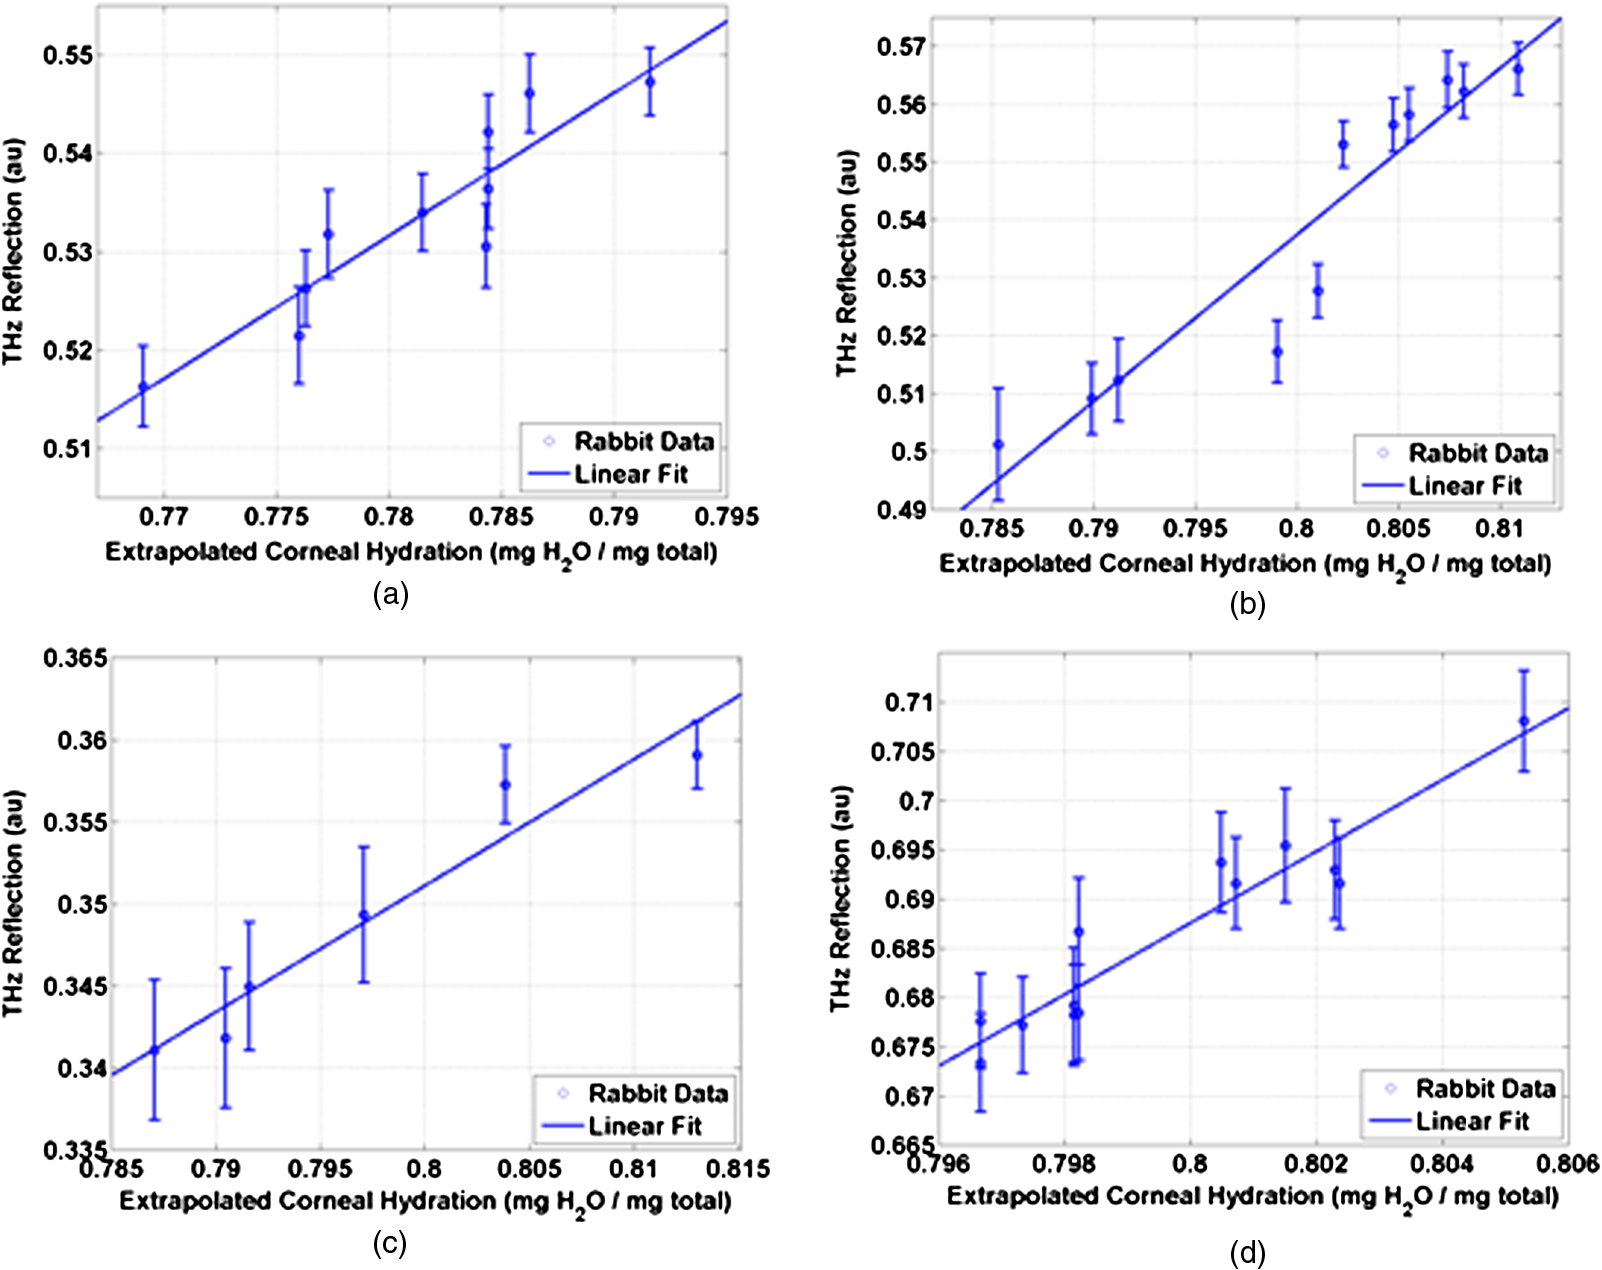
1.IntroductionInterest in terahertz (THz) medical imaging has increased due to recent results in numerous diagnostic imaging applications. The THz band represents a unique combination of the relatively high spatial resolution available in the far infrared regime coupled with the low scatter and large interaction with hydrogen bonding in bulk water seen in the millimeter wave regime. As such, it has become a potentially powerful tool for assessing the water content in target materials. Medical applications of this technology have taken advantage of THz sensing’s strong sensitivity to water to produce systems that can accurately differentiate tissues based on differences in water content. This methodology has been applied to several cases in which diseased or injured tissue differs in hydration from the surrounding healthy tissue. This technology has been used for cases such as thermal burns, chemical burns, superficial cancers, and liver disease.1–8 THz images of thermal burns were first demonstrated on ex vivo chicken skin burned using an argon ion laser by Mittleman et al.9 It has been demonstrated again in ex vivo porcine skin burns induced using a thermal brand.10 THz imaging of chemical burns was demonstrated on 33% sulfuric acid burns on ex vivo porcine skin by Bennett et al.6 This study achieved time-resolved imaging which showed the severity of the burn progressing over a 2-h time course. THz evaluation of water content was also used to distinguish cirrhosis in liver tissue extracted from Sprague-Dawley (SD) rats.8 Alongside this exploration of new applications, in vitro analysis has also been completed to examine the effects of exposure to THz radiation. These studies have treated lymphocytes,11,12 fibroblast samples,13 and keratinocytes,14,15 with radiation at approximately 0.12 THz, 2.52 THz, and 0.2 to 3.0 (broadband) THz, respectively, and found no significant detrimental effects on cell cycle kinetics and no discernible chromosomal damage. The modest gene expression changes, measured in cells exposed 2.52 THz radiation at intensities of ,were reproduced both by ultraviolet light exposure and submersion in a heated water bath, suggesting that the effects of THz exposure on cells are likely due to the slight rise of temperature that the illumination produces.13 These initial results indicate that THz radiation may be used safely by ensuring that exposure remains sufficiently below levels which heat tissues under study, and it is anticipated that continued in vitro and eventually in vivo experiments will further clarify the safety and potential risks of THz illumination on living cells and how to manage them. More recently, THz medical imaging applications, previously established in ex vivo tissues, have begun to be evaluated in vivo. The first successful demonstration of in vivo THz imaging of a disease process was achieved by Tewari et al.16 in 2011. This study evaluated partial and full-thickness burns on SD rats. The rats were imaged every 15 min the first hour and 30 min afterwards for a period of 8 h continuously. Follow up scans were taken at 12, 24, 48, and 72 h. The resultant data was compared with pathology analysis. These images demonstrate correlation of the water content of the burned tissues with the severity and extent of damage in the burned skin, and effectively capture elements of the wound healing process as it evolves in time. This work establishes a potential application of mapping and tracking corneal hydration with THz imaging in vivo. The results suggest that THz imaging can be used as a supplement to central corneal thickness methods for the assessment of corneal hydration. Disease and injury-related hydration changes degrade the clarity and transparency of the cornea, which compromise patient vision. Such changes are caused by Fuchs Dystrophy, trauma, infection, and tissue rejection in patients of corneal transplantation.17,18 Other vision-impairing diseases produce measurable changes in corneal hydration by mechanisms that are not completely understood, including keratoconus.19 THz sensing has the potential to fill the current absence of an accurate, quantitative clinical method for assessing the hydration of the cornea. 2.SimulationWe have published, previously, on the theory associated with the feasibility skin hydration imaging with THz illumination hydration in the skin. The purpose of this work is to identify the regions in the THz regime that yield the highest sensitivity to changes in water content to facilitate earlier and more accurate detection of hydration states that correspond to corneal pathologies and diseases. The first step is to obtain an estimate of hydration changes exhibited by the diseases discussed in the introduction by analyzing studies of these diseases reported in the literature. 2.1.Hydration Sensing in Corneal DiseaseThe current clinical method for assessing corneal hydration is to infer it from central corneal thickness (CCT) measurements obtained via ultrasound pachymetry. CCT correlates with water content because the collagen matrix of the corneal tissue must swell/contract to accommodate the amount of fluid present. The relationship between CCT and the average water concentration in the eye was first studied in the mid 1960’s when the correlation between hydration and thickness was measured in eleven human corneas from an eye bank.20 The regression function, computed from these ex vivo corneas, relates the absolute water concentration to the mass of water and dry cornea component with the CCT following this equation: While it is currently the clinically accepted method of assessing corneal hydration, the limitations of hydration analysis using CCT measurement due to biological variation is evident from viewing this 11-cornea dataset. It is further setback by patient discomfort and infection risk associated with necessary contact between the probe and the cornea of the patient, and also by the intrinsic error of ultrasound measurements which are computed to limit its resolution to water concentration changes of 0.4%.21 If noninvasive corneal hydration sensing with improved resolution can be achieved, it may allow corneal diseases to be detected earlier and with improved sensitivity and specificity.In previous work,21 the water concentration changes characteristic of several corneal diseases were extrapolated from published studies of corresponding CCT measurements. These values are used in this work as performance metrics that must be met for corneal hydration sensing systems to be clinically useful. The values for identifying Fuchs dystrophy, corneal graft rejection, and keratoconus are computed using Eq. (1) and displayed in Table 1. Table 1Corneal hydration change characteristic of applications in ophthalmology. These estimates are obtained from published pachymetry studies of diseases using the CCT-hydration relationship described earlier.21 2.2.Hydration Sensing in Corneal Refractive SurgeryThe resolution threshold to allow real-time hydration-sensing applications in refractive surgery can be estimated by combining typical parameters for an advanced LASIK procedure with the reported hydration-dependence etch-rate of corneal tissue. If a lengthy procedure to correct moderate to high myopia ( or roughly 140 microns of tissue) and a final accuracy of at least 0.5 diopters (or roughly 7 µm of tissue) is needed for excellent outcomes,22 then the excimer laser must operate with a fractional etch rate, , which varies by less than 5%. This tolerance can be combined with the hydration-etch rate trend reported by Dougherty et al.:23 where is the tissue hydration (mass dry cornea) with a value of 3.45 in bovine cornea. The nominal etch rate in bovine tissue (an accepted animal model for human cornea) was measured to be 44 µg with a hydration-dependent change of 5.6 µg hydration. This suggests an etch rate hydration-dependency of /unit hydration or per 1% change in water concentration. This suggests that a real-time hydration monitoring technology must be capable of resolving water concentration changes finer than 2.0% to provide adequate feedback.2.3.Stratified Media Model for the CorneaMeasurements of the composite dielectric properties of biological tissues have been reported by numerous groups.24–27 However, similar analysis of corneal tissue is insufficient because it would ignore the depth-dependent tissue hydration changes and the associated changes in the tissue dielectric properties that are characteristic of corneal diseases. The cornea sustains a water concentration gradient between the well-hydrated aqueous humor and the dry external environment, therefore, the water concentration and associated dielectric function increase with depth in the tissue. For the purpose of comparing the frequencies of the THz band to each other, we propose a simplified one-dimensional (1-D) model of this hydration gradient in the cornea. This approach approximates the cornea’s dielectric properties using a model which assumes a laterally homogeneous water concentration profile and uses stratified media theory to analyze the cornea as a stack of uniform layers of depth-dependent dielectric function (see Fig. 1). Fig. 1Illustration of stratified media model for corneal tissues with laterally uniform dielectric sheets of longitudinally increasing permittivity.  This stratified media model was used to simulate THz imaging of skin tissue in our previous work.28 The dominant dielectric species in the cornea is water and the THz reflectivity drops with water concentration.6 The hydration and, hence, dielectric properties of each layer of the stack are, therefore, constructed from a measurement of the depth dependent in vivo water concentration profile of the cornea obtained using confocal near infrared (NIR) Raman spectroscopy. Note, that although this method yields accurate results, it requires illumination fluencies that are higher than the approved ANSI standard for human exposure. Thus, data obtained from this method has been acquired from a rabbit model shown in Fig. 2.29 Fig. 2Water concentration profile in a rabbit model in vivo obtained by confocal Raman spectroscopy.29  The data in Fig. 2 reports the water concentration in the cornea of a New Zealand White rabbit obtained at three time points. In these experiments, the cornea was allowed to equilibrate in the closed position and then fixed open. Measurements were taken immediately upon opening, and then again after 42 and 171 min of exposure to the outside environment. When the eye is initially opened, the water concentration is seen to monotonically rise from about 78% (3.5 mg ) at the air/cornea interface to about 83% (5 mg ) at the cornea/aqueous humor interface. During the experiment, the cornea was seen to dry preferentially from the outside-surface progressing inward, as expected, due to the change in the boundary condition arising from the loss of the eyelid barrier. The drying behavior progresses axially at long time durations. Comparison of these three curves is significant because the average corneal water concentration changes between A-B and B-C are similar (2.1% versus 1.7%), but the former describes shallow changes in tissue while the latter describes deeper changes. As such, the short duration drying is comparable to superficial corneal applications such as keratoconus and hydration monitoring in LASIK while the long duration drying is a more relevant model to diseases and procedures that affect the deeper cornea such as Fuchs dystrophy and some instances of corneal graft rejection. Following the stratified media methods developed in our previous work,28 an effective media model was constructed to compute the dielectric properties of corneal tissues using the water concentration profile data from Fig. 2. The Bruggemen model was selected because it remains valid as the volume fractions of the constituent species range through all of their possible values. The frequency-dependent dielectric function of water and dehydrated corneal tissue are available in the literature. The dielectric function of water follows a double-Debye model of: where , is the wave frequency and , , , , and .30 The dielectric constant of dry cornea tissue was measured to be 1.52.31 Using this technique, the dielectric properties of the corneal tissue are computed as a function of frequency and depth, and an example profile is shown at 500 GHz in Fig. 3. The increase in both refractive index and tissue absorption in the more-hydrated deeper layers can be seen. At this frequency, the skin depth in the anterior 20% of the corneal tissue is between 73 and 83 µm, which implies that the primary determinant of the corneal reflectivity is the first few hundred micrometers of tissue. The plot demonstrates differences between the real and imaginary refractive indexes of these three profiles within this depth, which predicts that reflectometry using 500 GHz will successfully produce contrast.Fig. 3Simulated depth-dependent dielectric properties at 500 GHz computed from the measured corneal hydration of an in vivo rabbit model.  Using the computed dielectric data displayed in Fig. 2, the the aggregate THz reflectivity of the simulated rabbit cornea is plotted with respect to frequency in Fig. 3 using data from all three time points. The THz reflectivity values, shown in this plot, decrease monotonically as the illumination frequency increases displaying reflectivity at 100 GHz down to reflectivity at 800 GHz. At all frequencies in the computed spectra, the THz reflectivity sorts the corneas by hydration with increasing hydration corresponding to increasing reflectivity, suggesting that the amplitude of a reflected THz wave may be utilized in the measurement of hydration in a corneal sample. To explore the frequencies with the highest intrinsic contrast, we compute the vertical separation of these plots with respect to the three time points. In other words, the frequency-dependent contrast was calculated. To quantify this contrast, we computed the derivative as a function of frequency, which describes the expected change in reflectivity of the cornea between these three time points as shown in Fig. 4. Fig. 4(a) Simulated THz reflectivity of in vivo rabbit cornea at the three time points described above. (b) THz reflectivity difference between the corneal spectra shown above. 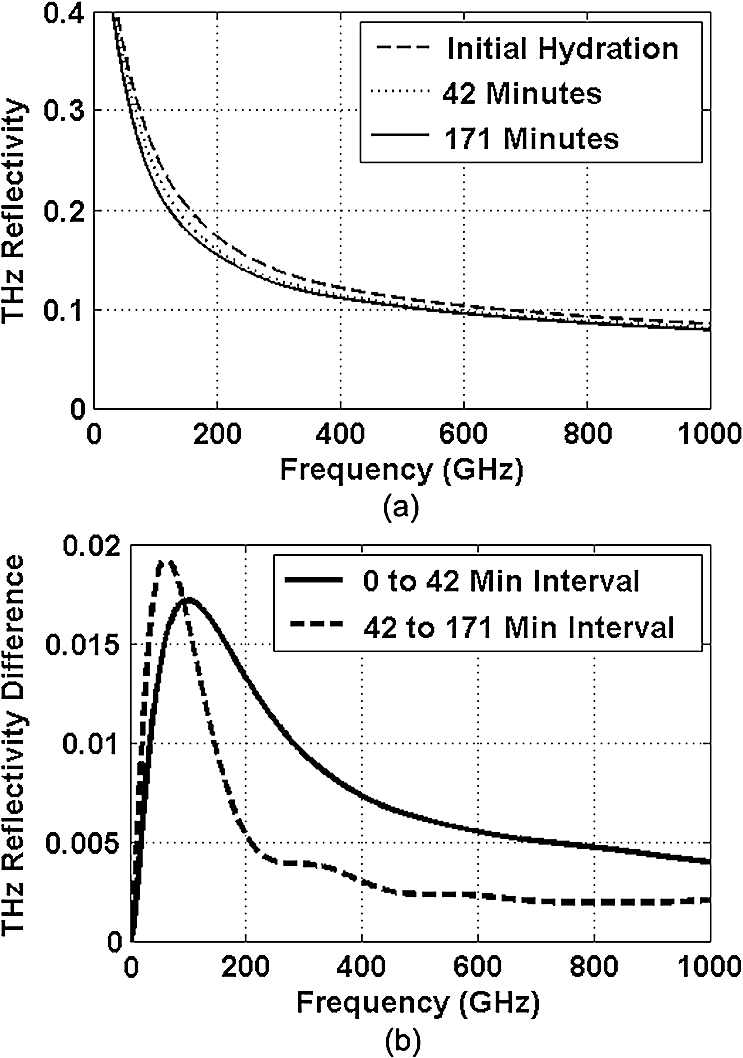 The resulting curves show a maximum reflectivity difference at 100 and 60 GHz for the first and second interval, respectively, with decreasing values at both higher and lower frequencies. The decrease in contrast at high frequencies comes from the decreased imaginary part of the tissue permittivity, while the decreased difference at low frequencies results from the finite thickness of the cornea. Illumination corresponding to wavelengths below 100 GHz begins to interact significantly with structures lying behind the cornea and less significantly with the cornea itself. Thus, the sensitivity and penetration depth aspects of corneal hydration sensing are predicted to be best balanced at 100 GHz. Interestingly, the water concentration data of Fig. 2 gives a local minimum in the 141 min data inside the corneal at a depth of 20% of the cornea’s thickness. This suggests that the cornea’s epithelial surface retains water more effectively than the tissues slightly interior to it. When the THz reflection spectrum of Fig. 4 is simulated from this data, a local maximum arises at about 300 GHz. This is because this frequency interacts especially strongly with this interior “dry patch” relative to the frequencies just higher and lower than 300 GHz that interact more significantly in just above and beneath this depth, respectively. 3.THz Spectroscopy System3.1.TeraView TPS Spectra 3000 CF Spectroscopy SystemThe accuracy/validity of the modeling presented in the previous section was assessed with THz spectroscopy data obtained using a commercial time domain spectroscopy system (TPS Spectra 3000 CF system, TeraView). This system uses a proprietary photoconductive transceiver pumped by a Ti:Sapphire mode-locked laser (, , average ). It has a reflection-mode module that is used to acquire reflection data from a sample with an incidence and reflection angle of 30 deg from the vertical. The reflected waveform from a target is obtained by optoelectronic sampling, which can acquire a spectrum in 1 s with a frequency resolution of 6 GHz. 3.2.100 GHz Point-Measurement SystemA diagram of the reflectometry system is shown in Fig. 5. A Gunn diode source (Spacek Labs) emits linearly, polarized, free space radiation at 100 GHz with approximately 1 GHz frequency modulated bandwidth achieved by sweeping the bias voltage of the device between 7 and 10 V at 1 kHz. A pyroelectric detector (Spectrum Detector) with noise-equivalent power of is employed as the detector. The pyroelectric detector has a 3 dB video bandwidth of and, thus, is insensitive to the modulation bandwidth of the Gunn diode source. The illumination beam from the Gunn diode source is collimated and focused by a pair of 100 mm focal length, 50 mm diameter Teflon lenses and illuminates the target at a 10 degree incidence angle. The reflected signal is collected and focused into the aperture of the pyroelectric detector by a second Teflon lens pair. In these experiments, the source was electronically modulated at 30 Hz to avoid significant noise, and the signal read out with a Lock-In Amplifier (SR830, Stanford Research Systems). Fig. 5Illustration of experimental apparatus for measuring the hydration sensitivity of a Gunn Diode—based point sensing system operating at 100 GHz.  The system was calibrated with the target material removed to measure the base noise level and a copper reference reflector to measure total beam power. A hydration sensitivity of better than six parts in 10,000 (0.06%) has been measured in the physiologically relevant range between 70% and 82% water concentration using custom hydration calibration targets.32 4.Results4.1.THz Hydration Sensitivity in Corneal TissuesSpectroscopy studies were performed with ex vivo porcine corneas to validate the models developed here and to demonstrate THz hydration sensing in actual corneal tissues. Freshly harvested corneas were coerced to varying static hydrations by soaking them them in 0%, 3%, 5%, and 7% polyethylene glycol (PEG) solutions containing 0.15M NaCl for three days.33 This protocol produced corneas hydrated at 79%, 87%, 89%, and 92%.6 These corneas were placed at the focal point of the TeraView spectroscopy system and the spectra in Fig. 6 were captured. A decrease in THz reflectivity following an increase in illumination frequency is observed indicating that more reflected power is available for detection at lower frequencies for the same illumination power. An increase in THz reflectivity with water concentration is seen at all frequencies, confirming that the interaction between THz radiation and corneal tissues is dominated by water. Additionally, the signal difference between the four corneas is much larger at low frequencies than at high frequencies, illustrating the increase in the intrinsic contrast at low frequencies predicted by the simulations. The modeling tools described previously were also used to simulate the reflection from these corneas and the results are indicated by dashed line. These show a strong correspondence in all four corneas. 4.2.THz Hydration Sensing In VivoIn vivo studies are an irreplaceable step to accurately evaluate corneal hydration sensing because the hydration gradient in the cornea is maintained in part by the active transport of water by the endothelium, which ceases function at death. As a first step towards understanding how THz radiation will ultimately interact with human corneal tissue, an animal model was selected for initial study. New England white male rabbits, which are a common model for the human cornea, were chosen because of their similar size, shape, and hydration.34,35 Following an institutionally approved animal research protocol, four rabbits were anesthetized using and of Ketamine and Xylazine, respectively, followed by intubation with a flow of Isoflourane. Each rabbit was placed in turn on an imaging cart with the head plate adjusted to accommodate the rabbit’s neck and head and secure the intubation tubes. Next, the right eye was held open and dehydrated using a gentle air blower for 15 min. A mylar window, of 12.5 µm, was lowered onto the cornea’s surface to secure it in place and constrain it to a horizontal planar geometry with respect to the imaging optics. With the mylar window separating the epithelium from the outside environment, the dehydrated cornea is observed to increase in hydration over the course of a few hours. This hydration increase was observed by both ultrasound and reflectometry techniques. A reflectometry measurement was first acquired using the 100 GHz millimeter wave system. The CCT is also measured using an ultrasound pachymeter. These two measurements were repeated at approximately 10 min intervals until the water concentration equilibrated. For each measurement, the 100 GHz reflectivity of the cornea was computed and plotted with respect to the corneal water concentration as computed, by Eq. (1), using the pachymetry device (see Fig. 7). Each THz reflection measurement entailed a rapid acquisition of 60 samples. Each data point shown below represents the mean of those samples with a 95% confidence interval indicated by error bars. All four rabbits show a positive correlation between the THz reflection signal and the corneal hydration as measured by the pachymetry device. Significantly, although the water concentration change realized in this experiment is only a few percent, the THz instrument was able to resolve multiple hydration levels within this interval with statistical significance defined by a 95% confidence level. The computed regression line on each plot can be used to calculate the sensitivity to corneal water concentration that was realized in each rabbit model. The variance present in these measurements is estimated by assuming the general case of heteroskedastic data whose worse-case variance can be taken to be the largest variance measured.36 where is the standard deviation of the ’th measurement. The slope of each linear regression shown above is an estimation of the change in reflectivity produced by a change in cornea tissue hydration. The water concentration sensitivity can therefore be computed by: where is the water concentration of the cornea and is the slope of the regression line. Using this analysis, the hydration sensitivity realized in each plot was computed as summarized in Table 2.Table 2Measured sensitivity to corneal water concentration (noise-equivalent water concentration change) measured in four live New England white rabbit models.
Tissue hydration sensitivities of about 0.33% or better were achieved in all four rabbits. A sensitivity of 8.4 parts in 10,000 was achieved in the last rabbit. This sensitivity is slightly less than the hydration characterization target described previously.32 Notably, these sensitivities all exceed the performance of ultrasound pachymetry methods discussed earlier. This sensitivity exceeds the critical resolution of all of the proposed applications discussed above. The deep-penetrating 100 GHz frequency, employed here, is predicted to perform detection of both superficial water concentration changes such as those studied in infection, trauma, and refractive surgery applications as well as deeper water concentration changes such as those caused by Fuchs dystrophy. This work offers a theoretical treatment of THz hydration sensing in corneal tissues which predicts increased sensitivity at . This model successfully matched spectroscopy measurements on artificially hydrated porcine corneal tissue studied ex vivo. Finally, it provides the first demonstration of in vivo THz hydration sensing in the cornea of four live rabbit models. Further research will apply this technology to assess corneal disease models and perform a thorough evaluation of the safety of this technique. Additionally, we will experiment with hydration sensing at higher frequency illumination and explore tradeoffs between hydration sensitivity and spatial resolution. With the presented imaging system, the spot size () allowed only point measurements of the entire cornea. In future work we will report on the use of higher frequency and smaller spot sizes to generate hydration maps of the cornea. AcknowledgmentsThis work was supported by the Telemedicine and Advanced Funding provided by the Telemedicine and Advanced Technology Research Center (TATRC) Department of Defense under award number W81XWH-09-2-0017 and a student research grant from the American Society of Lasers in Medicine and Surgery. This material is also based in part upon work supported by the National Science Foundation under Grant Number ECCS-801897. Any opinions, findings, and conclusions or recommendations expressed in this material are those of the authors and do not necessarily reflect the views of the National Science Foundation. ReferencesR. M. Woodwardet al.,
“Terahertz pulse imaging of ex vivo basal cell carcinoma,”
J. Invest. Dermatol., 120
(1), 72
–78
(2003). http://dx.doi.org/10.1046/j.1523-1747.2003.12013.x JIDEAE 0022-202X Google Scholar
E. Berryet al.,
“Multispectral classification techniques for terahertz pulsed imaging: an example in histopathology,”
Med. Eng. Phys., 26
(5), 423
–430
(2004). http://dx.doi.org/10.1016/j.medengphy.2004.02.011 MEPHEO 1350-4533 Google Scholar
R. M. Woodwardet al.,
“Terahertz pulse imaging in reflection geometry of human skin cancer and skin tissue,”
Phys. Med. Biol., 47
(21), 3853
–3863
(2002). http://dx.doi.org/10.1088/0031-9155/47/21/325 PHMBA7 0031-9155 Google Scholar
V. P. Wallaceet al.,
“Terahertz pulsed imaging of basal cell carcinoma ex vivo and in vivo,”
Br. J. Dermatol., 151
(2), 424
–32
(2004). http://dx.doi.org/10.1111/bjd.2004.151.issue-2 BJDEAZ 1365-2133 Google Scholar
D. Mittleman,
“Terahertz imaging,”
Springer Ser. Opt. Sci., 86 117
(2002). SSOSDB 0342-4111 Google Scholar
D. B. Bennettet al.,
“Terahertz sensing in corneal tissues,”
J. Biomed. Opt., 16
(5), 057003
(2010). http://dx.doi.org/10.1117/1.3575168 Google Scholar
S. SyS. Huang,
“Terahertz spectroscopy of liver cirrhosis: investigating the origin of contrast,”
Phys. Med. Biol., 55
(24), 7587
–96
(2010). http://dx.doi.org/10.1088/0031-9155/55/24/013 PHMBA7 0031-9155 Google Scholar
S. Huanget al.,
“Terahertz pulsed imaging of liver cirrhosis,”
in 34th Int. Conf.on IRMMW-THz 2009,
1
–2
(2009). Google Scholar
D. M. Mittlemanet al.,
“Recent advances in terahertz imaging,”
Appl. Phys. B Lasers Opt., 68
(6), 1085
–1094
(1999). http://dx.doi.org/10.1007/s003400050750 APBOEM 0946-2171 Google Scholar
Z. D. Tayloret al.,
“Reflective terahertz imaging of porcine skin burns,”
Opt. Lett., 33
(11), 1258
–1260
(2008). http://dx.doi.org/10.1364/OL.33.001258 OPLEDP 0146-9592 Google Scholar
M. R. ScarfÌet al.,
“THz exposure of whole blood for the study of biological effects on human lymphocytes,”
J. Biol. Phys., 29
(2), 171
–176
(2003). http://dx.doi.org/10.1023/A:1024440708943 JBPHBZ 0092-0606 Google Scholar
A. Doriaet al.,
“THz radiation studies on biological systems at the ENEA FEL facility,”
Infrared Phys. Technol., 45
(5–6), 339
–347
(2004). http://dx.doi.org/10.1016/j.infrared.2004.01.014 IPTEEY 1350-4495 Google Scholar
G. J. Wilminket al.,
“Quantitative investigation of the bioeffects associated with terahertz radiation,”
Proc. SPIE, 7562 75620L
(2010). http://dx.doi.org/10.1117/12.844916 Google Scholar
R. H. ClothierN. Bourne,
“Effects of THz exposure on human primary keratinocyte differentiation and viability,”
J. Biol. Phys., 29
(2), 179
–185
(2003). http://dx.doi.org/10.1023/A:1024492725782 JBPHBZ 0092-0606 Google Scholar
G. Zhaoet al.,
“Design and performance of a THz emission and detection setup based on a semi-insulating GaAs emitter,”
Rev. Sci. Instrum., 73
(4), 1715
–1719
(2002). http://dx.doi.org/10.1063/1.1459095 RSINAK 0034-6748 Google Scholar
P. Tewariet al.,
“In vivo terahertz imaging of rat skin burns,”
J. Biomed. Opt., 17
(4), 040503
(2012). http://dx.doi.org/10.1117/1.JBO.17.4.040503 Google Scholar
R. Mandellet al.,
“Corneal hydration control in Fuchs’ dystrophy,”
Invest. Ophthalmol. Vis. Sci., 30
(5), 845
–852
(1989). IOVSDA 0146-0404 Google Scholar
P. J. McDonnellet al.,
“Corneal thickness changes after high-risk penetrating keratoplasty,”
Arch. Ophthalmol., 111
(10), 1374
–1381
(1993). http://dx.doi.org/10.1001/archopht.1993.01090100082032 AROPAW 0003-9950 Google Scholar
S. J. GromackiJ. T. Barr,
“Central and peripheral corneal thickness in keratoconus and normal patient groups,”
Optomet. Vis. Sci., 71
(7), 437
–441
(1994). http://dx.doi.org/10.1097/00006324-199407000-00003 OVSCET 1040-5488 Google Scholar
J. YtteborgC. H. Dohlman,
“Corneal edema and intraocular pressure: II. clinical results,”
Arch. Ophthalmol., 74
(4), 477
–484
(1965). http://dx.doi.org/10.1001/archopht.1965.00970040479008 AROPAW 0003-9950 Google Scholar
D. B. Bennettet al.,
“Terahertz sensing in corneal tissues,”
J. Biomed. Opt., 16
(5), 057003
(2011). http://dx.doi.org/10.1117/1.3575168 JBOPFO 1083-3668 Google Scholar
A. Sugaret al.,
“Laser in situ keratomileusis for myopia and astigmatism: safety and efficacy: a report by the American Academy of Ophthalmology,”
Ophthalmology, 109
(1), 175
–187
(2002). http://dx.doi.org/10.1016/S0161-6420(01)00966-6 OPANEW 0743-751X Google Scholar
P. J. DoughertyK. L. WellishR. K. Maloney,
“Excimer laser ablation rate and corneal hydration,”
Am. J. Ophthalmol., 118
(2), 169
–176
(1994). AJOPAA 0002-9394 Google Scholar
D. W. Winterset al.,
“Estimation of the frequency-dependent average dielectric properties of breast tissue using a time-domain inverse scattering technique,”
IEEE Trans. Antennas Propag., 54
(11), 3517
–3528
(2006). http://dx.doi.org/10.1109/TAP.2006.884296 IETPAK 0018-926X Google Scholar
C. W. Gillianet al.,
“Materials for phantoms for terahertz pulsed imaging,”
Phys. Med. Biol., 49
(21), N363
–N369
(2004). http://dx.doi.org/10.1088/0031-9155/49/21/N01 PHMBA7 0031-9155 Google Scholar
E. Pickwellet al.,
“Simulation of terahertz pulse propagation in biological systems,”
Appl. Phys. Lett., 84
(12), 2190
–2192
(2004). http://dx.doi.org/10.1063/1.1688448 APPLAB 0003-6951 Google Scholar
A. J. Fitzgeraldet al.,
“Catalogue of human tissue optical properties at terahertz frequencies,”
J. Biol. Phys., 29
(2), 123
–128
(2003). http://dx.doi.org/10.1023/A:1024428406218 JBPHBZ 0092-0606 Google Scholar
D. B. Bennettet al.,
“Stratified media model for terahertz reflectometry of the skin,”
J. Sensors IEEE, 11
(5), 1253
–1262
(2011). http://dx.doi.org/10.1109/JSEN.2010.2088387 ISJEAZ 1530-437X Google Scholar
N. Baueret al.,
“Noninvasive assessment of the hydration gradient across the cornea using confocal Raman spectroscopy,”
Invest. Ophthalmol. Vis. Sci., 39
(5), 831
–835
(1998). IOVSDA 0146-0404 Google Scholar
J. T. KindtC. A. Schmuttenmaer,
“Far-infrared dielectric properties of polar liquids probed by femtosecond terahertz pulse spectroscopy,”
J. Phys. Chem., 100
(24), 10373
–10379
(1996). http://dx.doi.org/10.1021/jp960141g JPCHAX 0022-3654 Google Scholar
D. M. Maurice,
“The structure and transparency of the cornea,”
J. Physiol., 136
(2), 263
–286
(1957). JPHYA7 0022-3751 Google Scholar
S. Sunget al.,
“Reflective measurement of water concentration using millimeter wave illumination,”
Proc. SPIE, 7984 798434
(2011). http://dx.doi.org/10.1117/12.883257 Google Scholar
K. M. Meeket al.,
“Synchrotron x-ray diffraction studies of the cornea, with implications for stromal hydration,”
Biophys. J., 60
(2), 467
–474
(1991). http://dx.doi.org/10.1016/S0006-3495(91)82073-2 BIOJAU 0006-3495 Google Scholar
A. Hughes,
“A schematic eye for the rabbit,”
Vis. Res., 12
(1), 123
–38
(1972). http://dx.doi.org/10.1016/0042-6989(72)90143-5 VISRAM 0042-6989 Google Scholar
G. Freytag,
“Die Brechungsindices der linse und der flussigen augenmedien bei katze und beim kanninchen,”
Arch. Vergl. Opthal., 1 61
–72
(1910). Google Scholar
S. ChatterjeeA. S. Hadi, Regression Analysis by Example, 4th ed.Wiley-Interscience, Hoboken, NJ
(2006). Google Scholar
|