|
|
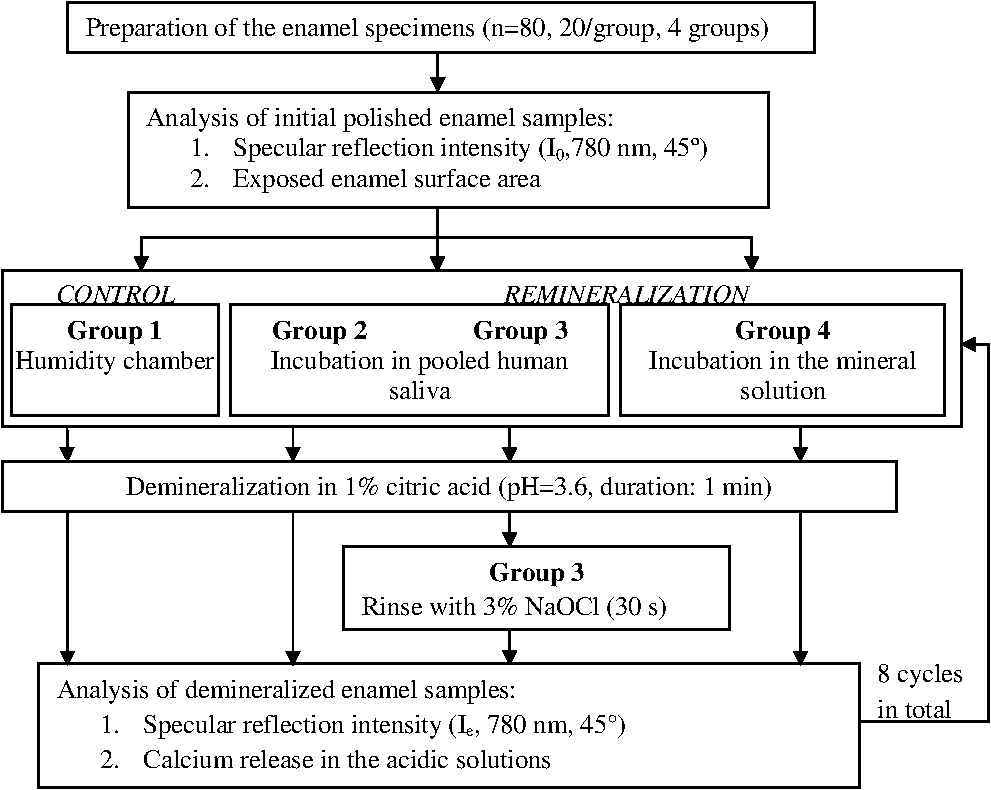
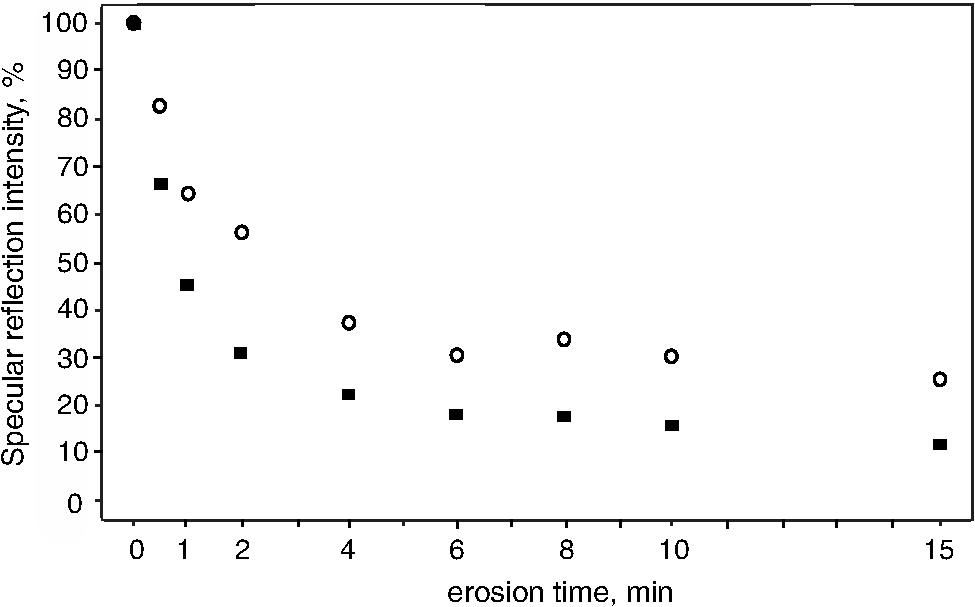
1.IntroductionMultiple chemical and physical reactions occur during the lifetime of the enamel surface of teeth. One of them is the dissolution of dental hard tissue by acids of nonbacterial origin, which leads to dental erosion. Although intrinsic1 (gastric) and extrinsic (dietary)2 acids are considered to be the main causes of dental erosion, it is typically the interplay of numerous factors, such as abrasion, attrition, flow rate, and properties of saliva, and tooth susceptibility to dissolution that all contribute to the erosion process. Generally, initial demineralization results in the softening of the originally hard enamel.3 This softened enamel layer is highly vulnerable to abrasion and can be easily removed by tooth brushing.4,5 Persistent acidic impact induces further demineralization and contributes to a gradual loss of the enamel tissue.6 The softened layer has the potential to be partially remineralized, thus the erosion progression can be slowed down thereby postponing the need for dental intervention. Therefore, early diagnosis is important to prevent erosive tooth wear. Unfortunately, currently used visual diagnosis does not permit detection of minor tooth changes at the early phase of dental erosion.7,8 Only at late stages, when the extent of tissue loss results in the alteration of tooth shape, appearance, and optical properties are the erosive wear and progression revealed. Often, significant erosive tooth wear induces tooth hypersensitivity and requires expensive restorative therapies.9 To improve the situation, much attention has been given to the development of new techniques,10–15 which provide a quantitative assessment of dental erosion. Among the different varieties, optical diagnostic tools have certain advantages due to their noninvasive and nondestructive evaluation of dental tissues, and fast signal acquisition and data analysis. For example, a fiber optic backscatter spectroscopic sensor was successfully applied to monitor in vitro enamel demineralization and remineralization.16 Thomas et al10 used another fiber optic setup to monitor change of the diffuse reflection spectra after demineralization of enamel and dentine samples. However, the authors concluded that the diffuse reflection signal had a low sensitivity for enamel etching. Similar observation of the low sensitivity of the diffuse reflection intensity toward enamel erosion was reported in our previous publication.17 Additionally, it was found that the diffuse reflection signal had higher tooth-to-tooth variability compared to the intensities of the specular reflection.17 The latter can be due to a natural complexity and inhomogeneity of the sound and eroded enamel. Several publications addressed absorption coefficients,18 scattering anisotropy,19 and angular scattering distributions20 in the sound enamel as well as the effects of the wavelengths and tissue orientation (to the light source) on its scattering properties. Different diffusion theory models were also developed to determine the optical parameters of healthy tissue.21,22 However, enamel roughness and porosity increases during erosion progression resulting in alteration of its optical properties. Several models were proposed to study the interaction of optical waves with rough surfaces23,24 but it is still difficult to predict these interactions in tissues at different degrees of the erosion progression. Previous experimental results showed no wavelength dependence of the increase of the diffuse reflection during erosion progression in the range of 400 to 800 nm.17 No impact of the wavelength (400 to 800 nm) was also found in case of the specular reflection intensity. However, it was specular reflection that changed dramatically already after the first seconds of erosion.17 Thus, enamel demineralization for only 30 s in citric acid (0.65%, ) resulted in a 40% loss of specular reflection.17 A strong correlation was found between a decrease in specular reflection intensity and an increase in enamel surface roughness during erosion progression.17 The reported in vitro study was a first attempt to develop a fast, simple, and sensitive optical technique for quantitative diagnostics of early dental erosion. To make the next step in the development of this method for clinical application, the present authors considered different factors that might affect the reflection signal from dental surfaces in vivo. Because the intensity of the specular reflection was mostly affected by the surface roughness of the enamel tissue,17 abrasion of teeth was regarded as an important parameter that could not be excluded from the analysis. Moreover, dental tissues can be remineralized by saliva and salivary proteins that are constantly present on the enamel surface of teeth as a continuous layer called the salivary pellicle. This layer is permanently renewed by the fresh portion of secreted proteins derived from the salivary flow and could have a potential effect on the reflection signal from the underlying enamel tissue. Hence, the impact of the pellicle layer on the optical measurement of enamel was also addressed in the present study. To differentiate between the contribution of the pellicle layer and the remineralization effect of the saliva in general, additional remineralizing mineral solution having no proteins but the same pH and calcium-to-phosphate ratio () as human saliva was introduced into the study design. To mimic the clinical conditions as closely as possible, the study was performed with human extracted teeth and human pooled saliva as a natural remineralization source. 2.Experimental Part2.1.Materials2.1.1.ChemicalsCitric acid (, , Merck, Darmstadt, Germany), sodium chloride (NaCl, , Merck), potassium chloride (KCl, , Merck), lanthanum nitrate hexahydrate [, , Merck], potassium dihydrogenphosphate (, Merck, , Merck), calcium chloride (, , Merck), sodium hydroxide (NaOH, , Merck), sodium hypochlorite (NaOCl, , Merck), and hydrochloric acid (HCl, , Merck) were used to prepare the corresponding solutions. A calcium standard solution (Titrisol®, Merck) was used for the preparation of calibration standards for atomic absorption spectroscopy. 2.1.2.Preparation of human enamel specimensAll enamel specimens () were prepared from caries-free human molar teeth extracted by dental practitioners in Switzerland. Before the extraction, the patients were informed about the use of their teeth for research purposes and consent was obtained. All teeth were stored in 1% chloramin T trihydrate solution after the extraction. Teeth crowns were separated from the roots using Isomet® Low Speed Saw (Buehler, Düsseldorf, Germany) and coated by red nail polish for determination of the exposed enamel area. The buccal sites of the specimens were embedded into the resin (Paladur, Heraeus Kulzer GmbH, Hanau, Germany) in two planar parallel moulds. The thinner mould (200 μm thick) was removed while the teeth in the thicker one (7.5 mm thick) were serially abraded under constant tap water cooling using Knuth Rotor machine (LabPol 21, Struers, Copenhagen, Denmark) with silicon carbide paper discs of grain size 18, 8, and 5 μm, 60 s each. The embedded enamel blocks were taken out of the molds before being polished for 60 s with 3 μm diamond abrasive on Struers polishing cloth under constant cooling (LaboPol-6, DP-Mol Polishing, DP-Stick HQ, Struers, Copenhagen, Denmark). Between two polishing steps and after the final polishing, all slabs were ultrasonicated for 1 min in tap water and rinsed. Thus, all prepared specimens had a flat ground enamel area with a 200 μm cut off layer. Samples were stored in a mineral solution (, , , )25 and underwent further polishing with a 1 μm diamond abrasive (60 s, LaboPol-6, DP-Mol Polishing, DP-Stick HQ, Struers, Copenhagen, Denmark) immediately before the experiment. 2.1.3.Human pooled stimulated salivaParaffin-wax-stimulated saliva from 25 healthy donors was collected into ice-chilled vials, pooled, and centrifuged (). The supernatant was collected for the experiment and stored at between experiments. Each defrosted saliva portion was transparent, had a pH of and calcium () content of 1.25 mM. 2.1.4.Preparation of the mineral solutionThe following salts were dissolved in deionized water: , , NaCl (6.51 mM), and KCl (14.95 mM). The pH of the obtained solution was adjusted to 7.4 by addition of HCl (1N). The ratio of the prepared mineral solution was 0.23. A lowering of the pH value to 7.4 was performed to avoid precipitation of salts that was observed at (pH of the applied human saliva). 2.2.Methods2.2.1.Removal of the salivary pellicle from the enamel surfaceEnamel specimens incubated in human saliva were subsequently rinsed under constant agitation (, Salvis, Reussbühl, Switzerland) for 30 s in 5 mL of aqueous 3% NaOCl solution (group 3, experiment 2) to remove the salivary pellicle layer before the reflection analysis (Fig. 1). Afterward, samples were rinsed with deionized water (20 s) and dried with oil-free air (5 s). 2.2.2.In vitro enamel erosionIn experiment 1, erosive conditions identical to a previous study17 were applied in order to be able to compare the results. The prepared enamel specimens were immersed in 30 mL of citric acid (0.65%, 15) for 0.5, 1, 2, 4, 6, 8, 10, or 15 min under constant agitation (, Salvis) at 30°C. Samples were removed from acidic solutions, rinsed with deionized water (20 s), and dried with oil-free air (5 s). In experiment 2, enamel samples were incubated in 30 mL of citric acid (1%, ) at 30°C for 1 min. Then, the samples were rinsed with deionized water (20 s) and dried with oil-free air (5 s). Here, 1% citric acid was applied (experiment 2) as many other studies26–28 in the field use the same erosive conditions, thus the results could be compared. 2.2.3.Abrasion of the enamel surfaces by tooth brushing (in vitro)Automatically controlled tooth brushing of the enamel samples was performed on the brushing machine (Syndicad Ingenieurbüro, München, Germany). Twenty strokes with a load of 200 g (Trisa Ultra® toothbrushes, Triengen, Switzerland) were applied at the same frequency to each sample in tap water. After brushing, the specimens were rinsed with deionized water and dried for 5 s with oil-free air. 2.2.4.Remineralization procedures (experiment 2)Enamel samples were remineralized in pooled human saliva (groups 2 and 3), or in the mineral solution (group 4). Accordingly, enamel specimens were incubated for 1 h at 25°C either in pooled human saliva (see Sec. 2.1.3) or in the mineral solution (see Sec. 2.1.4), gently rinsed in fresh portions of deionized water (, dip-and-rinse) and left to dry at room temperature. 2.2.5.Spectral resolved reflectometer and measurements of the reflection intensity (I)Identical device setup, measurement procedure and data analysis were applied in the present study as described before.17 A switch between 45 and 60 deg angles of incidence and reflection was performed by moving and fixing the illumination and measurement arms (Fig. 2). The intensity of the reflection was measured at 45 and 60 deg angles of incidence and reflection in experiment 1 and only at a 45 deg angle in experiment 2. The reflection spectra were collected in the full wavelength range, i.e. 400 to 800 nm. Data analysis was performed at the 780 nm wavelength according to the previous study.17 A 100% reflection intensity was assigned to the noneroded enamel surfaces. The reflection intensity in the eroded () enamel samples was calculated according to the equation where is the specular reflection intensity measured in the enamel sample eroded for time , is the reflection signal from the same polished enamel sample before erosion, and is the reflection signal due to the ambient light (all measured at the same angles of incidence and reflection). This data analysis was performed for the results obtained in the erosion experiments 1 and 2. The reflection intensity in abraded eroded enamel () was calculated according to the similar equation: where is the specular reflection intensity measured in the enamel sample eroded for time and subsequently abraded.Fig. 2Scheme of the experimental setup that was used for the measurements of eroded and abraded eroded enamel samples at 45 deg (black) and 60 deg (grey) angles of incidence and reflection. The change of the measurement angles was performed by moving the illumination and measurement arms accordingly.  2.2.6.Analysis of calcium release from the enamel tissue, calculation of the exposed enamel surface area, and measurement of enamel surface roughnessThe same procedures, parameters, and instruments were used for calcium analysis in the acidic solutions (atomic absorption spectroscopy), determination of the enamel surface area, and measurement of the enamel surface roughness (confocal point sensor) as published before.17 Briefly, the roughness of teeth was measured before and after erosion and abrasion (experiment 1). The change in roughness after erosion and abrasion was defined for each sample as ratios and , respectively, where and are roughness values after erosion and abrasion, respectively, and is the original roughness of the sound polished enamel sample. 2.2.7.Scanning electron microscopyRepresentative specimens were mounted on aluminum stubs and sputtered with gold/palladium (100 s, 50 mA) using a sputtering device (Balzers SCD 050, Balzers, Liechtenstein). SEM was performed with a Stereoscan S360 scanning electron microscope at 20 kV (Cambridge Instruments, Cambridge, United Kingdom). Equal digital SEM micrographs (of and magnifications, respectively) were generated for each specimen (Digital Image Processing System, version 2.3.1.0, point electronic GmbH, Halle, Germany). For the imaging of the cross-sections, enamel slabs embedded into the resin were fixed and cut through the surface with an Isomet® low-speed saw (Buehler, Düsseldorf, Germany). Samples were rinsed in water and dried in air flow. The cross-sections were mounted in the sample holders and sputtered with gold/palladium (100 s, 50 mA) using a sputtering device (Balzers SCD 050, Balzers, Liechtenstein). The subsurface areas in the close proximity to the exposed enamel surface were imaged under the same conditions as applied for the surface imaging (see above). 2.2.8.Statistical data analysisA total of 104 human molar teeth were used in experiment 1, i.e. 10 enamel samples were eroded for each of eight chosen erosion times plus an additional 24 eroded samples were taken for SEM imaging. A total of 80 human molar teeth were used in experiment 2, where 20 enamel samples were prepared and included in each of four groups (Fig. 1). Statistical data analysis was performed using a nonparametric ANOVA model (F1_LD_F1)29 and pairwise Wilcoxon rank sum tests with Bonferroni—Holm correction for multiple testing. The level of significance was set at 0.05. The software program R 2.9.11 was used for the statistical data analysis. The main results are presented as box plots with marked outlier points (hollow circles). 2.3.Study DesignThe present study consisted of two separate experiments, 1 and 2, divided according to the effects of 1. abrasion and measurement angles and 2. remineralization and pellicle layer on the erosion assessment by reflectometer. In experiment 1, the original polished enamel samples were randomly assigned to eight groups () with the corresponding erosion time in acid (0.5, 1, 2, 4, 6, 8, 10, and 15 min). The surface area, surface roughness () and specular reflection intensities () were measured at 45 and 60 deg angles of incidence and reflection in the original polished enamel specimens. Furthermore, erosive challenges (Sec. 2.2.2) were performed for the allocated time durations (0.5, 1, 2, 4, 6, 8, 10, or 15 min), and surface roughness () as well as specular reflection intensity (, 45 deg angles) were measured in the eroded tissues. Then, the same eroded specimens were abraded by tooth brushing (Sec. 2.2.3) and the intensity of the specular reflection was measured again at 45 and 60 deg angles of incidence and reflection (), followed by the analysis of surface roughness (). Three additional enamel samples were included in each of eight groups ( total) and were taken out after erosive challenge for SEM analysis. Hence, a total of 104 teeth were used in experiment 1. In experiment 2, enamel samples were randomly assigned to four groups. One group of samples was incubated for 1 h in the humidity chamber between demineralization cycles (control group 1, ). Two groups of samples were incubated for 1 h in human pooled saliva (groups 2 and 3, ) between demineralizations. Groups 2 and 3 differed in an additional rinsing step with NaOCl, which was introduced in group 3 to remove the organic protein layer from the enamel surface prior to optical analysis (Fig. 1). The fourth group was subjected to a 1 h incubation in the mineral solution (group 4, ) having no proteins but the same calcium ion concentration () and similar pH as prepared human saliva. An identical sequence of treatments was applied to each group. The intensity of the specular reflection was measured at 45 deg angles for all sound polished enamel samples prior to acidic demineralizations (). Furthermore, all enamel specimens were treated in the remineralization/demineralization cycles (Secs. 2.2.2 and 2.2.4), including measurements of the specular reflection intensity at 45 deg angles after each demineralization step. A total of eight cycles were applied to each enamel sample in every group. All acidic solutions were stored after the erosive challenges for the analysis of calcium release from enamel samples. For clarity of presentation, Fig. 1 shows the scheme of the treatment procedures in experiment 2. Twenty enamel samples were used in demineralization/remineralization cycles in each of four treatment groups; 80 specimens in total. 3.Results3.1.Experiment 1A gradual decrease in the specular reflection intensity was measured at 45 deg angles of incidence and reflection in the enamel that was continuously eroded but not abraded (Fig. 3). In particular, enamel demineralization for 0.5, 1, and 2 min resulted in approximately 35%, 60%, and 83% loss of the original reflection intensity, respectively. The obtained change in the reflection values was in full agreement with the previously published results,17 demonstrating the good reproducibility of the reflection measurements. Subsequent abrasion of the eroded surfaces led to a significant increase () in the specular reflection intensities (45 deg angle) at applied erosion times (Fig. 3). More specifically, an approximate 6% increase of the specular reflection intensity was measured after abrasion of the enamel samples, which were eroded for 1 min in citric acid. Brushing the teeth eroded for 2 to 10 min resulted in the rise in the reflection signal compared to the samples that were only eroded (Fig. 3). Abrasion of the more severely eroded enamel surfaces () resulted in less of a difference () between signals measured after erosive and erosive-abrasive treatments. Comparison of the diffuse reflection intensities from the eroded and abraded eroded enamel samples showed no significant signal differences () at any of the erosion times. Both types of surfaces, i.e., eroded and abraded eroded samples, showed increase of the diffuse reflection intensities during erosion progression (not presented). Fig. 3Change of the specular reflection intensity during erosion progression in eroded (gray signs) and eroded abraded enamel samples (light-gray signs) measured at 45 deg angles of incidence and reflection.  It was concluded in the previous study17 that the decrease in the specular reflection intensity with erosion progression was mainly related to the increase in the enamel surface roughness. To explain the increase in the signal values after abrasion of the eroded teeth, SEM images were taken from the enamel interfaces after erosion and abrasion. Representative examples of the photographs are shown in Fig. 4. Here, the typical honeycomb pattern of eroded enamel tissue appeared after continuous demineralization without abrasive treatment [Fig. 4(a), 4(b), and 4(c-1)]. However, this pattern disappeared after brushing the eroded samples [Fig. 4(d), 4(e), and 4(f-1)]. The surfaces of the abraded teeth revealed numerous scratches and signs of the mechanical impact but no more traces of the prismatic topography. Demineralized subsurface tissue was found in the cross-sections of both eroded and abraded eroded teeth [Fig. 4(c-2) and 4(f-2)]. It can be noticed that the surface of the abraded samples looked visually smoother. To analyze the change in surface roughness quantitatively, a confocal point sensor was applied for the comparative analysis of the relative roughness values. Figure 5 shows change of surface roughness in the eroded and abraded eroded enamel samples. A similar tendency to increase in roughness was observed within the first 4 min of erosion in eroded and abraded eroded specimens. However, permanently reduced surface roughness was measured in the samples eroded for and subjected to further abrasion compared to enamel surfaces that were only eroded (Fig. 5). Fig. 4SEM images of the representative enamel samples eroded for (a) 4, (b) 8 and (c) 15 min, and the enamel specimens eroded for the same time periods but subsequently abraded under identical tooth brushing conditions (d) to (f), respectively. Cross-sections through the surface of eroded (C-2) and abraded eroded (F-2) enamel are shown with indication of thin demineralized subsurface on the section areas (asterisks). Note the samples are oriented upside down so that the surface-air interface is seen on the bottom of the image. 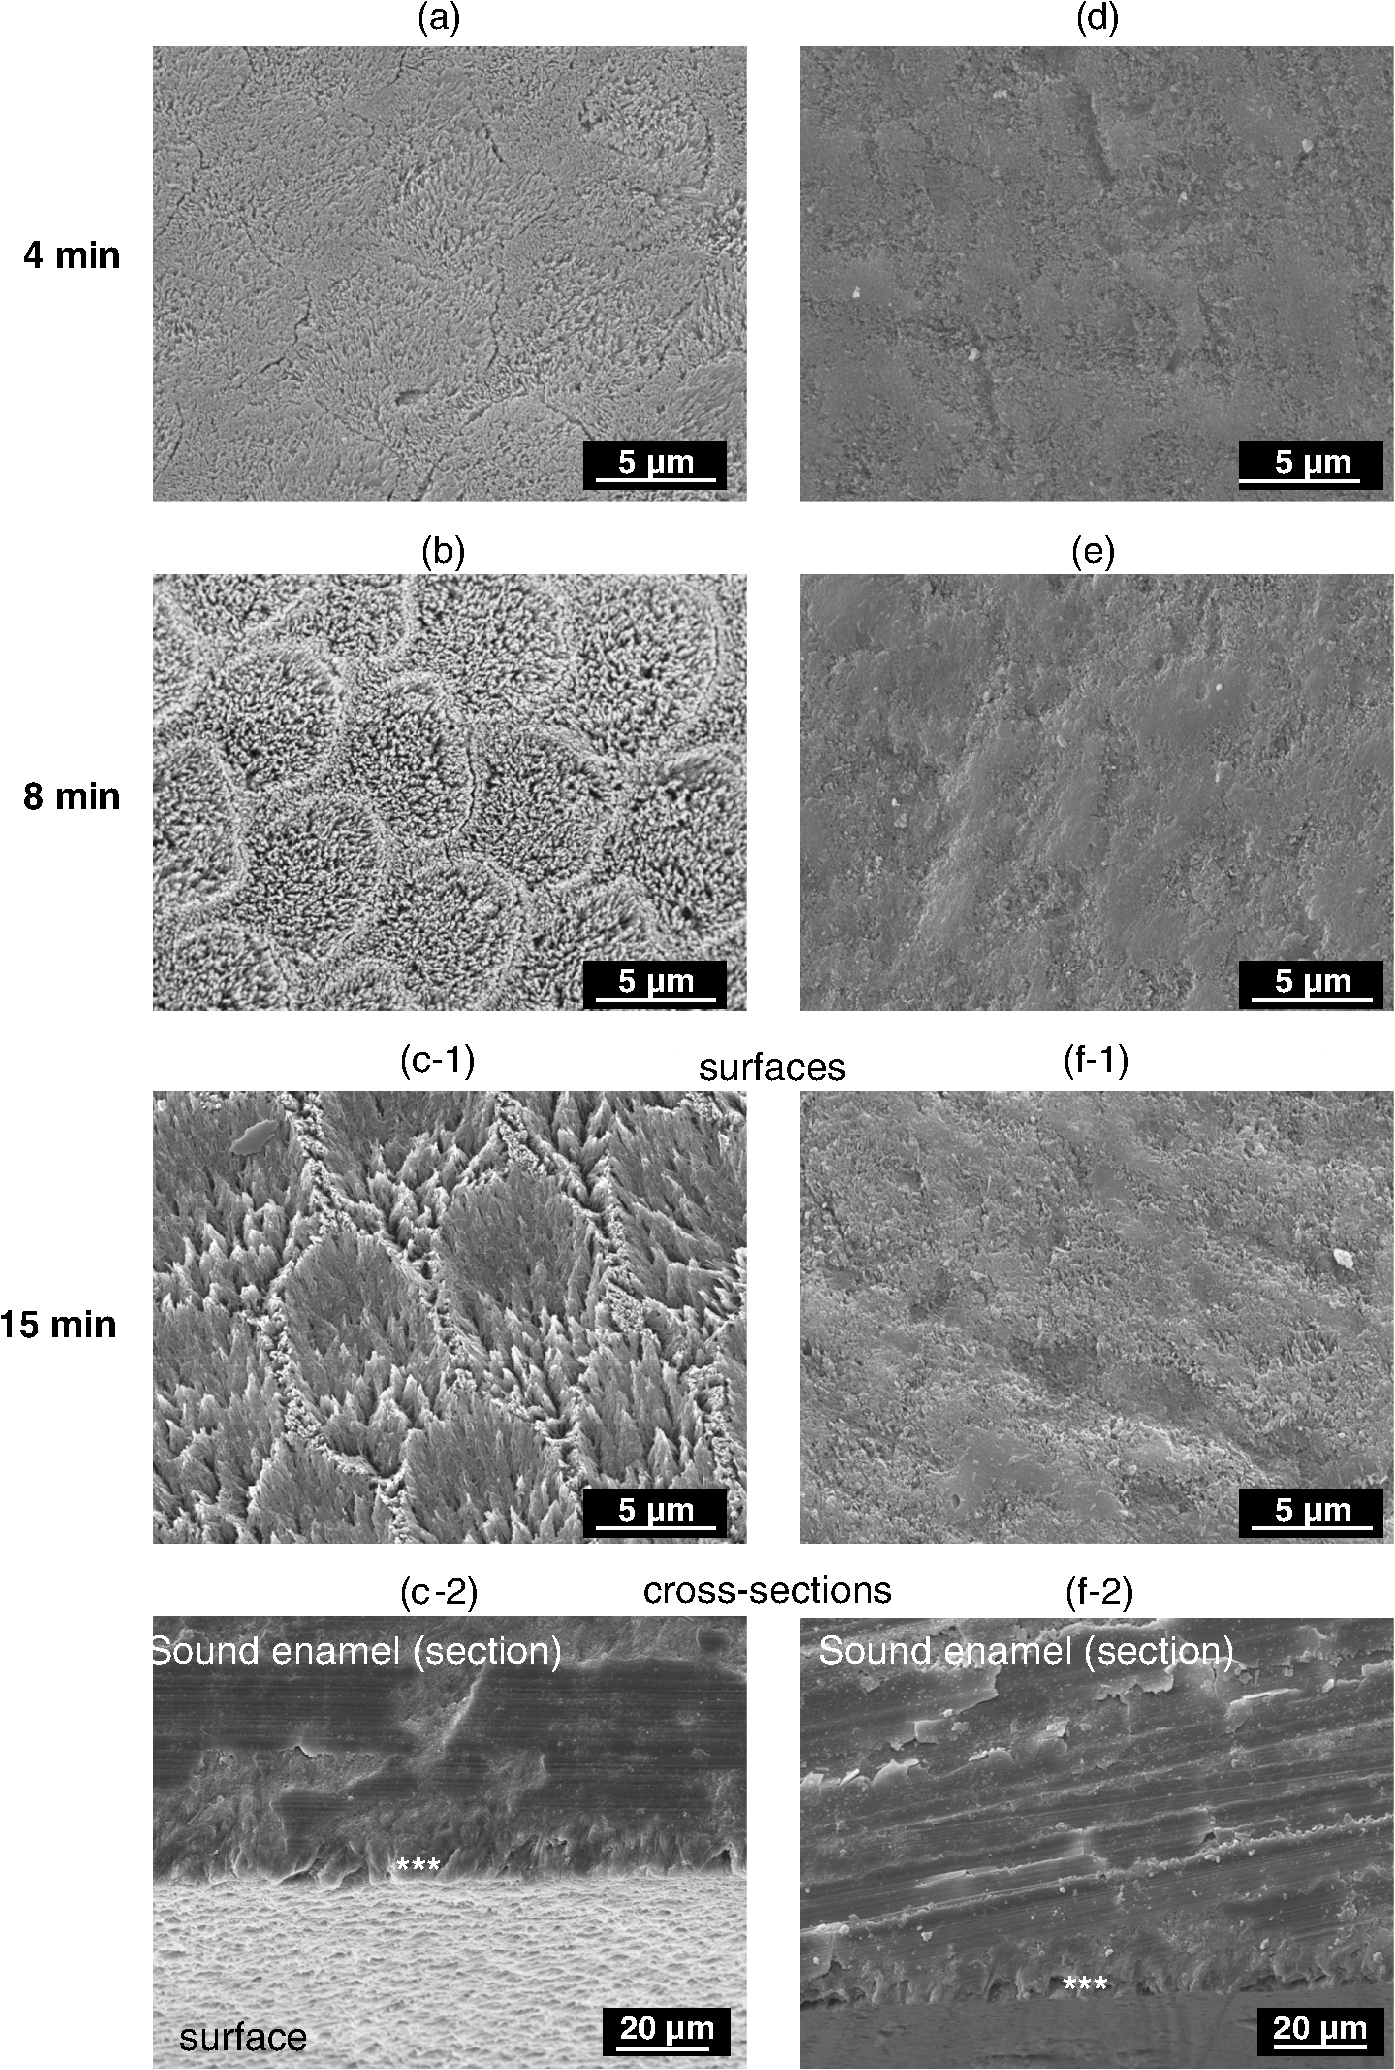 Fig. 5Relative surface roughness of the eroded enamel samples ( and abraded eroded specimens () measured by the confocal point sensor at different erosion times.  Measurements of the same abraded eroded teeth but at 60 deg angles of incidence and reflection revealed a less prominent decrease in the specular reflection intensity than the values obtained in the analysis at a 45 deg angle (Fig. 6). An approximately 20% reduction in the specular reflection intensity was detected after the first 0.5 min of enamel erosion by utilizing a 60 deg angle of incidence and reflection (1.7 times less signal change than that obtained with the 45 deg angle setup). Statistical data analysis revealed significant differences between the reflection signals measured at 45 and 60 deg angles () at erosion times . 3.2.Experiment 2Figure 7(a) shows a decrease in the specular reflection intensity as a function of the applied erosion time during continuous remineralization/demineralization cycles. Similar intensity values of around 62% to 66% and 40% to 44% were detected in all groups after a total of 1 and 2 min of erosion, respectively (, Table 1). Further remineralization/demineralization cycles () resulted in statistically significant differences (, Table 1) between reflection intensities measured in groups 1 and 2, 2 and 4, and 2 and 3. It can be seen that the reflection intensities in the enamel tissues remineralized in human saliva (group 2) were approximately 20% higher than in the enamel samples remineralized in a mineral solution [Fig. 7(a), group 4]. It was also significantly higher () than the reflection intensities measured in group 3, where the same remineralization in human saliva was applied but the salivary pellicle layer was removed from the enamel surface prior to the optical analysis. After an erosion duration of 3 to 5 min, an approximately 14% difference in the specular reflection intensity was found between groups 2 and 3, whereas an approximately 22% higher signal intensity was obtained in group 2 after 8 min of erosion (Table 2). Despite the pellicle removal, the measured reflection intensities at erosion times 6, 7, and 8 min were significantly higher () in group 3 than in the enamel samples remineralized in the mineral solution (groups , Table 1). Over the course of the experiment, the remineralization of eroded enamel in a mineral solution (group 4) did not affect the reflection signal relative to the control group (group 1) where no remineralization was carried out (, Table 1). A saturation of the reflection signal was observed at late erosion times [Fig. 7(a)] in all groups, similar to the previously published results.17 Fig. 7(a) Decrease in the specular reflection intensity and (b) kinetics of calcium release during erosion progression in four groups (experiment 2). Group 1 (control): enamel samples stored in a humidity chamber (1 h) between erosive treatments, black boxes. Group 2: enamel samples incubated in human saliva (1 h) between erosions, dark gray boxes. Group 3: enamel samples incubated in human saliva (1 h) between erosions and rinsed with 3% NaOCl solution prior to optical analysis, light-gray boxes. Group 4: enamel samples remineralized in the mineral solution (1 h) between erosive challenges, white boxes.  Table 1Analysis of the statistically significant differences between obtained values of the specular reflection intensities in treatment groups (experiment 2) at different total erosion times. Significant differences (p<0.05) are marked with “*”.
Table 2Relative difference (median values±standard deviations) between measured specular reflection intensities (Ie) in groups 2 and 3 during erosion progression.
Analysis of calcium ion release from enamel tissues after demineralization cycles was used as a well-accepted method for the assessment of erosion progression.25,30 In contrast to the reflection analysis, no statistically significant differences were found in calcium dissolution among all groups at all applied erosion times [Fig. 7(b)] except enamel samples remineralized in human saliva (group 2) and mineral solution (group 4) after a total of 8 min of erosion (Table 3). Moreover, approximately and of calcium release was measured in groups 2 and 4, respectively, after the entire demineralization period [8 min, Fig. 7(b)]. Table 3Analysis of the statistically significant differences between amounts of calcium ions released from the enamel tissues in treatment groups (experiment 2) at different total erosion times. Significant differences (p<0.05) are marked with “*”.
4.Discussion4.1.Assessment of Erosion Progression by Reflection Analysis of the Abraded Eroded TeethIt is known that demineralized enamel tissue is more susceptible to mechanical abrasion than sound enamel.4 Therefore, it was hypothesized that the optical diagnostics of dental erosion by the proposed technique could be affected by different degrees of tooth abrasion. The degree of abrasion of demineralized teeth, in turn, depends on the applied force,31 filament stiffness and end-rounding of the toothbrush,32 abrasive properties of the dentifrice,32 brushing frequency and number of applied strokes, and demineralization extent of the enamel.33 Because patients suffering from erosive tooth wear are usually recommended to use toothbrushes with relatively soft filaments,34,35 soft brushes (Trisa Ultra®) with a load of 200 g36,37 and 20 strikes were applied in the present study for the abrasive treatment. No dentifrice or slurry was used in experiment 1 to avoid side remineralization effects by the components of dentifrice (, , phosphates, etc). It has been shown previously that the brushing of softened enamel induced tissue wear even without application of a dentifrice.38 Brushing of the softened enamel samples eroded for less than 1 min did not significantly affect the reflection intensity (Fig. 3) or relative surface roughness (Fig. 5). The obtained results correlated well with the general observation of a minor brushing impact on the sound and slightly softened enamel.39,40 However, abrasion of the more eroded enamel tissues ( to 10 min, Fig. 3) resulted in the increased reflection signals. The increase in the specular reflection intensity correlated with the decreased enamel surface roughness after abrasive treatment, as was shown by SEM (Fig. 4) and confocal sensor analyses (Fig. 5). At the same time, the abrasion contribution to the reflection signal at to 10 min was similar for all samples regardless of the erosion duration, i.e. 4, 6, 8, or 10 min. It was shown in the previous study17 that erosion of the enamel samples for a total of 2 min caused only tissue softening but no substance loss, while further etching () resulted in the second phase of dental erosion, i.e. erosive tooth wear. Since similar erosive conditions and preparation of human molars were used in the current experiment, the observed difference in susceptibility of eroded enamel to tooth brushing could be related to the particular phase of dental erosion. Due to the multilayer hierarchical structure of enamel41,42 and different orientation of enamel rods,43 the dissolution rate of the composing crystals differs.44 Hence, the surface etching and roughening occurs heterogeneously, resulting in the formation of the softened tissue layer and characteristic eroded pattern on the surface.43 As soon as roughening took place, the intensity of the specular reflection started to decrease. Nevertheless, the remaining tissue hardness after 0.5 to 1 min of etching was, most probably, still high enough to resist the abrasive effect.39 This suggestion could explain similar intensities of the specular reflection measured in eroded and abraded eroded teeth at erosion times 0.5 to 1 min. As acid etching continued (), elimination of the uppermost enamel layers gradually started resulting in tissue loss. However, there are always softened layers present underneath the etched surface43 and the so-called “softening depth”45 of this layer remains constant during prolonged demineralization times.39 The latter means that a similar amount of the softened enamel would be mechanically removed under identical tooth brushing conditions after each following demineralization step. As a result, deeper enamel layers should be exposed after abrasion of the eroded samples, having comparable remaining surface roughness. Indeed, similar roughness was measured on the abraded eroded enamel at erosion times 4 to 10 min (Fig. 5). For the same abraded eroded samples, the signal of the specular reflection intensity was almost constant (Fig. 3). Abrasion of the enamel specimens eroded for 15 min reduced their surface roughness (Fig. 5), which was immediately detected by the increased specular reflection signal (Fig. 3). A less dense demineralized enamel tissue could be observed near the interface in the cross-sections of abraded eroded samples [Fig. 4(f-2)] as well as in the eroded enamel [Fig. 4(c-2)]. This altered subsurface ( μm) could correspond to the softened and/or transition part of the enamel, though the thickness of the softened enamel layer is typically between 0.2 and 3.0 μm.46 The presence of this demineralized enamel subsurface could also affect the reflection signal in both eroded and abraded eroded samples. However, it is difficult to differentiate between the roughening effect of the enamel interface and the contribution of the modified subsurface to the overall change of the reflection intensity. Due to different orientation of enamel rods,43 tilt of the embedded enamel slabs within the resin and smearing effect of the sawing procedure, the demineralized subsurface was only partially visible in the cross-sections of some of the samples. Therefore, the reliable thickness estimation of this layer could not be performed. Probably, fracturing of the samples would allow a better imaging of subsurface areas. There was no statistically significant difference () between increase of the diffuse reflection signals with erosion time detected in eroded and abraded eroded enamel samples. The low sensitivity of the diffuse reflection analysis for in vitro erosion assessment was found in the former study17 and was mentioned in another publication as well.10 4.2.Comparison of the Optical Measurements of Abraded Eroded Enamel at 45 and 60 deg Angles of Incidence and ReflectionA lack of sensitivity of the reflection signal to the erosion progression at late stages17 is one of the disadvantages of the current optical setup. Although applied in vitro erosive conditions typically exaggerate in vivo demineralization effects, different possibilities for measurement improvement were considered. A change in the measurement angle (angles of incidence and reflection) was one of them. Obviously, an increase of the angle from 45 to 60 deg did not improve the assessment of late erosion stages (Fig. 6). Similar signal saturation was observed at erosion times above 4 min as in the case of measurements at a 45 deg angle; therefore, all further experiments were performed using 45 deg angles (see experiment 2). 4.3.Optical Erosion Analysis in Enamel Samples Incubated with Human SalivaThe permanent presence of salivary flow in the mouth and, as a result, natural remineralization of teeth was another factor to be considered in clinical application. To gain first knowledge about this effect on the reflection intensity, human saliva was collected from several donors, and the enamel samples were incubated in pooled saliva after each demineralization treatment (groups 2 and 3, Fig. 1). Significantly higher reflection intensities were measured in group 2 (incubation in saliva) compared to the control group 1 at erosion times 4 to 8 min [Fig. 7(a)]. Since the reflection signal is mostly determined by the interfacial roughness, higher reflection intensities during erosion progression in group 2 indicated smoother surfaces of the eroded enamel than in control group 1. Reduced surface roughness could derive from the higher enamel resistance to acidic dissolution in group 2 (erosion inhibition) compared to group 1. The inhibition of dental erosion is typically detected by the reduced rate of calcium release from enamel tissue into acidic solutions. However, no significant differences were found between rates of calcium dissolution in control group 1 and group 2, indicating similar erosion progression in these groups [Fig. 7(b)]. It should be mentioned that the results of calcium analysis in group 2 must be considered with caution. Calcium ions are among the components of the pellicle layer; they are present in human saliva and are chelated by salivary proteins.47 Furthermore, it is known that the pellicle layer can be partially removed from the tooth surface during acid-induced demineralization,48 thus the components of the pellicle layer appear in the acidic solutions. The analysis of calcium concentrations in the acidic solution provides the total calcium content, where some of the calcium ions were released by the demineralized enamel tissue, but some of them could have originated from the detached salivary pellicle layer. To clarify the effect of the human saliva on the reflection signals in group 2, the measurement results were compared with the ones obtained in group 4, where enamel samples were incubated in the mineral solution containing no proteins but similar pH and ratio as applied human saliva. The term “remineralization” is used here based on the published reports about the remineralizing effect of human saliva49,50 and artificial saliva,51,52 a solution containing different mineral salts (, , , phosphates, buffers),51 and sometimes also mucin or caboxymethylcellulose.52–55 4.4.Analysis of the Erosion Progression Among Enamel Specimens Remineralized in the Mineral SolutionNo significant difference in the specular reflection intensities was detected at each of the erosion times among enamel samples treated in a mineral solution (group 4) and control group 1 [Fig. 7(a)]. Also, similar calcium dissolution rates were measured in these groups [Fig. 7(b)]. Most likely, the applied mineral solution did not provide detectable remineralization of the eroded enamel tissues. It can only be speculated that the incubation of the eroded enamel in the mineral solution induced certain ion uptake and nucleation inside the demineralized zone of the tissue; however, the crystal lattice of the hydroxyapatite could not be repaired and thus the additional acid resistance was not gained. Since erosion inhibition did not take place, the signals of the specular reflection intensity remained the same in groups 1 and 4. Considering the similar calcium release in groups 1, 2, and 4 and no detectable remineralizing effect of the mineral solution that had similar calcium content, ratio and pH to the applied saliva pool, the remineralization effect of the human saliva providing a 12% increase in the specular reflection intensity was not obvious. The finding of the present experiment contradicted previous studies where partial re-hardening and decrease of the mineral loss in the eroded enamel were reported after exposure to human saliva48 or remineralization solution.56,57 However, the obtained results were in agreement with the study of Garberoglio and Cozzani58 who reported no surface change of etched enamel even after 90 days of intraoral exposure. It must be mentioned that the composition of the mineral solution applied in the present study was based on those present in prepared human saliva. More specifically, the calcium concentration (1.25 mM) was adjusted to the applied saliva pool and the molar ratio of 0.23 (Sec. 2.1.4) was within the same range as stimulated human saliva (0.2 to 0.359,60). Previous studies,47,48,61 however, employed remineralization solutions with higher ratios, longer remineralization times, stronger etching procedures, and different temperature and wetting/drying conditions. Furthermore, fluoride was often added into the remineralization solution at higher concentrations than those found in human saliva (0.022 ppm)49 because its profound effect on the enamel remineralization is well-established in the field.34,61,62 It could be possible that the application of the more efficient remineralizing agents such as higher concentrations of fluoride and metal compounds (, )63 would result in the detection of erosion inhibition by reflection analysis. 4.5.Effect of the Salivary Pellicle Layer on the Reflection Signal and Elimination of the Measurement ArtifactOnce it was found that the inhibition of enamel erosion by remineralization in human saliva did not take place, the contribution of the salivary pellicle layer to the high reflection intensities was considered in group 2. Salivary pellicle is a 30 to 100 nm64,65 thin layer, which is mostly composed of salivary (glyco)proteins, carbohydrates and lipids66,67 and possesses several functional properties such as lubrication of teeth,66,67 their shielding from direct contact with acid,67–70 and targeting the adhesion of oral bacteria.71,72 To check the effect of the pellicle layer on the measured reflection intensities, another group was introduced into the study design where the salivary pellicle was removed prior to the optical analysis (see group 3, Fig. 1). This group was introduced after the preliminary test experiments, therefore all four groups were studied in parallel during the main study course. In sound enamel, it has been shown that the complete removal of the pellicle layer was possible only by the combination of severe surface etching (0.6 M HCl) with ultrasonication.48 Other approaches, such as mechanical surface scraping73,74 or incubation in EDTA, and different salt solutions were inefficient for complete elimination of the pellicle film.48 For example, application of 3% NaOCl without ultrasonication resulted in the removal of the outer globular pellicle sublayer,48 though the basal layer resisted this treatment. It must be mentioned that the basal pellicle layer on the sound enamel is known to be highly resistant to chemo-mechanical challenges.48,75 Moreover, the present authors’ results from preliminary test experiments (not presented) showed a light etching effect of EDTA and sodium dodecyl sulfate on the sound enamel, therefore these chemicals could not be applied in the current study. In the case of eroded enamel, the complete removal of the pellicle layer might be an even more difficult task due to a higher total surface area and increased porosity of the etched tissue.76 Additionally, softened eroded enamel can be easily altered by mechanical forces or ultrasonication,77 therefore such treatments could not be considered. In general, there is a lack of information in the literature about the nondestructive elimination of the salivary pellicle from the eroded enamel surface. Meurman and Frank78 reported cleaning the eroded enamel surface from an in vitro formed pellicle layer by using a 10% NaOCl solution (20 h), but the efficiency of this method was not estimated. Moreover, it was shown that even a three-day exposure to 13% NaOCl did not affect the nanomechanical properties or the demineralization kinetics of enamel samples.39 On the other hand, 3% NaOCl is widely used in daily dental practice for disinfection and deactivation of prions, thus its clinical application requires no additional toxicological assessment. Moreover, 3% NaOCl solution is often applied for the cleaning of root canals. The present authors’ preliminary tests (unpublished data) revealed that the incubation of in vitro pellicle-coated enamel in 3% NaOCl solution for 30 s, 2 and 5 min resulted in the same efficiency of pellicle layer removal and provided no surface etching effect. Therefore, an aqueous NaOCl (3%; 30 s) was applied in group 3 for the removal of the salivary pellicle layer. The contribution of the soft protein layer to the reflection signal was detected. There were significantly lower intensity signals at 3 to 8 min of erosion () in the eroded enamel samples measured after the removal of the pellicle layer than in the samples where it remained during the reflection analysis [see groups 2, 3, Fig. 7(a), and Table 1). Since 3% aqueous NaOCl solution does not etch enamel tissue, higher reflection values in group 2 indicated smoothing of the enamel surfaces by the soft deposited salivary pellicle layer. This process is schematically presented in Fig. 8. Here, salivary proteins adhere to the eroded enamel surface and fill the etched tissue lesions, reducing the overall surface roughness. A similar process was observed by transmission electron microscopy of the pellicle layer on the eroded enamel.79 Furthermore, the optical measurements addressed the overall surface roughness, thus, the received signal corresponded to the roughness of the pellicle layer but not the actual eroded enamel tissue underneath, resulting in the measurement artifact. Fig. 8Smoothing effect of the salivary pellicle layer on the eroded enamel tissue: (a) original eroded enamel has a rough-etched interface; salivary proteins form a pellicle layer on the eroded enamel, filling the etched lesions (b); the resulting pellicle surface is analyzed by the reflectometer but not the eroded enamel tissue underneath (c), resulting in the measurement artifact.  Significantly higher reflection intensities () were measured in the enamel samples with the pellicle layer removed (group 3) than those treated in the mineral solution (group 4) at 7 to 8 min of erosion (groups , Table 1). It is possible that complete elimination of the pellicle artifact on the reflection signal was not achieved and that the basal pellicle remained on the etched surfaces at late erosion times (7 to 8 min). This suggestion is supported by the identical calcium release (, Table 3) in groups 3 and 4 at erosion times 7 to 8 min and is in agreement with previous observations.48 Nevertheless, the achieved results clearly showed a fast decrease of the specular reflection intensity in group 3 as a function of the applied erosion time [Fig. 7(a)]. The latter indicated that the pellicle artifact can be sufficiently minimized from the measurements and the proposed technique can be considered for the in vivo erosion diagnostics. Quick cleaning of the tooth surface by, for example, a cotton stick wetted in 3% NaOCl would be required prior to measurement. Obviously, the contribution of the pellicle layer to the increased reflection signal varied with different erosion times (Table 2). It seemed that a certain accumulation effect took place, where the amount of the adhered salivary proteins depended on the enamel roughness. In relation to this finding, it might be suggested that a reduced effect of the pellicle layer on the reflection signal could be expected in abraded eroded enamel tissue as abrasion decreased the roughness of the eroded enamel. 4.6.Clinical Relevance of the Study and Further ConsiderationsIt should be emphasized that the applied in vitro erosive conditions typically cause a higher degree of enamel wear and demineralization than conditions in the oral cavity.80 Most likely, a less prominent decrease in the reflection intensity could be expected in the in vivo application of the method. Moreover, polished enamel samples with flat interfaces were used in the present study, whereas native enamel surfaces with an aprismatic outer layer are known to be more resistant to demineralization81,82 and might result in decreased specular reflection intensity due to uneven interfaces. On the other hand, the native enamel is no longer present when the patient has dental erosion. The effect of enamel hydration and natural tooth color on the reflection intensity could be minimized by choosing the reference area in a close proximity to the region of interest. The presented study was an intermediate step from the in vitro method validation toward in vivo erosion diagnostics. The illumination of the erosive enamel tissue with visible light (400 to 800 nm) could be also explored for the visual erosion diagnosis. A similar approach was proposed for the detection of the white spot caries lesions83,84 where loss of the tooth mineral during demineralization causes higher light scattering from the affected areas. Because scattering is highly wavelength sensitive, shorter visible wavelengths of light could be of particular interest for the erosion illumination. However, it is not clear if the early erosion can be detected and quantified using visible illumination. Moreover, adequate software for the image analysis and quantification would be required to avoid subjective conclusions. 5.ConclusionsAbrasion of the eroded teeth resulted in the partial removal of the softened enamel tissue and an increase in the specular reflection intensity due to smoothing of the etched enamel surfaces. Nevertheless, an exponential change in the reflection signal with erosion progression was measured on the eroded and abraded samples, indicating that the proposed optical method can be further applied for the erosion assessment of the abraded flat surfaces in situ or even in vivo. Increasing the measurement angle (angles of reflection and incidence) from 45 to 60 deg caused an overall increase in the detected specular reflection signal but did not change the signal saturation at late erosion stages. The presence of the salivary pellicle layer on the enamel surface induced a measurement artifact, which increased with the increasing etching degree of the enamel. Removal of the salivary pellicle by rinsing the surface in 3% aqueous NaOCl is necessary prior to the reflection measurements. Furthermore, it remains unclear if the monitoring of the enamel remineralization in demineralization/remineralization cycles is possible with the proposed optical technique as the application of the mineral remineralizing solution did not result in the detection of the improved enamel resistance to erosion. AcknowledgmentsThe authors thank the Swiss Dental Association (SSO, project № 253-10) for financial support of the present research project. Stefanie Hayoz and Jasmin Windel (Institute of Mathematical Statistics and Actuarial Sciences, University of Bern, Switzerland) are acknowledged for the statistical data analysis. ReferencesB. Gregory-HeadD. Curtis,
“Erosion caused by gastroesophageal reflux: diagnostic considerations,”
J. Prosthodontics, 6
(4), 278
–285
(1997). http://dx.doi.org/10.1111/jopr.1997.6.issue-4 JPORCN 1059-941X Google Scholar
A. LussiT. Jaeggi,
“Chemical factors,”
Dental Erosion: From Diagnosis to Therapy, 77
–87 Karger AG, Basel
(2006). Google Scholar
J. FeatherstoneA. Lussi,
“Understanding the chemistry of dental erosion,”
Dental Erosion: From Diagnosis to Therapy, 66
–76 Karger AG, Basel
(2006). Google Scholar
J. VoronetsA. Lussi,
“Thickness of softened human enamel removed by toothbrush abrasion: an in vitro study,”
Clin. Oral Invest., 14
(3), 251
–256
(2010). http://dx.doi.org/10.1007/s00784-009-0288-y 1432-6981 Google Scholar
J. Voronetset al.,
“Controlled toothbrush abrasion of softened human enamel,”
Caries Res., 42
(4), 286
–290
(2008). http://dx.doi.org/10.1159/000148160 CAREBK 0008-6568 Google Scholar
C. GanssA. Lussi,
“Diagnosis of erosive tooth wear,”
Dental Erosion: From Diagnosis to Therapy, 32
–43 Karger AG, Basel
(2006). Google Scholar
A. Lussi,
“Erosive tooth wear—a multifactorial condition of growing concern and increasing knowledge,”
Dental Erosion: From Diagnosis to Therapy, 1
–8 Karger AG, Basel
(2006). Google Scholar
A. Mulicet al.,
“Reliability of two clinical scoring systems for dental erosive wear,”
Caries Res., 44
(3), 294
–299
(2010). http://dx.doi.org/10.1159/000314811 CAREBK 0008-6568 Google Scholar
T. JaeggiA. GrüningerA. Lussi,
“Restorative therapy of erosion,”
Dental Erosion: From Diagnosis to Therapy, 200
–214 Karger AG, Basel
(2006). Google Scholar
S. Thomaset al.,
“Investigation of in vitro dental erosion by optical techniques,”
Lasers Med. Sci., 23
(3), 319
–329
(2008). http://dx.doi.org/10.1007/s10103-007-0489-z LMSCEZ 1435-604X Google Scholar
J. Izattet al.,
“Optical coherence tomography for biodiagnostics,”
Opt. Photon. News, 8
(5), 41
–47
(1997). http://dx.doi.org/10.1364/OPN.8.5.000041 OPPHEL 1047-6938 Google Scholar
C. Wilder-Smithet al.,
“Quantification of dental erosion in patients with GERD using optical coherence tomography before and after double-blind, randomized treatment with esomeprazole or placebo,”
Am. J. Gastroenterol., 104
(11), 2788
–2795
(2009). http://dx.doi.org/10.1038/ajg.2009.441 AJGAAR 0002-9270 Google Scholar
E. Heurichet al.,
“Quantification of dental erosion—a comparison of stylus profilometry and confocal laser scanning microscopy (CLSM),”
Dent. Mater., 26
(4), 326
–336
(2010). DEMAEP Google Scholar
J. ArendsJ. T. Bosch,
“Demineralization and remineralization evaluation techniques,”
J. Dent. Res., 71 924
–928
(1992). JDREAF 0022-0345 Google Scholar
R. Shelliset al.,
“Methodology and models in erosion research: discussion and conclusions,”
Caries Res., 45
(Suppl. 1), 69
–77
(2011). http://dx.doi.org/10.1159/000325971 CAREBK 0008-6568 Google Scholar
A. KishenA. ShresthaA. Rafique,
“Fiber optic backscatter spectroscopic sensor to monitor enamel demineralization and remineralization in vitro,”
J. Conserv. Dent., 11
(2), 63
–70
(2008). http://dx.doi.org/10.4103/0972-0707.44053 JCDOD5 0972-0707 Google Scholar
E. Rakhmatullinaet al.,
“Application of the specular and diffuse reflection analysis for in vitro diagnostics of dental erosion: correlation with enamel softening, roughness, and calcium release,”
J. Biomed. Opt., 16
(10), 107002
(2011). http://dx.doi.org/10.1117/1.3631791 JBOPFO 1083-3668 Google Scholar
D. SpitzerJ. T. Bosch,
“The absorption and scattering of light in bovine and human dental enamel,”
Calcif. Tissue Res., 17
(2), 129
–137
(1975). http://dx.doi.org/10.1007/BF02547285 CATRBZ 0008-0594 Google Scholar
D. Friedet al.,
“Nature of light scattering in dental enamel and dentin at visible and near-infrared wavelengths,”
Appl. Opt., 34
(7), 1278
–1285
(1995). http://dx.doi.org/10.1364/AO.34.001278 APOPAI 0003-6935 Google Scholar
D. Friedet al.,
“The light-scattering properties of dentine and enamel at 543, 632, and 1053 nm,”
Proc. SPIE, 1880 240
–245
(1993). http://dx.doi.org/10.1117/12.148335 PSISDG 0277-786X Google Scholar
T. FarrellM. PattersonB. Wilson,
“A diffusion theory model of spatially resolved, steady-state diffuse reflectance for the noninvasive determination of tissue optical properties in vivo,”
Med. Phys., 19
(4), 879
–888
(1992). http://dx.doi.org/10.1118/1.596777 MPHYA6 0094-2405 Google Scholar
J. Schmittet al.,
“Multilayer model of photon diffusion in skin,”
J. Opt. Soc. Am. A, 7
(11), 2141
–2153
(1990). http://dx.doi.org/10.1364/JOSAA.7.002141 JOAOD6 0740-3232 Google Scholar
J. Embrechts,
“Light scattering by rough surfaces: electromagnetic model for lighting simulations,”
Lighting Res. Tech., 24
(4), 243
–254
(1992). http://dx.doi.org/10.1177/096032719202400408 LRTEA9 0024-3426 Google Scholar
L. DwightJ. SunX. Sun,
“Fractal surface scattering: a generalized Rayleigh solution,”
J. Appl. Phys., 68
(11), 5456
–5462
(1990). http://dx.doi.org/10.1063/1.347002 JAPIAU 0021-8979 Google Scholar
D. Zeroet al.,
“Comparison of the iodide permeability test, the surface microhardness test, and mineral dissolution of bovine enamel following acid challenge,”
Caries Res., 24
(3), 181
–188
(1990). http://dx.doi.org/10.1159/000261263 CAREBK 0008-6568 Google Scholar
A. Magalhaeset al.,
“The erosive potential of 1% citric acid supplemented by different minerals: an in vitro study,”
Oral Health Prev. Dent., 8
(1), 41
–45
(2010). Google Scholar
N. WestJ. HughesM. Addy,
“Erosion of dentine and enamel in vitro by dietary acids: the effect of temperature, acid character, concentration and exposure time,”
J. Oral Rehabil., 27
(10), 875
–880
(2000). http://dx.doi.org/10.1111/j.1365-2842.2000.00583.x JORHBY Google Scholar
R. Karlinseyet al.,
“In vitro evaluation of eroded enamel treated with fluoride and a prospective tricalcium phosphate agent,”
J. Dent. Oral Hyg., 1
(4), 052
–058
(2009). JDOHCB Google Scholar
E. BrunnerS. DomhofF. Langer, Nonparametric analysis of longitudinal data in factorial experiments, Wiley, New York
(2002). Google Scholar
Y. NekrashevychL. Stösser,
“Protective influence of experimentally formed salivary pellicle on enamel erosion,”
Caries Res., 37
(3), 225
–231
(2003). http://dx.doi.org/10.1159/000070449 CAREBK 0008-6568 Google Scholar
A. WiegandL. KöwingT. Attin,
“Impact of brushing force on abrasion of acid-softened and sound enamel,”
Arch. Oral Biol., 52
(11), 1043
–1047
(2007). http://dx.doi.org/10.1016/j.archoralbio.2007.06.004 AOBIAR 0003-9969 Google Scholar
A. Wiegandet al.,
“Impact of toothpaste slurry abrasivity and toothbrush filament stiffness on abrasion of eroded enamel—an in vitro study,”
Acta Odontol. Scand., 66
(4), 231
–235
(2008). http://dx.doi.org/10.1080/00016350802195041 AOSCAQ 0001-6357 Google Scholar
M. HunterN. West,
“Mechanical tooth wear: the role of individual toothbrushing variables and toothpaste abrasivity,”
Tooth Wear and Sensitivity: Clinical Advances in Restorative Dentistry, 161
–169 Martin Dunitz, London
(2000). Google Scholar
A. LussiE. Hellwig,
“Risk assessment and preventive measures,”
Dental Erosion: From Diagnosis to Therapy, 190
–199 Karger AG, Basel
(2006). Google Scholar
T. Imfeld,
“Prevention of progression of dental erosion by professional and individual prophylactic measures,”
Eur. J. Oral Sci., 104
(2(pt 2)), 215
–220
(1996). http://dx.doi.org/10.1111/eos.1996.104.issue-2 EJOSFY 0909-8836 Google Scholar
C. Gansset al.,
“Effects of toothbrushing force on the mineral content and demineralized organic matrix of eroded dentine,”
Eur. J. Oral Sci., 117
(3), 255
–260
(2009). http://dx.doi.org/10.1111/eos.2009.117.issue-3 EJOSFY 0909-8836 Google Scholar
G. v. d. Weijdenet al.,
“Toothbrushing force in relation to plaque removal,”
J. Clin. Periodontol., 23
(8), 724
–729
(1996). http://dx.doi.org/10.1111/cpe.1996.23.issue-8 JCPEDZ 0303-6979 Google Scholar
A. Vieiraet al.,
“Toothbrush abrasion, simulated tongue friction and attrition of eroded bovine enamel in vitro,”
J. Dent., 34
(5), 336
–342
(2006). http://dx.doi.org/10.1016/j.jdent.2005.07.010 JDENAB 0300-5712 Google Scholar
F. LippertD. ParkerK. Jandt,
“Toothbrush abrasion of surface softened enamel studied with tapping mode AFM and AFM nanoindentation,”
Caries Res., 38
(5), 464
–472
(2004). http://dx.doi.org/10.1159/000079628 CAREBK 0008-6568 Google Scholar
A. d. Azevedoet al.,
“Assessment in vitro of brushing on dental surface roughness alteration by laser interferometry,”
Braz. Oral Res., 22
(1), 11
–17
(2008). http://dx.doi.org/10.1590/S1806-83242008000100003 1806-8324 Google Scholar
B. LawnJ. -W. LeeH. Chai,
“Teeth: among nature’s most durable biocomposites,”
Annu. Rev. Mater. Res., 40 55
–75
(2010). http://dx.doi.org/10.1146/annurev-matsci-070909-104537 ARMRCU 1531-7331 Google Scholar
A. MannM. Dickinson,
“Nanomechanics, chemistry and structure at the enamel surface,”
The teeth and Their Environment, 105
–131 Karger AG, Basel
(2006). Google Scholar
Z.-J. Chenget al.,
“The enamel softening and loss during early erosion studied by AFM, SEM and nanoindentations,”
Biomed. Mater., 4
(1), 015020
(2009). http://dx.doi.org/10.1088/1748-6041/4/1/015020 BMATEM Google Scholar
C. Pratiet al.,
“Resistance of marginal enamel to acid solubility is influenced by restorative systems: an in vitro scanning electron microscopic study,”
Clin. Oral Invest., 7
(2), 86
–91
(2003). http://dx.doi.org/10.1007/s00784-003-0207-6 1432-6981 Google Scholar
“Further modification of soft drinks to minimise erosion. A study in situ,”
Caries Res., 36
(1), 70
–74
(2002). http://dx.doi.org/10.1159/000057594 CAREBK 0008-6568 Google Scholar
A. Lussiet al.,
“Dental erosion—an overview with emphasis on chemical and histopathological aspects,”
Caries Res., 45
(Suppl. 1), 2
–12
(2011). http://dx.doi.org/10.1159/000325915 CAREBK 0008-6568 Google Scholar
M. LarsenE. Pearce,
“Saturation of human saliva with respect to calcium salts,”
Arch. Oral Biol., 48
(4), 317
–322
(2003). http://dx.doi.org/10.1016/S0003-9969(03)00007-4 AOBIAR 0003-9969 Google Scholar
M. Hanniget al.,
“Transmission electron microscopy comparison of methods for collecting in situ formed enamel pellicle,”
Clin. Oral Invest., 9
(1), 30
–37
(2005). http://dx.doi.org/10.1007/s00784-004-0284-1 1432-6981 Google Scholar
B. AmaechiS. Higham,
“In vitro remineralisation of eroded enamel lesions by saliva,”
J. Dent., 29
(5), 371
–376
(2001). http://dx.doi.org/10.1016/S0300-5712(01)00026-4 JDENAB 0300-5712 Google Scholar
T. KoulouridesF. FeaginW. Pigman,
“Remineralization of dental enamel by saliva in vitro,”
Ann. N. Y. Acad. Sci., 131
(2), 751
–757
(1965). http://dx.doi.org/10.1111/nyas.1965.131.issue-2 ANYAA9 0077-8923 Google Scholar
M. Eisenburgeret al.,
“Effect of time on the remineralisation of enamel by synthetic saliva after citric acid erosion,”
Caries Res., 35
(3), 211
–215
(2001). http://dx.doi.org/10.1159/000047458 CAREBK 0008-6568 Google Scholar
A. Haraet al.,
“The effect of human saliva substitutes in an erosion–abrasion cycling model,”
Eur. J. Oral. Sci., 116
(6), 552
–556
(2008). http://dx.doi.org/10.1111/eos.2008.116.issue-6 EJOSFY 0909-8836 Google Scholar
T. Gelhardet al.,
“Remineralization of softened human enamel in mucin- or CMC-containing artificial salivas,”
J. Oral Pathol. Med., 12
(5), 336
–341
(1983). http://dx.doi.org/10.1111/jop.1983.12.issue-5 JPMEEA 0904-2512 Google Scholar
A. PreethaR. Banerjee,
“Comparison of artificial saliva substitutes,”
Trends Biomater. Artif. Organs, 18
(2), 178
–186
(2005). Google Scholar
J. Kirkhamet al.,
“Self-assembling peptide scaffolds promote enamel remineralization,”
J. Dent. Res., 86
(5), 426
–430
(2007). http://dx.doi.org/10.1177/154405910708600507 JDREAF 0022-0345 Google Scholar
K. Collyset al.,
“Acid-etched enamel surfaces after 24 h exposure to calcifying media in vitro and in vivo,”
J. Dent., 19
(4), 230
–235
(1991). http://dx.doi.org/10.1016/0300-5712(91)90124-H JDENAB 0300-5712 Google Scholar
K. Collyset al.,
“Rehardening of surface softened and surface etched enamel in vitro and by intraoral exposure,”
Caries Res., 27
(1), 15
–20
(1993). http://dx.doi.org/10.1159/000261509 CAREBK 0008-6568 Google Scholar
R. GarberoglioG. Cozzani,
“In vivo effect of oral environment on etched enamel: a scanning electron microscopic study,”
J. Dent. Res., 58
(9), 1859
–1865
(1979). http://dx.doi.org/10.1177/00220345790580090301 JDREAF 0022-0345 Google Scholar
F. Ashleyet al.,
“Relationship between calcium and inorganic phosphorus concentrations of both resting and stimulated saliva and dental plaque in children and young adults,”
Arch. Oral Biol., 36
(6), 431
–434
(1991). http://dx.doi.org/10.1016/0003-9969(91)90133-F AOBIAR 0003-9969 Google Scholar
R. Karlinseyet al.,
“Bioactivity of novel self-assembled crystalline microstructures in simulated and human salivas,”
Biomed. Mater., 1
(1), 16
–23
(2006). http://dx.doi.org/10.1088/1748-6041/1/1/003 BMATEM Google Scholar
C. Hjortsjoet al.,
“Effect of acidic fluoride treatments on early enamel erosion lesions-A comparison of calcium and profilometric analyses,”
Arch. Oral Biol., 55
(3), 229
–234
(2010). http://dx.doi.org/10.1016/j.archoralbio.2010.01.003 AOBIAR 0003-9969 Google Scholar
A. Haraet al.,
“Influence of fluoride availability of dentifrices on eroded enamel remineralization in situ,”
Caries Res., 43
(1), 57
–63
(2009). http://dx.doi.org/10.1159/000201591 CAREBK 0008-6568 Google Scholar
L. Hoveet al.,
“The erosion-inhibiting effect of TiF4, SnF2, and NaF solutions on pellicle-covered enamel in vitro,”
Acta Odontol. Scandinavica, 65
(5), 259
–264
(2007). http://dx.doi.org/10.1080/00016350701477581 AOSCAQ 0001-6357 Google Scholar
M. HannigK. Bossmann,
“Pellicular dentis (I). Ultrastrukturelle Vielfalt als Ausdruck komplexer Bildung und Reifung,”
Quintessenz, 40
(7), 1319
–1327
(1989). QUINDQ Google Scholar
N. TinanoffP. GlickD. Weber,
“Ultrastructure of organic films on the enamel surface,”
Caries Res., 10
(1), 19
–32
(1976). http://dx.doi.org/10.1159/000260186 CAREBK 0008-6568 Google Scholar
U. LendenmannJ. GroganF. Oppenheim,
“Saliva and dental pellicle-a review,”
Adv. Dent. Res., 14
(1), 22
–28
(2000). http://dx.doi.org/10.1177/08959374000140010301 0895-9374 Google Scholar
M. Hannig,
“The protective nature of the salivary pellicle,”
Int. Dent. J., 52
(Suppl. 2), 417
–423
(2002). http://dx.doi.org/10.1111/idj.2002.52.issue-S5 IDJOAS 0020-6539 Google Scholar
B. Amaechiet al.,
“Thickness of acquired salivary pellicle as a determinant of the sites of dental erosion,”
J. Dent. Res., 78
(12), 1821
–1828
(1999). http://dx.doi.org/10.1177/00220345990780120901 JDREAF 0022-0345 Google Scholar
J. MeurmanR. Frank,
“Scanning electron microscopic study of the effect of salivary pellicle on enamel erosion,”
Caries Res., 25
(1), 1
–6
(1991). http://dx.doi.org/10.1159/000261335 CAREBK 0008-6568 Google Scholar
A. Wiegandet al.,
“Impact of the in situ formed salivary pellicle on enamel and dentine erosion induced by different acids,”
Acta Odontol. Scandinavica, 66
(4), 225
–230
(2008). http://dx.doi.org/10.1080/00016350802183401 AOSCAQ 0001-6357 Google Scholar
K. SchillingW. Bowen,
“Glucans synthesized in situ in experimental salivary pellicle function as specific binding sites for Streptococcus mutans,”
Infect. Immun., 60
(1), 284
–295
(1992). INFIBR 1070-6313 Google Scholar
W. ClarkL. BammannR. Gibbons,
“Comparative estimates of bacterial affinities and adsorption sites on hydroxyapatite surfaces,”
Infect. Immun., 19
(3), 846
–853
(1978). INFIBR 1070-6313 Google Scholar
T. SönjuG. Rölla,
“Chemical analysis of the acquired pellicle formed in two hours on cleaned human teeth in vivo. Rate of formation and amino acid analysis,”
Caries Res., 7
(1), 30
–38
(1973). http://dx.doi.org/10.1159/000259822 CAREBK 0008-6568 Google Scholar
A. S. Clasenet al.,
“Analytical and ultrastructural studies of pellicle on primary teeth,”
Acta Odontol. Scand., 55
(6), 339
–343
(1997). AOSCAQ 0001-6357 Google Scholar
H. BusscherM. CowanH. V. D. Mei,
“On the relative importance of specific and non-specific approaches to oral microbial adhesion,”
FEMS Microbiol. Rev., 88
(3–4), 199
–209
(1992). http://dx.doi.org/10.1111/fml.1992.88.issue-3-4 FMREE4 0168-6445 Google Scholar
T. NguyenA. MillerM. Orellana,
“Characterization of the porosity of human dental enamel and shear bond strength in vitro after variable etch times: initial findings using the BET method,”
Angle Orthod., 81
(4), 707
–715
(2011). ANORAA Google Scholar
M. Eisenburgeret al.,
“Ultrasonication as a method to study enamel demineralisation during acid erosion,”
Caries Res., 34
(4), 289
–294
(2000). http://dx.doi.org/10.1159/000016604 CAREBK 0008-6568 Google Scholar
J. MeurmanR. Frank,
“Scanning electron microscopic study of the effect of salivary pellicle on enamel erosion,”
Caries Res., 25
(1), 1
–6
(1991). http://dx.doi.org/10.1159/000261335 CAREBK 0008-6568 Google Scholar
C. Hanniget al.,
“The effect of acidic beverages on the ultrastructure of the acquired pellicle-an in situ study,”
Arch. Oral Biol., 54
(6), 518
–526
(2009). http://dx.doi.org/10.1016/j.archoralbio.2009.02.009 AOBIAR 0003-9969 Google Scholar
A. Hallet al.,
“The effect of saliva on enamel and dentine erosion,”
J. Dent., 27
(5), 333
–339
(1999). http://dx.doi.org/10.1016/S0300-5712(98)00067-0 JDENAB 0300-5712 Google Scholar
M. FinkeK. JandtD. Parker,
“The early stages of native enamel dissolution studied with atomic force microscopy,”
J. Colloid Interfac. Sci., 232
(1), 156
–164
(2000). http://dx.doi.org/10.1006/jcis.2000.7200 JCISA5 0021-9797 Google Scholar
C. GanssJ. KlimekN. Schwarz,
“A comparative profilometric in vitro study of the susceptibility of polished and natural human enamel and dentine surfaces to erosive demineralization,”
Arch. Oral Biol., 45
(10), 897
–902
(2000). http://dx.doi.org/10.1016/S0003-9969(00)00041-8 AOBIAR 0003-9969 Google Scholar
L. Karlsson,
“Caries detection methods based on changes in optical properties between healthy and carious tissue,”
Int. J. Dent., 2010 1
–9
(2010). http://dx.doi.org/10.1155/2010/270729 IJDNB4 1687-8736 Google Scholar
I. Pretty,
“Caries detection and diagnosis: novel technologies,”
J. Dent., 34
(10), 727
–739
(2006). http://dx.doi.org/10.1016/j.jdent.2006.06.001 JDENAB 0300-5712 Google Scholar
|
||||||||||||||||||||||||||||||||||||||||||||||||||||||||||||||||||||||||||||||||||||||||||||||||||||||||||||||||||||||||||||||||||||||||||||||||||||||||||||||