
|
|
1.IntroductionIdentifying early demineralization under resin composite restorations (secondary caries) remains one of the primary diagnostic challenges in dentistry. Extensive restorative procedures or tooth loss are sometimes sequelae of undetected secondary caries. Improving caries detection has the potential to produce superior patient outcomes and lead to a more complete understanding, with the use of concurrent bacterial sampling, of the biofilm-mediated etiology. In addition, improvements in secondary caries detection may aid in studying new early treatments for secondary caries. Conventional methods, such as x-rays and tactile probes, have limitations in assessing early failure and safely monitoring a suboptimal marginal interface. In addition to having broad applications in biology, medicine, and dentistry.1–5 Optical Coherence Tomography (OCT) has shown specific promise in examining composite restorations.6–13 Compared to other dental caries detection systems that aggregate the surface and subsurface into a single measurement at a specific site (e.g., DIAGNOdent, Kavo), OCT can independently measure both the restoration surface margin and the underlying subsurface interface. The advancement of Fourier Domain acquisition methods, such as Swept Source OCT, in which the depth-resolved signal is extracted by measuring the interference spectrum of the tissue signal, has made the clinical application of OCT more feasible.14 Swept Source OCT has increased acquisition speed, providing near real-time video rate imaging, while improving the overall signal to noise ratio of the acquired images. Combining Swept Source OCT with a cross-polarization design (CP-OCT) offers several additional advantages. In cross-polarization-optical coherence tomography (CP-OCT), the output beam is linearly polarized and the system design isolates the returning perpendicular axis signal, thus reducing the overall specular reflection when imaging the high refractive index enamel15 and enhancing image contrast between dental enamel and resin composite material.13 OCT imaging of dental resin composites has been shown to be strongly influenced by the refractive index differences between the resin and the reinforcement material (filler)16,17; however, the effect of nanoparticles within the resin matrix and the influence of colorants need to be further examined. This will be important in determining both the optimal resin composition and shade selection for diagnostic OCT imaging. A detailed review of the basic formulation of dental composites can be found elsewhere.18 In terms of colorants, dental shades have shown lower visible light translucency from A through D shades19 in two composite systems, and one possible explanation is the attenuation from the increasing iron oxide contents placed in A thru D shades.20 For near-infrared (NIR) wavelengths (1 to 1.5 μm), there is limited work studying the effect of colorants in dental resin composites on translucency; however, there is evidence that some forms of industrial iron oxides have strong absorption near 1.1 μm. In contrast, some other types of iron oxides have low absorption in the near infrared region.21–23 Although proprietary combinations of iron oxide colorants in dental resin composites account for less than 1% of the material weight,24 other industrial applications of iron oxides added to industrial glasses at concentrations near 0.1% to 0.5% significantly (up to 70%) attenuate NIR light transmission due to absorption.21 The spectral features of ferrous ion absorption can change for different chemical compositions because the octahedral ferrous ion site can be distorted by different bond conformations.25 This gives rise to a multitude of allowable electron spin transitions for the ferrous ion that affects the overall absorption spectrum. For 1310-nm NIR CP-OCT imaging through dental composites, it is important to understand how the incident and returning optical signal is attenuated. Molecular components such as iron oxides have the potential to attenuate the signal, thereby reducing the CP-OCT imaging depth, by absorption. In addition, larger sized filler particles in a resin composite can significantly attenuate the NIR signal through scattering. This scattering is dependent on the refractive index differences between the filler and the resin matrix. The scattering is also dependent on the size and shapes of the filler particles. In assessing the attenuation of resin composites, a reproducible secondary caries model is needed to assess the optimal resin composition for diagnostic CP-OCT imaging. It is important to consider that current dental composites are formulated to optimize x-ray-based diagnostic imaging, which results in the addition of certain high atomic weight elements into the glass filler. A more complete understanding of CP-OCT imaging of composites may lead to a similar modification to augment NIR light transmission. The purpose of this study was to investigate the influence of material composition on 1310-nm CP-OCT imaging of dental resins. This was accomplished by studying whether proprietary iron oxide colorants from various manufacturers affected OCT signal penetration. The principal aim of this study was to develop a highly reproducible model to test CP-OCT signal attenuation for various composite materials. In addition, this paper examines the effect of resin matrix and filler composition on CP-OCT signal attenuation. 2.Materials and Methods2.1.Cross-Polarization Optical Coherence TomographyA customized cross-polarization swept source OCT (CP-OCT) system with an intraoral probe (Fig. 1) was used (IVS-200-CPM, Santec Co. Komaki, Japan) for in vitro dental materials imaging. The swept source system utilized a high sweep rate (30 kHz) continuous wavelength scanning laser centered near 1310 nm with a bandwidth of 104 nm. Interferometric concepts of swept source OCT imaging are described elsewhere.26 The interferometer component of the system was housed in the intraoral probe body. The output beam from the swept source traveled in a single mode fiber and then was split into a sample and a reference arm. In the sample arm, the output signal traveled through a collimator system and then a polarizing beam splitter. The output wave was linearly polarized in the P-polarization state. Light then traveled through a fixed focusing lens () and was reflected onto a two-axis tilt micro-electro-mechanical system (MEMS) scanning mirror in the body of the probe. The beam reflected at the probe end to illuminate () various dental resin composites. The backscattered signal from the material sample traveled back through the probe and the polarizing beam splitter. At this point, the S-polarization state (cross-polarization of the incident beam) was diverted to recombine with the reference signal. Fig. 1Cross-Polarization OCT. Housed in the probe casing was a Mach-Zehnder type interferometer that used a polarization beam splitter (PBS) to illuminate a two-axis tilt MEMS scanning mirror with linearly polarized light (P). Light from a swept source 1310-nm near infrared laser (HSL) was coupled into single mode fiber and then was split into a reference and sample arm. Polarization controllers (PC) were used to produce an optimum interference pattern. In the sample arm, a PBS isolated the cross polarization state (S) in the backscattered light. A collimator system (C) was used between the fiber and free space paths. The interference signal was measured by two balanced detectors, digitized, and processed for reconstruction of the spatial information.  This customized CP-OCT system was measured to have a 31.4-dB polarization suppression indicating that over 99.9% of reflected light in the parallel axis did not recombine with the reference signal.14 Hence the CP-OCT system reduced the specular reflection, which would be measured by conventional swept source OCT, by 99.9%. The cross-polarization sample arm signal recombined with the signal from the reference arm and was measured by balanced detection. The resulting interference pattern signal was recorded in time but can also be plotted in -space (wavenumber) due to the time-encoded wavenumber scanning of the output laser. The Fourier transform of this wavenumber spectrum produced the spatial information along the axial direction of the sample. The free space axial resolution for the source was experimentally measured to be 11 μm when a single reflective peak was measured at the level. The system had a fixed low numerical aperture lens with a Rayleigh range (depth of focus) over 4 mm. The tradeoff was an 80-μm lateral resolution () that was confirmed using a digital caliper. 2.2.Dental Resin Composite ImagingA total of 108 composite discs were analyzed with CP-OCT imaging. This study selected resin composite materials based on distinct filler composition and size, where the influence of submicron and nanoparticle fillers was examined (Table 1). Four dental composite systems were examined: Filtek Supreme Ultra (FSU) (3M ESPE), IPS Empress Direct (EMD) (Ivoclar Vivadent), Estelite Sigma Quick (SQK) (Tokuyama Dental) and Z100 (3M ESPE). Six composite discs () were prepared for each shade type (Table 1) to an average thickness of near 2.5 mm. These discs were cured for 30 s with a halogen light source (QHL75, Dentsply) between glass slides to minimize oxygen inhibition to polymerization and no further polishing was performed prior to CP-OCT imaging. Hydroxyapatite discs (HA) (Clarkson Chromatography) were placed under the composite discs as shown in Fig. 2. The HA had a similar chemical composition as dental tooth enamel. Despite a similarity in chemical composition, the HA did not have the organized crystal arrangement of dental enamel. The HA were sintered and thus produced from a compressed powder. The random arrangement of compressed powder caused the HA to highly scatter and depolarize the incident light similar to demineralized enamel. Using 1310-nm NIR light of CP-OCT, cross-sectional images of different composite-HA complexes were obtained (Fig. 2). Images were analyzed by a customized program (written in Matlab™, Mathworks) to calculate the integrated reflectivity (deltaR) of the HA alone and underneath the composite disc (Fig. 2). The mean reflectivity of the composite material and background within a sample region was also calculated. The mean intensity of the backscattered signal in the background (air) section allowed measuring the dB offset. The numbers reported in this study are adjusted to the dB offset where the background (air) signal was set at a zero value. Raw CP-OCT images were processed by a median filter to reduce the speckle noise inherent in all OCT imaging. The parameter deltaR was calculated by integrating the reflectivity over an entire rectangular section () (Fig. 2) of the HA and then divided by the lateral dimension. In this study, the deltaR parameter represented the average integrated line profile of the HA reflectivity at the fixed optical depth of 500 μm. DeltaR has been shown to be a means of assessing enamel demineralization.27 To further refine the measurement of assessing the effectiveness in detecting underlying scattering signal beneath a composite material, the parameter was created for this study. is merely the deltaR of the HA under the composite () divided by deltaR of the HA alone (): Fig. 2Experimental Setup: (a) The CP-OCT system probe, with the clinical infection control polyvinyl sheath, scans the composite disc placed over the HA disc; (b) CP-OCT image of the HA-Composite placed at a fixed distance to the probe (double arrow). The total integrated reflectivity (deltaR-average line profile) was calculated for the HA alone (box #1) and the HA under the composite material (box #2). The mean reflectivity of the composite material (box #3), and background “air space” (box #4) within a sample region was determined. CP-OCT images are presented in a logarithmic false color scale. Each box is 0.5-mm optical depth in the y-axis, and 0.5-mm lateral distance in the x-axis. 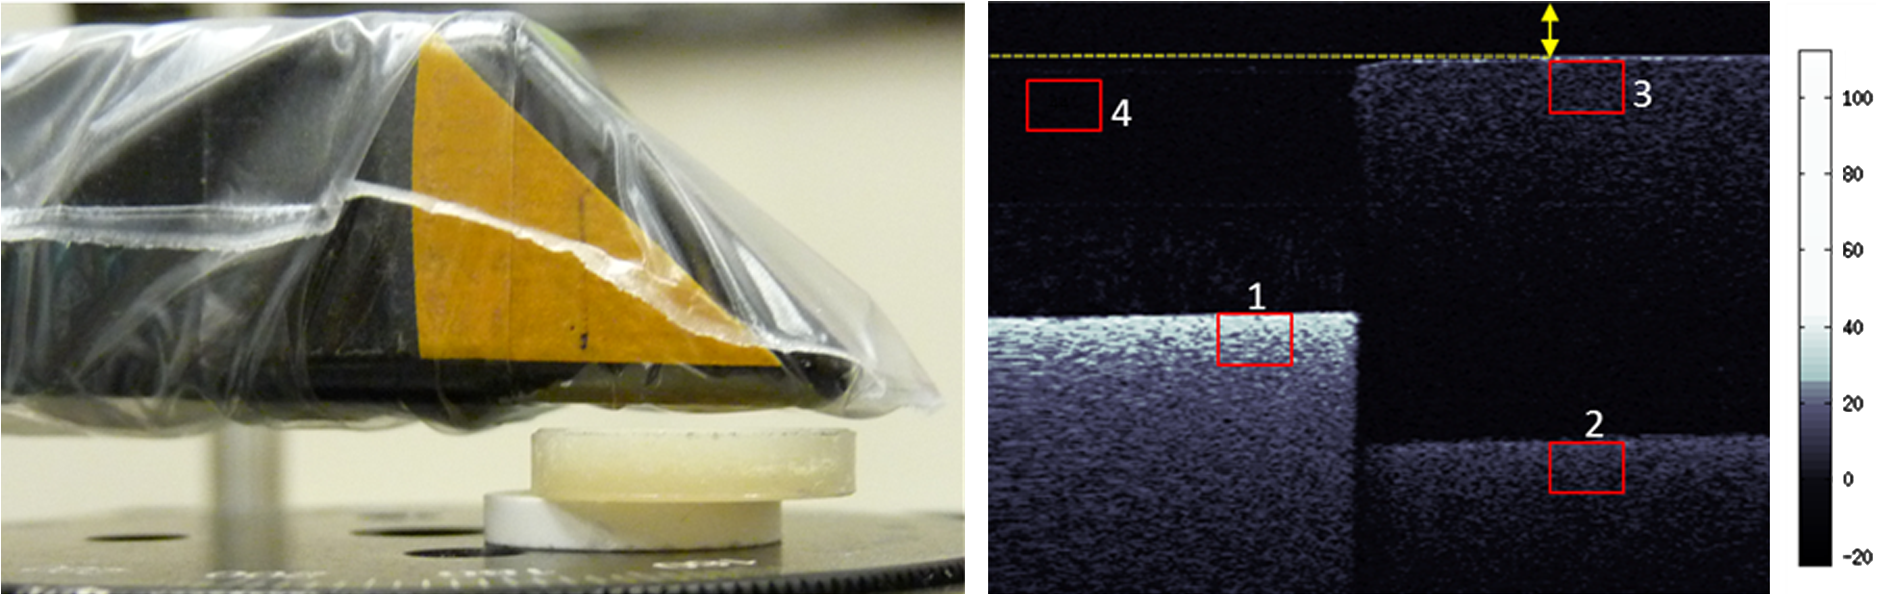 Table 1Referenced Manufacturer’s Scientific and MSDS Data. The mean disc thickness measurements with standard deviation (SD) for each composite material.
A value of approaching 100% indicates that the HA signal measured below the composite material is near equal to the scattering of HA alone. This means the material is quite transparent to the NIR CP-OCT signal with minimal scattering and absorption. A low value of indicates that the material significantly attenuates the NIR CP-OCT signal. Statistical analysis was performed to compare shade groups within each composite material and select shades between materials using SAS (v9.1.3, SAS Institute Inc.) and Primer of Biostatistics (version 7, S. Glantz, McGraw-Hill). 2.3.Scanning Electron Microscopy and Energy-Dispersive X-Ray SpectrometerScanning electron microscopy (SEM) and energy-dispersive x-ray spectrometer (EDS) were used to examine the effect of filler morphology and composition on CP-OCT imaging of the resin-based dental composites. Several composite discs were selected and polished with sandpaper sheets (SiC, P240, P600, P1200), followed by fine polishing with alumina suspensions (1- and 0.05-μm, respectively) in order to remove the resin rich layer that can confound elemental analysis. Then the specimens were ultrasonicated in distilled water for 5 min and air-dried. The polished discs mounted on aluminum stubs were examined by an EDS (Quantax 70, Bruker, Germany), which was attached to the SEM (TM3000, Hitachi, Japan) to verify the chemical composition of the restorative composites. The accelerating voltage was 15 kV, and, in order to avoid the influence on composition analysis, conductive coatings on polished discs were not applied. High-resolution images of these composites were then taken using a Field Emission SEM (Joel 6500, Japan) at an accelerating voltage of 5 kV and a working distance of 10 mm. For SEM, the polished specimens were sputter-coated with 5 nm of platinum to improve the resolution and mounted on aluminum stubs with carbon tape. 2.4.Transmission Electron MicroscopyExamination of the particle sizes and their distribution in the resin composite systems was conducted by a Field emission gun transmission electron microscopy (TEM) (Tecnai G2 F30, FEI, USA). Specimens were prepared by cutting the composite discs to cylinders with a rotary diamond saw and then cut with a 45-deg diamond knife (ultramicrotome, Leica EM UC6, Japan). Thin slices (100 nm) were collected on 200-mesh copper grids and examined under TEM. Particle sizes were analyzed using Image J (version 1.44p, NIH, USA). To obtain the average particle diameters in the specimens, three TEM images were randomly captured with magnification of 13500 for each specimen and at least 200 different particles were measured from each image. 3.ResultsThe experimental setup allowed the HA disc to be scanned with and without the overlaying composite disc in the same acquired CP-OCT image (Fig. 2). The CP-OCT image of the HA disc [Fig. 2(b), box #1] alone showed the high scattering and depolarization of the incident beam. The deltaR of HA was consistent for all 108 measurements: . The CP-OCT image of the HA disc below the composite material [Fig. 2(b), box #2] shows that the intensity of the HA scattering was attenuated. As the CP-OCT probe illuminated the sample, the NIR incident beam first traveled through air, across the air-composite interface, and initially through the composite material alone. The composite attenuated this incident beam. The incident beam then crossed the composite-HA interface. The HA highly scattered and depolarized the NIR beam, and the backscattered optical signal traveled back through the composite material and returned to the probe. The composite attenuated this returning signal. quantified the CP-OCT signal attenuation by dividing the deltaR of the HA under the composite material () by the deltaR of the HA without composite (). In Fig. 3, photos of the composite discs of FSU, shades A2 to D2 and translucent, are shown above corresponding CP-OCT images. The presented FSU CP-OCT images were cropped versions of the full CP-OCT image format acquired that is seen Fig. 2. CP-OCT images in Fig. 3 focused on just the composite disc over the HA. The scattering of the HA was clearly visible under the translucent FSU shade (Fig. 3, arrow marker). The HA scattering was less visible under the enamel FSU shades. For these CP-OCT images, the HA alone was cropped for manuscript presentation, but the values of the deltaR for HA alone in each sample were calculated and compared to the deltaR of the HA under composite. Comparing versus FSU shade (Fig. 3) confirmed that the scattering of the HA under the translucent shade composite was measured to be 87% the intensity of the scattering of HA without the overlaying composite. This showed the high transparency of this translucent shade to the NIR CP-OCT signal. The enamel FSU shades showed that the HA signal under composite was near 20% the intensity of the scattering of the HA alone. The enamel FSU shades showed much greater attenuation in the NIR than the translucent shade (ANOVA, Tukey ). No statistical significance in was found between the enamel shades. Fig. 3Photos and CP-OCT images of Filtek Supreme Ultra (FSU) composite discs with enamel shades and translucent shade (Top). In the CP-OCT image of the translucent shade, the scattering of the underlying HA disc is clearly identified (arrow). The HA disc scattering was measured to be weaker when imaging through the enamel shades, which indicated the higher attenuation of the enamel shade material than the translucent shades. quantifies the signal attenuation of the incident beam and the underlying HA disc backscattering (Bottom). Materials with different letters have significantly different values (ANOVA, Tukey ). Shades with the same letter are not statistically significantly different at . Samples size () for all materials. Error bars represent standard deviation. 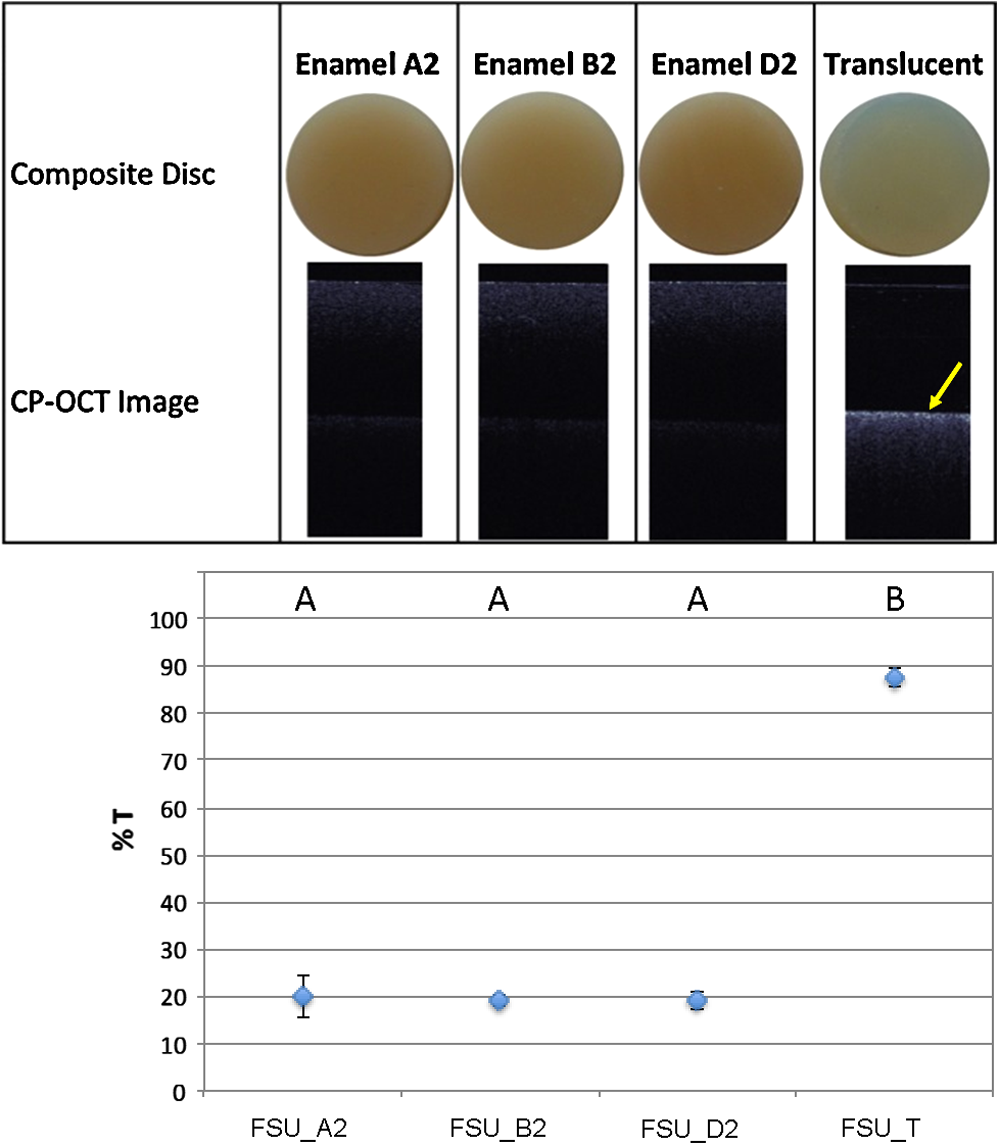 For the SQK composite material, the underlying HA scattering under the material was harder to visualize with CP-OCT (Fig. 4). In this different composite system, the visibly opaque shade (OA2) strongly attenuated the NIR signal slightly greater than all other shades. The HA disc scattering were barely visible in A2 to C2 enamel shades. Even for the clear shade (CE), the HA disc scattering under the composite was difficult to visualize and the value was near 10%. Fig. 4Photos and CP-OCT images of Estelite Sigma Quick (SQK) composite discs with enamel shades, translucent shade (CE), and opaque shade (OA2) (Top) values show that all the material shades tested highly attenuate the near infrared CP-OCT signal (Bottom). Materials with different letters have significantly different values (ANOVA, Tukey ). Shades with the same letter are not statistically significantly different at . Samples size () for all materials. Error bars represent standard deviation.  For the EMD composite material, the CP-OCT images of the enamel shades detected the HA disc scattering but calculations showed values of 39% to 45% the signal intensity of HA alone (Fig. 5). The revealed that there were slight variations between the A to D shade types (ANOVA, Tukey, ). The HA scattering was more clearly detected in the CP-OCT images of the translucent shade versus the enamel shades. was higher for the translucent EMD shade than the enamel shades (ANOVA, Tukey, ). Fig. 5Photos and CP-OCT images of IPS Empress Direct (EMD) composite discs with enamel shades and translucent shade (T30) (Top); values quantified the ability to visualize the HA scattering in the CP-OCT images (Bottom). Materials with different letters have significantly different values (ANOVA, Tukey ). Shades with the same letter are not statistically significantly different at . Samples size () for all materials. Error bars represent standard deviation.  CP-OCT images of Z100 (Fig. 6) indicate that the HA scattering was weakly apparent under the composite samples. When comparing , the enamel shades were not found to be distinctly different (, ANOVA). The pedo shade, which is more visually opaque, was found to be marginally different than the A2 and C2 shade (ANOVA, Tukey, ). Fig. 6Photos and CP-OCT images of hybrid filled Z100 (3M) composite discs with enamel shades and a more visibly opaque pedo shade (Top); values were calculated and materials with different letters have significantly different values (Bottom) (ANOVA, Tukey ). Shades with the same letter are not statistically significantly different at . Samples size () for all materials. Error bars represent standard deviation.  When comparing the A2 shades between the four different composite systems, the order of highest to lowest of was: , (ANOVA, Tukey, ). Although Z100 had a trend toward higher than FSU, it was not found to be statistically significant. This was not clearly distinguished using the bulk mean reflectivity of the resin material (Fig. 7). The four composites had fairly similar backscattering values, and the empress composite was not found to be measurably different in terms of backscattering from the other three composites. The backscattering of each of the resin composites had clear differences in scattering intensity to sound enamel and frank enamel caries (Fig. 8). This allows the materials to be differentiated from sound and frank caries in CP-OCT imaging. The mean scattering of sound enamel and frank caries is an update to our clinical evaluation published elsewhere.14 Fig. 7The mean reflectivity (dB) examined the average backscattering of the A2 shade composite material measured by CP-OCT. Using just the intensity of the backscattering does not predict the attenuation nor differentiate the imaging depth between materials. All composites () tested had a mean reflectivity between sound (SE, ) and carious enamel (FC, ). Materials with different letters have significantly different values (ANOVA, Holm-Sidak ). Error bars not displayed have standard deviations less than 1 dB.  Fig. 8SEM images of the polished composite restorations: (a) FSU_T; (b) SQK_CE; (c) FSU_A2; (d) SQK_A2; (e) EMD_A2; (f) Z100_A2. Images were acquired with the magnification of 20,000.  Table 2 shows the relative atomic abundance expressed as a percent of relative weight of select shade types after EDS analysis. The carbon (C) content of the EDS is mostly related to the resin matrix amount. Silica (Si), zirconium (Zr), barium (Ba), and aluminum (Al) are found in the filler components. EDS analysis confirmed that EMD was primarily a barium-aluminum glass with low levels of Zr. Z100, FSU, and SQK each have similar but slightly different amounts of Si and Zr. There was no direct relationship to the ratio of and values between composites systems. Only FSU and EMD translucent shades, which showed higher than the enamel shades, showed relative lower (filler) and higher “C” content (resin matrix). Table 2Energy dispersive x-ray micro-analysis of the composite resins with relative values expressed in weight percentages.
The SEM images of A2 and CS from the four composite systems show clear differences in filler size, shapes, and composition (Fig. 8). TEM images reveal density of the filler particles relative to the surrounding matrix (Figs. 9 and 10). SQK A2 shade had distinctly sized particles: after averaging a large number of particles (). SQK CE shade had similar sized particles: after averaging a large number of particles (). EMD shade A2 showed large, irregular particles mixed with spherical particles of after averaging a large number of particles (). TEM images of SQK and EMD both show distinct atomic density grain boundaries. Both FSU and Z100 (Fig. 9) had the presence of nanoparticles that filled in around larger size particles or clusters of nanoparticles. 4.DiscussionThe significance of this work is that CP-OCT imaging of dental resin composites showed enormous variation, and there should be immediate concern about the clinical application of CP-OCT to detect and quantify demineralization deep under the margins of a composite restoration. This is especially important because, in many cases, clinicians need to assess demineralization under a composite material whose brand and formulation is unknown. The deltaR (calculated 500 μm in depth) of the HA disc represented a severe caries model (caries “phantom”). Other CP-OCT studies have examined artificial caries models where surface softening can yield 50-μm deep lesions with deltaR values of .28 Comparing the HA discs to natural noncavitated lesions shows that the deltaR of HA is at least twice the severity of a white spot lesion.29 Since this study showed such large differences in measuring the HA under different composite systems, then it can be inferred that it would be unfeasible for a clinician to assess a CP-OCT image of an unknown composite and determine the scattering intensity of any underlying secondary caries demineralization. Despite this issue regarding current composite systems, this study presented a reproducible model to test the effect of material composition on CP-OCT imaging. This will hopefully lead to future CP-OCT imaging work to examine experimental formulations of composite materials. The model system of imaging HA discs below composite materials was necessary because using the average backscattering of the composite alone (mean reflectivity) does not predict the imaging depth nor differentiate the signal attenuation between materials. There are three main reasons. First, CP-OCT imaging of the composite material alone cannot account for attenuation from absorption. Second, CP-OCT only measures the backscattered signal, which means that CP-OCT images do not account for forward directed (anisotropic) scattering. Many resin composite restorations contain large size () “strength bearing” particles that cause this anisotropic scattering. Anisotropic scattering, which depends on particle shape and size, and the resin refractive index, degrades the NIR propagating signal.30 Third, which is unique to cross-polarized systems, CP-OCT does not measure any scattering/reflections by spherical filler particles that only partially depolarize the incident signal. For ideal spherical particles, the scattered signal preserves the polarization state of the incident beam. The CP-OCT system in this study cannot directly measure scattered light that maintains the incident P-polarization state, since only the cross-polarization (S-polarization) state was measured. Therefore, CP-OCT of the bulk material was prone to underestimating the degree of attenuation from scattering. Our model system used discs that were imaged at a fixed distance from the CP-OCT probe window. This fixed depth was necessary to standardize the scattering intensity and deltaR of the HA. The degree of scattering and depolarization makes these HA discs ideal “phantoms” for CP-OCT imaging experiments. Another benefit of using the HA disc model is the consistency of the scattering of the manufactured disc opposed to the high scattering variability from artificial or natural lesions. This allows the HA disc model to represent a severe model where the small standard deviations allows statistical comparison between overlying composite materials in a secondary caries model. The small deviation in the deltaR of the HA discs was accomplished by controlling the imaging depth, which reduces the depth dependence of the scattering (confocal parameter). Any concerns about imaging distance can be compensated by using our proposed set up and the parameter. can be used for future CP-OCT studies using probes with higher NA lens since the ratio accounts for the influence of focal distance on signal degradation. This will be important when comparing an even greater number of composite materials in future studies. Another aim of our study was to examine the CP-OCT imaging effects of colorants and shade type. Although the exact formulations are not known in this study, previous work has shown that the concentration of various iron oxides can differ by over two fold between the shades from A thru D.20 For each of our composite systems, there was not a consistent attenuation difference in the NIR signal for A to D shades. More work is needed to assess an even greater number of shade types and experimental formulations. This study clearly illustrated how each of the four composite systems had unique differences in filler size, distribution, and composition. One of the main shortcomings of this study is that it examined commercially available composites. It is impossible to examine the refractive index mismatch between the filler particles and the resin matrix, which is one of the main determinates of overall scattering.17 Investigating the refractive index mismatch on CP-OCT imaging is best accomplished using experimental composite mixtures where the refractive index and exact percentages of the filler and resin constituents are known. However, the process of the final composite mixture with nanoparticles remains challenging with several proprietary techniques employed to reduce the agglomeration of nanoparticles.31 Despite the limitations of this study, there were still some important conclusions when comparing our combined chemical and structural analysis with the CP-OCT imaging results. All SQK composite types showed very low values indicating the high degree of NIR light attenuation of the material. SEM/TEM images confirmed that the material was comprised of a fairly uniform arrangement of 125 to 130-nm particles. TEM analysis showed that these particles have high atomic density versus the surrounding matrix. EDS analysis showed that zirconium (Zr) and silica (Si) are present in the filler, possibly in a blended combination using the sol-gel method of fabrication reported by the manufacturer.32 TEM analysis confirmed that the was confined to the filler region. There is likely a high refractive index mismatch between the filler particles and the resin matrix. The manufacturer reports that the filler content is by volume, and in addition, provides evidence that SQK scatters red laser light more diffusely than EMD or FSU.32 With a longer incident wavelength, 1310-nm light from CP-OCT would be expected to have less diffuse anisotropic scattering light than red light. With 1310-nm incident light, the average size particles in SQK will cause a combination of isotropic and anisotropic scattering. Diffuse anisotropic scattering will still cause signal degradation in CP-OCT. The CP-OCT imaging results did not show clear distinct differences in the enamel shades versus the CE. No chemical difference in the EDS analysis was found between A2 and CE. SEM/TEM images did not provide any clear difference between the two shade types. It is important to point out that our EDS results show that FSU has higher relative Zr content than SQK. Given the high refractive index of Zr, with a known refractive index of in the visible range, if the Zr was confined only in the filler particles (nanoclusters) of FSU, there would be a high refractive index mismatch between the nanoclusters and the surrounding resin. This would result in more attenuation in the CP-OCT imaging of FSU than seen in SQK. The opposite observation was seen and can be attributed to the Zr presence in the resin matrix. Our TEM analysis confirms the presence of high atomic weight particles, which were likely to be nanozirconia () and nanosilica (), dispersed in both the nanoclusters and the resin matrix (Figs. 9 and 10). There are no regions where the resin is unfilled, which would appear white in the TEM image (as seen in SQK) due to the low atomic density of atoms that make up resin monomers and polymers. According to the manufacturer, there are various monomers and polymer resins that are added to make up the resin matrix.33 Adding nanoparticles to the resins can change the effective refractive index of the matrix that the larger nanoclusters () are embedded in. The fine nanoparticles added to the matrix in a dispersed nonagglomerated form were likely chosen to be below th of the wavelength of visible light, which removes the Mie Scattering effects. These minute particles do not create grain boundaries for refractive index induced scattering of visible and NIR light. The particles themselves become “components” of the resin matrix. With the resin matrix being several different polymers and the nanoparticles, the effective matrix refractive index is approximated by the volume average of the refractive indices of the components using the rule of mixture.34 The nanoclusters themselves are a composition of nanozirconia or nanosilica. The volume average refractive index mixing rule applies to the nanoclusters as well. The refractive index of the nanoclusters can be changed depending on the ratio of the amounts of nanosilica and nanozirconium that are clustered together in manufacturing. Our CP-OCT results show that FSU has higher transparency than SQK, despite high Zr, and this can be contributed to the mono/polymers that are used for the matrix and nanozirconia and nanosilica being dispersed in both the resin matrix and nanoclusters. Therefore it appears that the Filtek system can carefully manipulate the refractive index of the resin and larger nanocluster particles to be quite transparent to NIR light, especially the transparent shade. CP-OCT imaging actually did not find any statistical difference between Z100 and FSU values for the A2 shade, which shows a similar NIR attenuation. Z100 has a wide range of particle sizes (0.01 to 3.5 μm) reported by the manufacturer35 and seen in the SEM images. EDS analysis confirms that Z100 has higher relative Zr content than SQK. There are many compositional differences between FSU and Z100, but a common feature, which is seen in TEM, is that the resin matrix is filled with smaller particles that can volume average the refractive index of the resin matrix, especially when interacting with a longer wavelength such as 1310 nm. Z100 does not have nanoclusters but a distribution of larger particles. TEM analysis shows that Z100 has high atomic weight particles making up the nanoparticles, submicron, and micron size particles. There is a general uniformity in the atomic density of all the particle sizes of the materials indicating that the composite material filler has compositional uniformity. This reduces scattering by allowing the resin matrix with smaller particles to be index matched closer to larger particles. For larger submicron- and micron-sized filler particles, it is expected, based on Mie Scattering, that the scattering from attenuation will be dominated by anisotropic forward scattering. The low mean reflectivity of the backscattering measured by CP-OCT indicated that scattering is more anisotropic for Z100 than SQK. EMD composite was found to have the highest among the A2 shade composites. TEM clearly shows that the composite materials do not possess an abundance of particles below 100 nm that could volume average the refractive index. Based on the manufacturer’s data and our TEM analysis of the spherical particle size, EMD is composed of barium glass () and spherical oxides (127 nm). The EDS analysis showed that EMD contained the least amount of zirconium, and TEM analysis showed that there were distinct differences in the atomic densities among the different filler particles. Based on manufacturer’s data, EMD has the lowest filled composite by volume, which may contribute to a decreased number of scattering grain boundaries. The reason for the superior NIR translucency and high values measured in this study was likely because of a favorable resin matrix/filler refractive index matching of EMD. The EMD materials contain a low refractive index but radiopaque filler, barium glass ( @ 477 nm),36 and a combination of resins. The combination is important. Bis-GMA is not the main resin component of EMD but is added as a secondary resin (up to 10% by weight), and it has a nearly equal refractive index ( @ 467 nm)37 as the barium glass filler. In the case of the EMD composites, the volume average refractive indexing rule is used in the mixture of the methacrylate ( @ 480 nm)38 and Bis-GMA to achieve refractive index matching between the filler and resin matrix. In conclusion, this study highlights the concern of using CP-OCT to detect demineralization deep under the margins of a composite restoration. CP-OCT may remain at this time, with current composites, only useful for only assessing the immediately underlying marginal interface of composite restorations. Future work is needed to examine experimental composite systems. This may lead to advancements in optimizing NIR transmission with resin material while preserving mechanical and physical properties that lead to long-term success of a composite restoration. AcknowledgmentsThis work was supported by NIH Grant 1R01DE021366-01, 3M Foundation Nontenured Faculty Award, and the University of Minnesota. Parts of this work were carried out in the University of Minnesota I.T. Characterization Facility, which receives partial support from NSF through the NNIN program. The study would like to thank Conrado Aparicio and Ruoqiong Chen for their contributions. The study would also like to thank Tokuyama Dental and 3M ESPE for partial material donations and Rich Russin at 3M for his assistant in interpreting published technical reports. ReferencesM. R. Heeet al.,
“Optical coherence tomography for ophthalmic imaging—new technique delivers micron-scale resolution,”
IEEE Engin. Med. Bio. Mag., 14
(1), 67
–76
(1995). http://dx.doi.org/10.1109/51.340751 0739-5175 Google Scholar
D. Huanget al.,
“Optical coherence tomography,”
Science, 254
(5035), 1178
–1181
(1991). http://dx.doi.org/10.1126/science.1957169 SCIEAS 0036-8075 Google Scholar
J. G. Fujimotoet al.,
“High resolution in vivo intra-arterial imaging with optical coherence tomography,”
Heart, 82
(2), 128
–133
(1999). 1355-6037 Google Scholar
A. C. Koet al.,
“Ex vivo detection and characterization of early dental caries by optical coherence tomography and Raman spectroscopy,”
J Biomed. Opt., 10
(3), 031118
(2005). http://dx.doi.org/10.1117/1.1915488 JBOPFO 1083-3668 Google Scholar
B. T. Amaechiet al.,
“Quantification of root caries using optical coherence tomography and microradiography: a correlational study,”
Oral Health Prev. Dent., 2
(4), 377
–382
(2004). 1602-1622 Google Scholar
L. S. de Meloet al.,
“Evaluation of enamel dental restoration interface by optical coherence tomography,”
J. Biomed. Opt., 10
(6), 064027
(2005). http://dx.doi.org/10.1117/1.2141617 JBOPFO 1083-3668 Google Scholar
G. Q. Monteiroet al.,
“Marginal analysis of resin composite restorative systems using optical coherence tomography,”
Dent. Mater., 27
(12), e213
–e223
(2011). http://dx.doi.org/10.1016/j.dental.2011.08.400 DEMAEP 0109-5641 Google Scholar
J. S. Holtzmanet al.,
“Ability of optical coherence tomography to detect caries beneath commonly used dental sealants,”
Lasers Surg. Med., 42
(8), 752
–759
(2010). http://dx.doi.org/10.1002/lsm.20963 LSMEDI 0196-8092 Google Scholar
L. L. Otiset al.,
“Identification of occlusal sealants using optical coherence tomography,”
J. Clin. Dent., 14
(1), 7
–10
(2003). Google Scholar
T. A. Bakhshet al.,
“Non-invasive quantification of resin-dentin interfacial gaps using optical coherence tomography: validation against confocal microscopy,”
Dent. Mater., 27
(9), 915
–925
(2011). http://dx.doi.org/10.1016/j.dental.2011.05.003 DEMAEP 0109-5641 Google Scholar
K. Ishibashiet al.,
“Swept-source optical coherence tomography as a new tool to evaluate defects of resin-based composite restorations,”
J. Dent., 39
(8), 543
–548
(2011). http://dx.doi.org/10.1016/j.jdent.2011.05.005 0022-0345 Google Scholar
J. StahlH. KangD. Fried,
“Imaging simulated secondary caries lesions with cross polarization OCT,”
Proc. SPIE, 7549 754905
(2010). http://dx.doi.org/10.1117/12.849332 Google Scholar
R. S. JonesM. StaninecD. Fried,
“Imaging artificial caries under composite sealants and restorations,”
J. Biomed. Opt., 9
(6), 1297
–1304
(2004). http://dx.doi.org/10.1117/1.1805562 JBOPFO 1083-3668 Google Scholar
P. Lentonet al.,
“Imaging in vivo secondary caries and ex vivo dental biofilms using cross-polarization optical coherence tomography,”
Dent. Mater., 28
(7), 792
–800
(2012). http://dx.doi.org/10.1016/j.dental.2012.04.004 DEMAEP 0109-5641 Google Scholar
D. Friedet al.,
“Imaging caries lesions and lesion progression with polarization sensitive optical coherence tomography,”
J. Biomed. Opt., 7
(4), 618
–627
(2002). http://dx.doi.org/10.1117/1.1509752 JBOPFO 1083-3668 Google Scholar
J. P. Dunkerset al.,
“Optical coherence tomography of glass reinforced polymer composites,”
Compos. Appl. Sci. Manuf., 30
(2), 139
–145
(1999). http://dx.doi.org/10.1016/S1359-835X(98)00084-0 1359-835X Google Scholar
M. Otaet al.,
“Influence of refractive index on optical parameters of experimental resin composites,”
Acta Odontol Scand, 70
(5), 362
–367
(2012). http://dx.doi.org/10.3109/00016357.2011.600724 AOSCAQ 0001-6357 Google Scholar
J. L. Ferracane,
“Resin composite—state of the art,”
Dent. Mater., 27
(1), 29
–38
(2011). http://dx.doi.org/10.1016/j.dental.2010.10.020 DEMAEP 0109-5641 Google Scholar
H. Naeimi Akbaret al.,
“Relationship between color and translucency of multishaded dental composite resins,”
Int. J. Dent., 708032
(1), 1
–5
(2012). IJDNB4 1687-8736 Google Scholar
O. KimJ. W. Shim,
“Studies on the preparation and mechanical properties of esthetic polymeric dental restoratives using silane treated silica microfiller via freeze-drying,”
Polymer Compos., 22
(5), 650
–659
(2001). http://dx.doi.org/10.1002/(ISSN)1548-0569 PCOMDI 0272-8397 Google Scholar
J. A. Duffie,
“Radiation transmission through covers and absorption by collectors,”
Solar Engineering of Thermal Processes, 171
–196 Wiley, New York
(1980). Google Scholar
W. Clark,
“Optical characteristics of materials in the infrared,”
Photography by Infrared, Its Principles and Applications, 339
–371 J. Wiley & Sons, inc., New York, London
(1939). Google Scholar
H. NamduriS. Nasrazadani,
“Quantitative analysis of iron oxides using Fourier transform infrared spectrophotometry,”
Corrosion Sci., 50
(9), 2493
–2497
(2008). http://dx.doi.org/10.1016/j.corsci.2008.06.034 CRRSAA 0010-938X Google Scholar
K. Fischer,
“Scientific Documentation IPS Empress® Direct,”
1
–24 Schaan, Liechtenstein
(2010). Google Scholar
G. R. Hunt,
“Spectral signatures of particulate minerals in the visible and near infrared,”
Geophysics, 42
(3), 501
(1977). GPYSA7 0016-8033 Google Scholar
B. LiuM. E. Brezinski,
“Theoretical and practical considerations on detection performance of time domain, Fourier domain, and swept source optical coherence tomography,”
J. Biomed. Opt., 12
(4), 044007
(2007). http://dx.doi.org/10.1117/1.2753410 JBOPFO 1083-3668 Google Scholar
T. Louieet al.,
“Clinical assessment of early tooth demineralization using polarization sensitive optical coherence tomography,”
Lasers Surg. Med., 42
(10), 738
–745
(2010). http://dx.doi.org/10.1002/lsm.21013 LSMEDI 0196-8092 Google Scholar
H. Kanget al.,
“Nondestructive assessment of early tooth demineralization using cross-polarization optical coherence tomography,”
IEEE J. Sel. Top. Quantum Electron, 16
(4), 870
–876
(2010). http://dx.doi.org/10.1109/JSTQE.2009.2033610 1077-260X Google Scholar
P. NgaotheppitakC. L. DarlingD. Fried,
“Measurement of the severity of natural smooth surface (interproximal) caries lesions with polarization sensitive optical coherence tomography,”
Lasers Surg. Med., 37
(1), 78
–88
(2005). http://dx.doi.org/10.1002/(ISSN)1096-9101 LSMEDI 0196-8092 Google Scholar
R. K. Wang,
“Signal degradation by multiple scattering in optical coherence tomography of dense tissue: a Monte Carlo study towards optical clearing of biotissues,”
Phys. Med. Biol., 47
(13), 2281
–2299
(2002). http://dx.doi.org/10.1088/0031-9155/47/13/307 PHMBA7 0031-9155 Google Scholar
S. Leeet al.,
“Refractive index engineering of transparent -polydimethylsiloxane nanocomposites,”
J. Mater. Chem., 18
(15), 1751
–1755
(2008). http://dx.doi.org/10.1039/b715338d JMACEP 0959-9428 Google Scholar
“Technical Report: Estelite Sigma Quick,”
(2011). Google Scholar
“Techinical Product Profile: Filtek Supreme Ultra,”
(2010). Google Scholar
T. F. W. Barth,
“Optical properties of mixed crystals,”
Am. J. Sci., s5–19
(110), 135
–146
(1930). http://dx.doi.org/10.2475/ajs.s5-19.110.135 0002-9599 Google Scholar
“Filtek Z250 Technical Product Profile,”
(1998). Google Scholar
N. EmamiM. SjodahlK. J. Soderholm,
“How filler properties, filler fraction, sample thickness and light source affect light attenuation in particulate filled resin composites,”
Dent. Mater., 21
(8), 721
–730
(2005). http://dx.doi.org/10.1016/j.dental.2005.01.002 DEMAEP 0109-5641 Google Scholar
A. C. ShortallW. M. PalinP. Burtscher,
“Refractive index mismatch and monomer reactivity influence composite curing depth,”
J. Dent. Res., 87
(1), 84
–88
(2008). http://dx.doi.org/10.1177/154405910808700115 0022-0345 Google Scholar
S. N. Kasarovaet al.,
“Analysis of the dispersion of optical plastic materials,”
Opt. Mat., 29
(11), 1481
–1490
(2007). http://dx.doi.org/10.1016/j.optmat.2006.07.010 0925-3467 Google Scholar
|


