|
|
1.IntroductionLow-frequency oscillations (LFOs) are slow, spontaneous variations in hemodynamic parameters such as oxygenation and pressure. The origins of these oscillations remain unclear; the terminology describing them is confusing (e.g., spontaneous oscillations, low-frequency waves or oscillations, V-signals); even the definition is under debate.1–5 Most studies address variations with a center frequency of around 0.1 Hz, but the range of frequencies varies. Some (e.g., Refs. 1 and 6) define a frequency range of 0.01–0.1 Hz; however, others (e.g., Ref. 4) have defined the range to be around 0.04–0.15 Hz. LFOs are a prominent signal component in functional imaging studies. They are observed in functional near-infrared spectroscopy (NIRS) studies,2–5 as well as in blood oxygen level-dependent functional magnetic resonance imaging (BOLD fMRI) time courses,7–10 where they are often interpreted as indicative of correlated neuronal activity in different parts of the brain. However, substantial evidence suggests that at least a portion of the LFOs seen in brain imaging studies is nonneuronal and may arise in part from the influence of instrumental noise and aliasing artifacts from undersampled cardiac and respiratory fluctuations, due to the low sampling rate in fMRI studies.8,10 Other low-frequency physiological sources of these LFO components may include vasomotion from oscillations in the vascular tone thought to be generated within the vessel walls5,11 or variations in respiratory volume and cardiac rate resulting from systemic modulation of cerebral blood flow.1,8,9,12–16 Mayer waves () are systemic changes in arterial pressure, and they also are thought to contribute to LFOs, although the origin and purpose of these fluctuations is still being debated.17 Recent studies have associated LFOs measured in the head using NIRS with the arterial pressure signal. Spectral coherence between mean arterial pressure and oxy-hemoglobin concentration change (Δ[HbO]) in the low-frequency range has been found to be useful in studying global (or regional) autoregulation.18 The phase angle between arterial blood pressure and Δ[HbO] or deoxy-hemoglobin concentration change (Δ[Hb]) around 0.1 Hz has been shown to be sensitive to level.19 These findings may shed new light on the origin and function of the LFOs; at a minimum, they confirm that a component of the LFO signal measured in the brain with NIRS reflects systemic fluctuation. The effect of this systemic physiology, which leads to high temporal correlations between broad regions of the brain, can complicate the interpretation of the results of functional studies.20 In the periphery, LFOs have been recorded using various methods including NIRS, transcranial Doppler and laser Doppler flowmetry, and dynamic arterial blood pressure measurements with digital photoplethysmographic devices (e.g., Refs. 3 and 2122.23.24.25.–26). Some putative contributors to LFOs have been confirmed. In the periphery, vessel diameter changes or vasomotion have been investigated with plethysmograph devices,27,28 and Mayer waves have been shown in a study comparing the finger, toe, and arm as measurement sites using laser Doppler in healthy participants.25 More interestingly, results of the latter study also demonstrated temporal synchrony between the different peripheral measurement sites in the low-frequency domain.25 Considering that modulations in oxygen consumption, measurable with NIRS in various peripheral sites, have been investigated for the purposes of following disease progression or aging-related processes,21 further characterization of these peripheral signals seems valuable. In our previous work, we demonstrated the ability to isolate nonneuronal LFO signals throughout the brain by performing NIRS concurrently with fMRI29 and then utilizing a timelag-dependent analysis approach called regressor interpolation at progressive time delays (RIPTiDe).30,31 Here, we extend our efforts to compare the LFOs in the brain (measured by BOLD fMRI) with those of peripheral sites (measured by NIRS) utilizing concurrent resting state fMRI/peripheral NIRS (finger and toes) in healthy volunteers. The goal of this study was to 1. determine whether the temporal shifts between the LFOs measured at different sites (including the brain) could be informative biomarkers that might be used to identify pathological vascular function; 2. offer a direct, convincing analytical procedure to link the cerebral and peripheral LFOs; and 3. demonstrate that the same procedure can quantitatively assess the contribution of systemic LFOs in BOLD fMRI—this may be exploited for the purpose of removing physiological noise from the BOLD fMRI data. 2.Materials and Methods2.1.Protocols and InstrumentationConcurrent NIRS and fMRI resting-state studies were conducted in six healthy volunteers participating in an ongoing protocol (three men and three women, , ). Participants were asked to lie quietly in the scanner and view a gray screen with a fixation point in the center. The Institutional Review Board at McLean Hospital approved the protocol, and volunteers were compensated for their participation. All MR data were acquired on a Siemens TIM Trio 3T scanner (Siemens Medical Systems, Malvern, PA) using a 32-channel phased-array head matrix coil (200 time points, , flip angle 90 deg, by 64 on a 224- by 224-mm FOV, 50 2.5-mm slices with 0.625-mm gap parallel to the AC-PC line extending down from the top of the brain). Physiological waveforms (pulse oximetry and respiratory depth) were recorded using the scanner’s built-in wireless fingertip pulse oximeter and respiratory belt. The optical device used in this experiment is a near-infrared tissue imager (Imagent, ISS, Champaign, IL) comprising 16 laser sources at 690 and 830 nm (average power of about 1 mW) and four optical detectors (photomultiplier tubes, Hamamatsu Photonics R928). The imager was placed in the control room, and 10-m-long optical fibers (illumination fibers with 400 μm in core diameter) and fiber bundles (a collection fibers with 3 mm in diameter) were used to connect the laser diodes and detectors with optical probes in the 3T scanner. Two (and sometimes three) NIRS optical probes were made from MRI-compatible materials (ABSplus and neoprene) using a three-dimensional (3-D) printer (uPrint SE 3D, Stratasys, Eden Prairie, MN). Each probe included one collection fiber and one pair of illumination fibers (690 and 830 nm). The separation between the collection and illumination fibers was 1.5 cm. The probes were placed over the tip of each participant’s left middle finger and left big toe (and also the right big toe in three participants), as shown in Fig. 1(a) and 1(b), respectively, with a black elastic band. The sampling rate of the NIRS data acquisition was 12.5 Hz to fully sample the cardiac waveform. fMRI data were collected for 10 min; NIRS data were recorded continuously during this time, and for several minutes before and after the fMRI acquisition. Fig. 1Experimental setup and example of near-infrared spectroscopy (NIRS) temporal traces. Schematic drawing of the placement of the NIRS probes on the middle fingertip (a) and the big toe (b). Raw temporal traces of changes in total hemoglobin concentration Δ([tHb]) obtained by NIRS at the fingertip and left toe (c). Enlarged section of (c) (indicated by gray block) shown in (d). The low-frequency oscillation (LFO) signal of the finger and toe from (c) permit calculating that the signal measured at the toe is 2.72 s later than that of the finger (e).  2.2.NIRS Regressor PreparationEach pair of raw NIRS time courses (690- and 830-nm data) was converted into three time courses representing Δ[HbO], Δ[Hb] and total hemoglobin concentration change (Δ[tHb]) using the modified Beer-Lambert law32,33 in Matlab (The Mathworks, Natick, MA). For the differential pathlength factors, we used published values of 6.51 at 690 nm and 5.86 at 830 nm.34 The low-frequency component () of Δ[HbO], Δ[Hb], and Δ[tHb] was obtained by using a zero-delay Fourier-domain bandpass filter in Matlab. Although BOLD is sensitive to the Δ[Hb] signal, it has been shown to be sensitive to changes in cerebral blood volume (CBV) and cerebral blood flow (CBF) as well.35 In particular, changes in CBV are more closely associated with physiological LFOs;9 CBV is best reflected by the Δ[tHb] NIRS waveform.36 Moreover, the Δ[tHb] obtained by NIRS has a higher signal-to-noise ratio than Δ[Hb] and captures BOLD variations in the low-frequency range with greater statistical significance than the Δ[Hb] time course. Therefore, the temporal trace of Δ[tHb] from NIRS was selected for correlation with BOLD signals. 2.3.CorrelationsFor each participant, the correlation between fingertip and toe data was calculated. The LFO portion of Δ[tHb] at the fingertip and toes were first extracted using a zero-delay Fourier-domain bandpass filter () in Matlab. The two derived LFO signals were then cross-correlated in Matlab to calculate the maximum correlation and corresponding temporal shifts between these two signals. For the concurrent analyses, the fingertip LFOs were used because the blood vessels that supply blood to the arm and the brain are much closer on the vascular tree than those supplying the toes. Moreover, the fingertip is a commonly used blood oxygenation and pulse recording site. We then applied RIPTiDe30,31 to both the fingertip NIRS and fMRI datasets for each participant. This analysis was carried out using a combination of in-house Matlab tools and FEAT, part of the FSL analysis package (FMRIB Expert Analysis Tool, v5.98, http://www.fmrib.ox.ac.uk/fsl, Oxford University, UK).37 First, the LFO component of the fingertip Δ[tHb] NIRS waveform was extracted using the same bandpass filter. Because the LFOs detected at the finger are presumed to travel with the blood and arrive in each voxel with variable latency, we applied a range of time shifts to the NIRS signal prior to filtering to capture all the voxels that correlated with the NIRS signal at any latency. Then the temporal signal was downsampled to the 3-s TR of the fMRI acquisition. The resulting time traces were used as regressors in a GLM analysis of the fMRI data. A positive time-shift value corresponded to events that occurred before the time the NIRS data was recorded at the fingertip, meaning the signal arrived earlier in the brain than in the fingertip. We considered 181 time shift values covering the range of to with respect to the unshifted signal, in steps of 0.16 s (for Video 1, a longer covering range was chosen for the purpose of dynamic display). The range of the time shifts was determined on the basis of a preliminary analysis to find the range over which significant correlations were observed. Video 1The dynamic passage of the LFO wave is shown in red-yellow. The green dot in the middle panel indicates the time lags NIRS regressor (from fingertip) was shifted. The total time shift is from to at steps of 0.16 s. The video was played repeatedly, each time with shifted coronal and axial views marked by the cross. The color bar indicates the colors corresponding to the value from 2.3 to 8 (QuickTime, 1.9 MB) [URL: http://dx.doi.org/10.1117/1.JBO.17.10.106004.1].  For each participant, standard fMRI preprocessing steps [including motion correction, high-pass filter (), and slice timing correction] were applied to the original BOLD data before further analysis. The RIPTiDe procedure determined two independent quantities: the time delay value between the NIRS and fMRI data, and the contribution of the delayed NIRS signal to the BOLD variance. The time delay was determined by fitting a Gaussian to the cross-correlation calculated in the time domain38 (which is more robust for determining subTR time shifts in the presence of aliasing than the direct frequency domain method). This cross-correlation was implemented using 181 invocations of film_gls (part of FSL) with differently time-shifted NIRS Δ[tHb] time courses used as a regressor. The resulting thresholded -statistic maps of the LFO signals were concatenated over all time lags in sequence, and a voxelwise Gaussian fit was performed of the peak of signal in the time lag dimension to obtain the voxelwise delay values. The -statistic of the correlation between the NIRS data and the BOLD at this optimum time lag was then calculated and used to form a new 3-D thresholded -statistic map (here referred to as a “max -statistic map”). The max -statistic map represents all the voxels that highly correlate with the NIRS Δ[tHb] timecourse (fingertip) at any time. 2.4.Spectral AnalysesTo understand the spectral content of the signals being studied, we performed spectral analysis on the peripheral NIRS data and coherence analysis between peripheral NIRS and cerebral BOLD. For each participant, we calculated the power spectral density (PSD) of the Δ[tHb] signal collected at the finger by NIRS using Matlab to understand the spectral components of NIRS data. Furthermore, coherence analyses for each participant between the NIRS data (Δ[tHb] from the finger) and the BOLD from all voxels were performed using the Matlab (function “mscohere”), to understand how well the peripheral LFO (from NIRS) corresponds to BOLD fMRI at each frequency. The magnitude squared coherence (mscohere) is a function of frequency with values between 0 and 1 that indicates how well one signal corresponds to the other at each frequency. The acquisition rate of 0.33 Hz in BOLD () limits the maximum frequency of the result to be 0.16 Hz. To have meaningful coherence analysis, the BOLD signals were preprocessed using the standard “prestats” analysis in FSL, which includes motion correction, slice time correction, spatial filtering (5 mm), and high-pass filtering (). The NIRS data (Δ[tHb]) was also preprocessed using spike removal39 (Matlab), bandpass filtering () and downsampling to 0.33 Hz. For each voxel, the magnitude squared coherence was calculated from 0 to 0.16 Hz. The coherences from all voxels were averaged. The final steps involved (1) finding the frequency of maximum averaged coherence in each participant and (2) generating the corresponding coherence map at that frequency. Each coherence map was then transformed into standard space for the purpose of comparison. 3.Results3.1.Power Spectral Density of NIRS DataFigure 2 shows the PSD of the NIRS data collected at the fingertip. The figure confirms the presence of the cardiac pulsation in all the participants and clearly shows the respiration signal in three participants (3, 4, and 6). Participants 1, 2, and 5 had no clear signal at the respiratory frequency. This observation is consistent with our previous work,31 in which respiration signals were not always observed by NIRS, while the cardiac pulsation signals were always present. Moreover, the graph indicates the presence of high energy in the LFO band in the NIRS data (as in BOLD). This shows the importance the LFO in both signals, since it is the dominant component. Last, we show that by choosing the low-frequency band (), we not only preserve the high energy in the LFO, but also reduce the contamination of LFO with other physiological noise (respiration). This is critical in the study of the LFO, which may be independent of other physiological processes. 3.2.Temporal Correlations between LFOs from the Peripheral VasculatureFigure 1(c) shows the temporal trace of Δ[tHb] collected by NIRS at the left middle fingertip and on the left big toe of one representative participant. Both signals show visible LFO and cardiac signals [visible in Fig. 1(d), an enlarged part of Fig. 1(c)]. Figure 1(c) also shows the LFOs of these two signals. The maximum correlation between the signals was 0.80 at a time shift of 2.72 s (the data from the toe lags by 2.72 s) which is depicted more clearly in Fig. 1(e), in which the bandpass filter (0.01–0.15 Hz) was applied to both signals to present only the LFO signal. Our previous studies31 along with others using laser Doppler24,25,40 suggested that these LFOs travel with the blood, and thus are closely associated with blood circulation. Consequently, the LFOs will, in general, arrive at different sites (finger and toe) at different times reflecting the pathlength, vessel size, and flow rate of the blood to the target site. The longer pathlength from the heart to the foot (relative to the hand) would explain the time delays between the LFOs detected at the finger and toe. Table 1 summarizes the maximum cross-correlations and time delays between the LFOs measured at different peripheral sites with NIRS. The LFO signal reaches the toe 2.16–4 s later than the finger (time delays: ). For three participants, NIRS data was also collected at the right big toe; the LFOs from the two toes had maximal correlations () with small time shifts between sides (). Relative to the results obtained comparing finger to toes (), the correlation is higher between the data from the two toes and exhibits less temporal shift. We also calculated the correlation between the time shifts (fingertip and toe) and the participants’ heights (data shown in Table 1). No linear relationship was found, which suggests that the time delays may be affected not only by height, but also by other conditions, such as age, sex, and general health. Table 1A summary of maximum cross-correlations and time delays between the LFOs of left finger and left toe, or left toe and right toe, as well as the participants’ heights. The group means ±SD are shown.
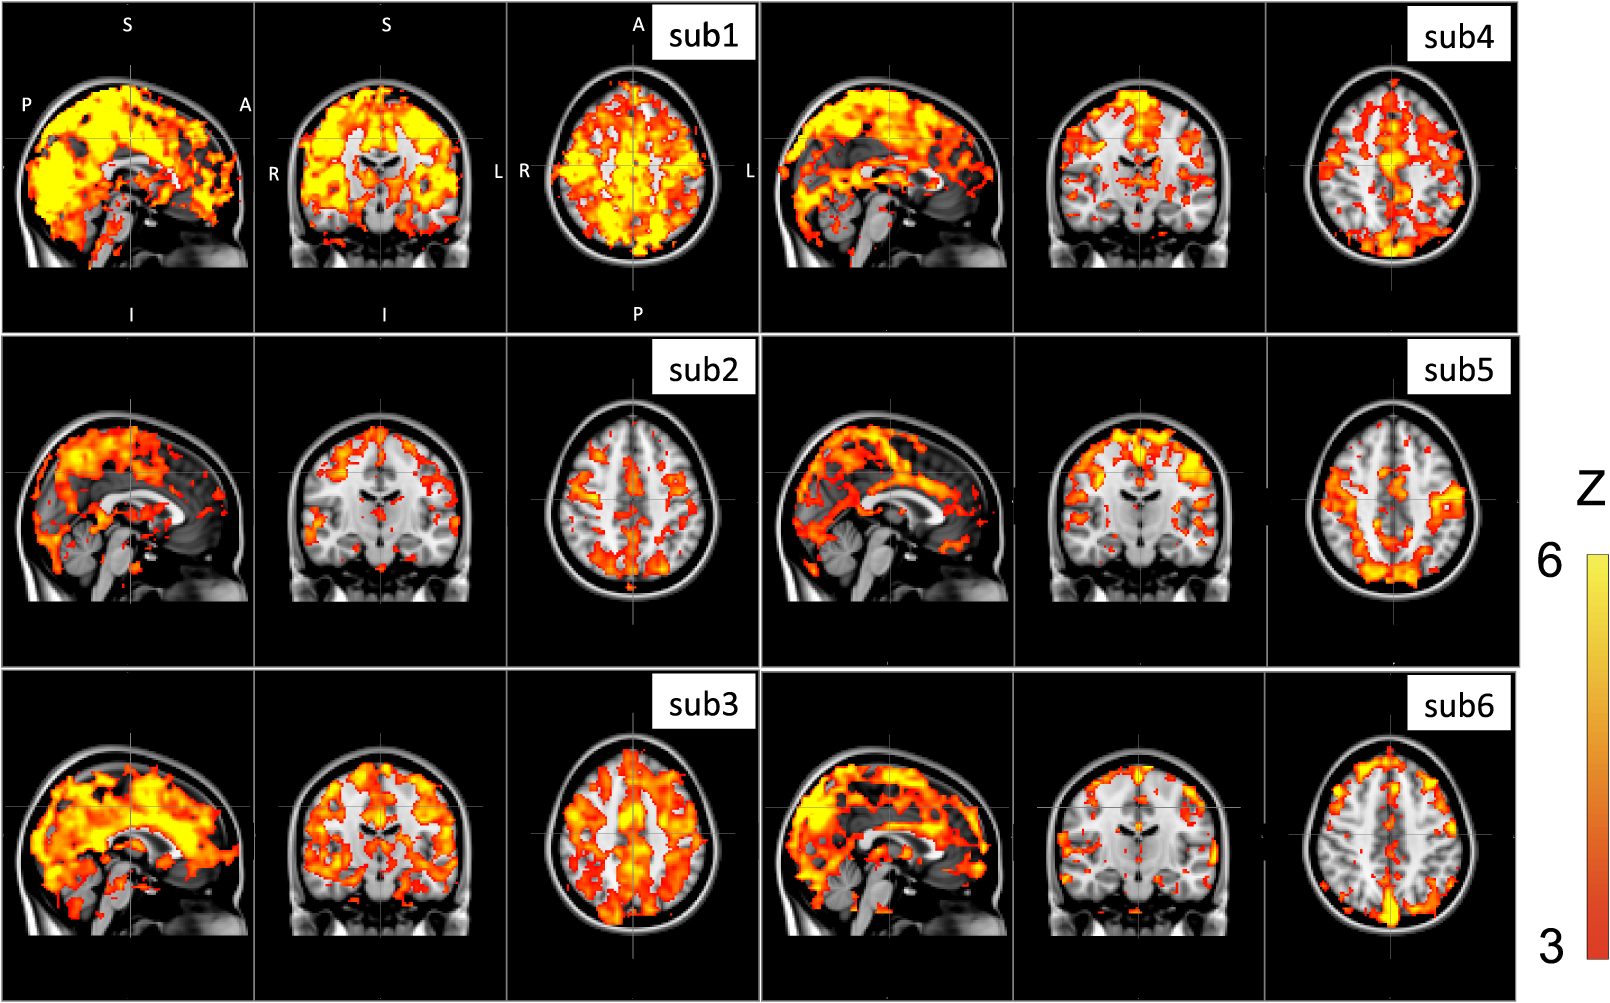
Note: MCC: max cross correlation LF: left finger LT: left toe RT: right toe SD: standard deviation. 3.3.Dynamic Propagation of LFOs throughout the BrainWe can similarly correlate the NIRS fingertip Δ[tHb] with the cerebral BOLD signal to determine whether this signal is present in the brain. Video 1depicts the spatiotemporal pattern of the LFO correlations over a range of time lags relative to the NIRS data, demonstrating the propagation of the maximum correlations throughout the brain revealed by RIPTiDe and illustrating several important points. First, the voxels, which are highly correlated with NIRS data, are widely and symmetrically distributed throughout the brain, with the highest correlation appearing in the draining veins, although there is also significant correlation throughout the gray matter. This global signal confirms that a significant portion of the LFO signal in the brain is related to systemic blood circulation variations. Second, the dynamic pattern reflects the variable arrival times of the LFOs at different parts of the brain, just as it arrives at the finger and the toe with different time delays. This latter observation supports the contention that the LFO signal directly reflects bulk blood flow and confirms our previous, brain-only measurements. To explore the relationship between the LFOs in the brain and the finger, two example points were selected in the brain of one participant, indicated by the green cross and the blue cross in Video 1. These regions were chosen to represent areas with large positive and negative delay values relative to the finger signal. Figure 3(a) and 3(b) illustrates the corresponding BOLD fMRI temporal traces (dashed gray line) together with the NIRS regressors derived from the finger (solid lines): one without any temporal shift (solid gray line) and one with the optimal temporal shift (solid black line), as estimated by RIPTiDe. The temporal shifts of the NIRS LFOs at the two locations differ substantially. They represent the arrival time of the LFOs at these two locations relative to that of the finger. The LFO signal arrived at the indicated voxels 2.16 s earlier and 1.98 s later than it reached the fingertip, respectively, for this participant, suggesting that as in the peripheral NIRS data, the wide temporal shifts of the LFOs exist in the BOLD fMRI. Clearly it is necessary to determine the optimal delay of the LFO signal for each voxel to account for the dynamic evolution of this signal. Fig. 3Temporal traces of blood oxygen level-dependent functional MRI (BOLD fMRI) and comparison with that of NIRS at the fingertip. In one participant, two points in the brain were chosen as shown in the green cross and the blue cross in Video 1; the corresponding BOLD signals (dashed line) are depicted in (a) and (b) together with the temporal traces of Δ[tHb] obtained by NIRS at the fingertip (solid gray line) and its temporal-shifted version (solid black line). A.U., arbitrary unit. 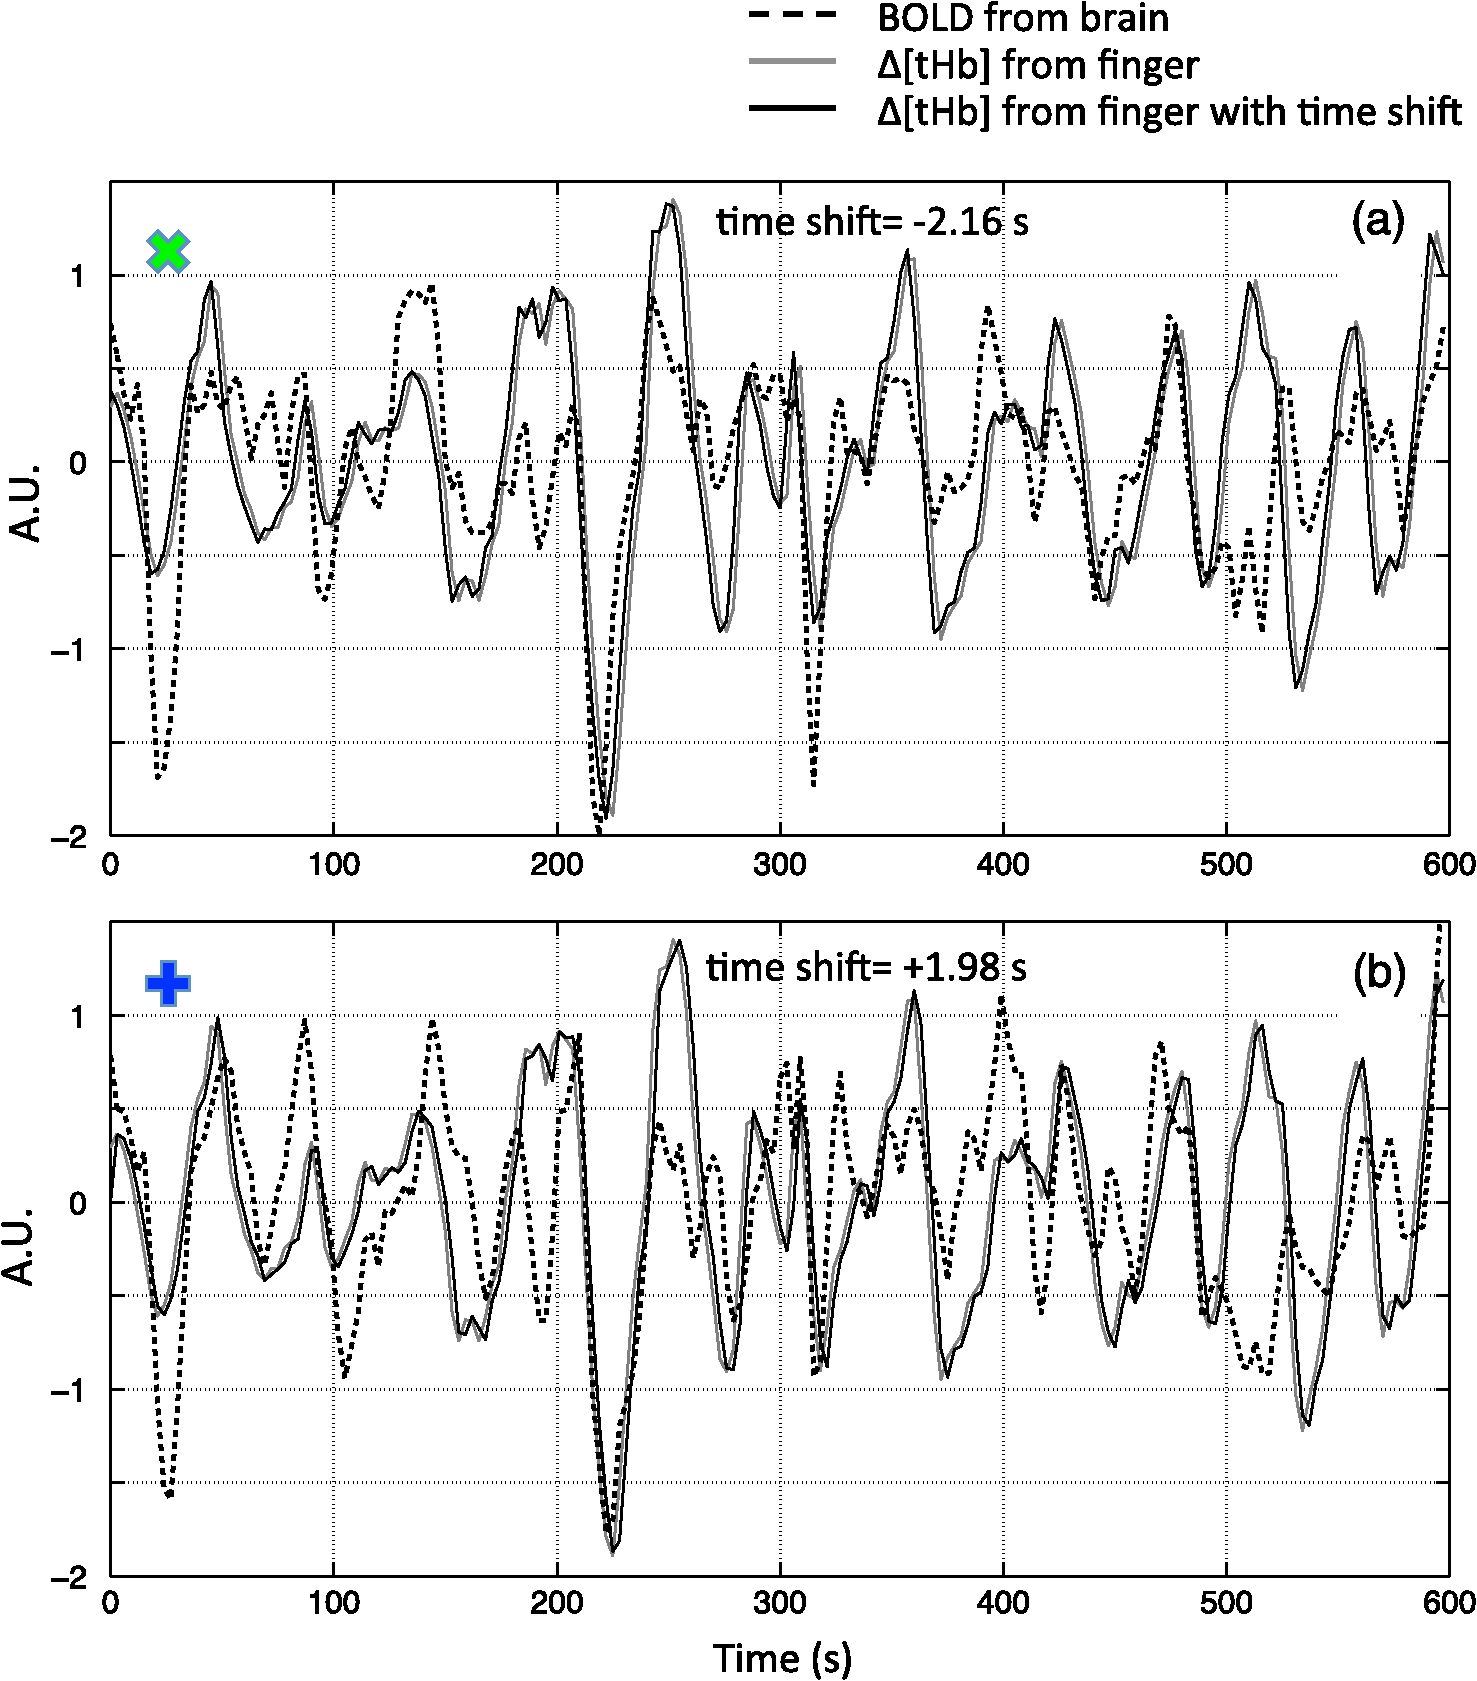 Figure 4 shows the maximum -statistic map for each participant, registered to the MNI152 brain41 in axial, sagittal, and coronal slices. The activated voxels represent areas where global circulatory LFOs accounted for a significant portion of the signal variance at some time lag within the tested range. The supra-threshold area is large and symmetric. The maximum -statistic map summarizes the correlation maps at 181 different time-shift values. This map simply combines and displays the highest significance values found without conducting any statistical analysis. 3.4.Coherence between Peripheral LFO and BOLD fMRIFigure 5 shows, for each participant, the averaged coherences over all the voxels [Fig. 5(a)] with a blue cross indicating the maximum and the corresponding coherence map at the frequency of the maximum averaged coherence [Fig. 5(b)]. From Fig. 5(a), the frequency of highest coherence between peripheral LFO and BOLD fMRI were participant specific. Only three participants (1, 5, and 6) showed clear peaks, at 0.029, 0.097, and 0.082 Hz, respectively. For the rest of the participants, there was no clearly dominant frequency. The patterns of high coherence at the dominant frequency, shown in Fig. 5(b), are similar to the patterns shown in the maximum -statistic maps (Fig. 4). Fig. 5Averaged coherence of each participant calculated between the Δ[tHb] at the fingertip and the BOLD from each voxel (a), blue cross marks the maximum coherence point. Corresponding map of coherence of each participant obtained at the frequency of max coherence (blue cross). The color bar indicates the colors corresponding to the coherence values from 0.3 to 0.7. 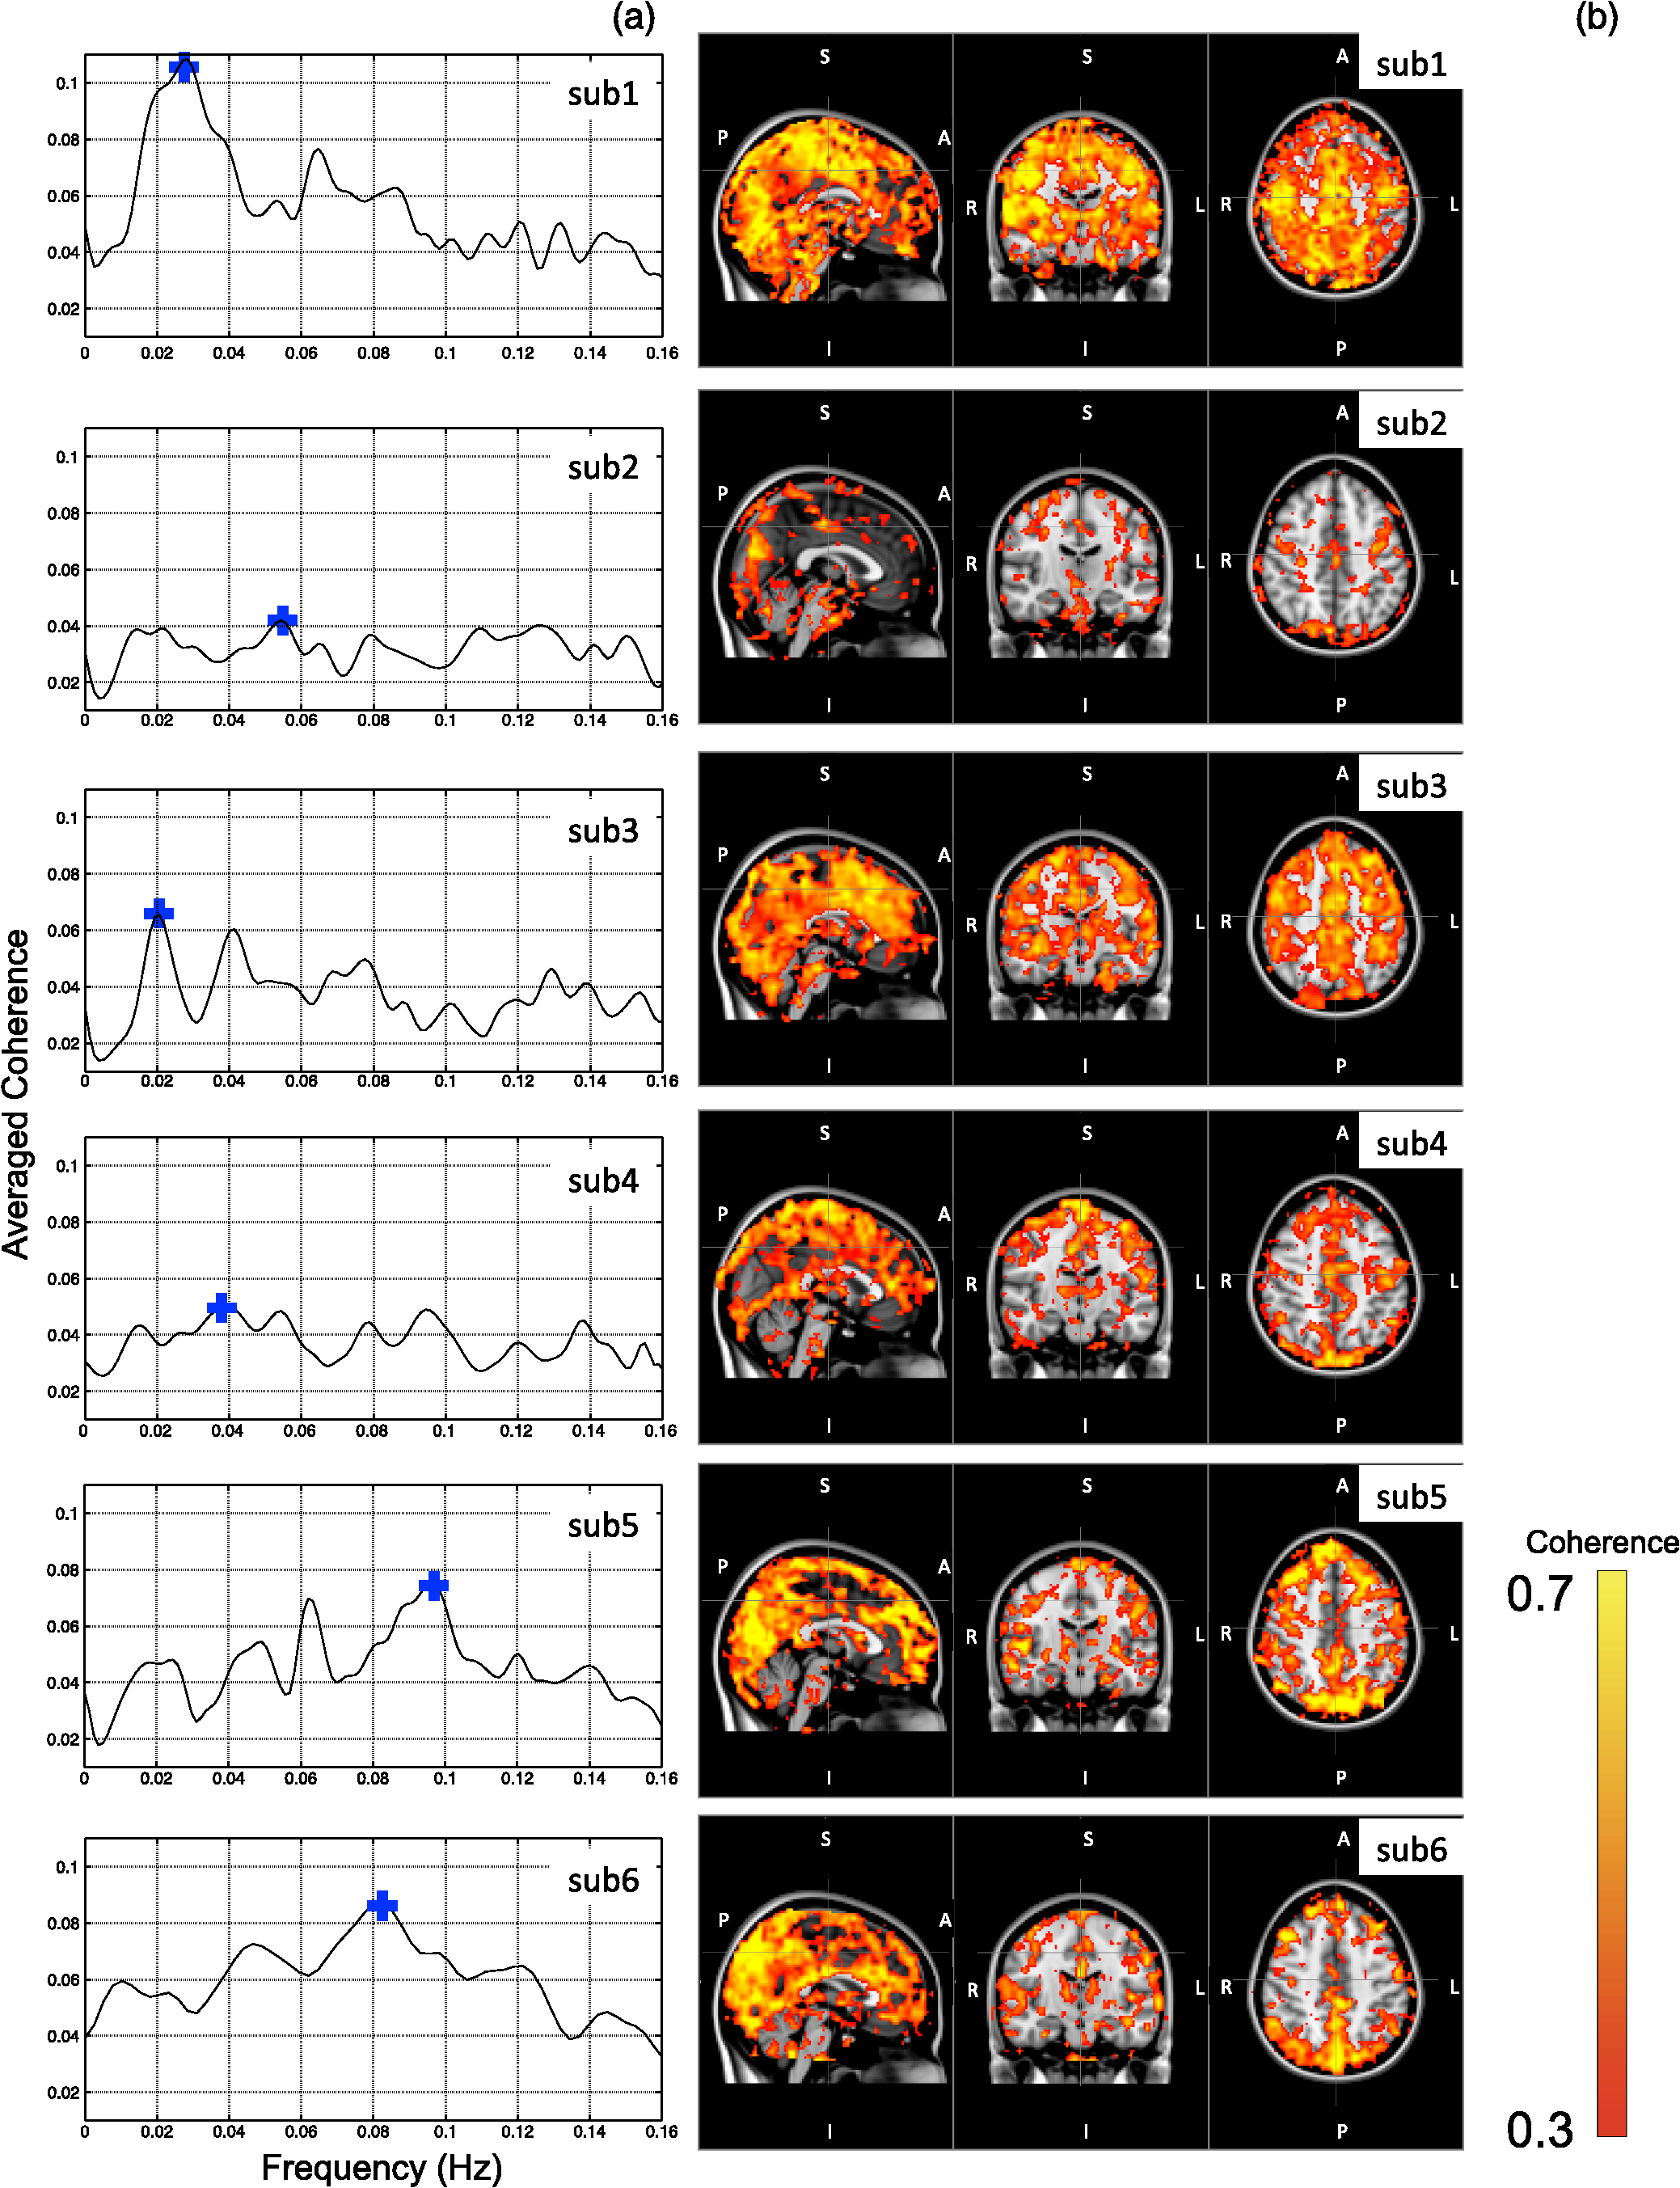 4.DiscussionTo the best of our knowledge, this is the first concurrent NIRS/fMRI study establishing the relationship between the LFO component of BOLD fMRI in the brain and a signal recorded in the periphery with NIRS. The observed LFOs at the peripheral sites (finger and toes) and in the brain, which were independent of cardiac pulsation and respiration, correlated highly with each other when accounting for the specific time lags. Higher correlations and smaller time delays were found between the two toes than those between finger and toe and between finger and brain. The results suggest an endogenous source of contrast for LFOs, which propagates through the entire body with specific time delays at various sites, and thus may potentially be used as a biomarker. The presence of a highly correlated component of the LFO at different peripheral sites, as well as in the brain, demonstrates that this LFO signal is an endogenous source of contrast, propagating throughout the entire body. Furthermore, based on the time shifts between these LFOs, we hypothesize that the source of this LFO is at or before the heart (the common source of the circulation) in the vascular network. In the heart, LFO signals in the blood must be in phase, as all of the blood is mixed in the left ventricle before being pumped out to the body. When the blood exits the heart at the ascending aorta, divergent pathways exist for blood traveling to different locations in the body. The blood to the fingers is routed through the subclavian artery, and blood traveling to the lower limbs is delivered through the descending aorta to the femoral artery. These vascular pathways differ with respect to their length, diameter, and elasticity, which together may render the blood signal less uniform as it travels. For instance, as the blood travels to its specific destination of fingers, toes, or the draining veins of the brain, the frequencies and amplitudes of signals carried by it may be affected differentially by physiological effects resulting from regional circulatory changes, as well as local oxygen demands and vasodilation.42 These effects can account for variations between the signals recorded at the different sites. Because the vasculature in the body is relatively symmetrical, the LFO signals recorded at the two toes are more correlated than those in the finger-toe or finger-brain pairs, and with smaller relative time delays. However, the complicated vascular system of the brain and the complex regional blood changes associated with neuronal activity can be expected to lead to greater variations of the brain LFOs (as shown in Fig. 3) and of the arrival times (as shown in Video 1 as well as in Fig. 3). As shown in Table 1, the average delay between the LFO collected at the fingers and the toes among healthy participants in a resting state was approximately 3.07 s. The variations between individuals likely resulted from differences in height, age, sex, and general cardiac function. Nevertheless, our results suggest that LFO signals with specific time delays may potentially be used as biomarkers for assessing blood flow throughout the body. Such a biomarker could have clinical or research applications in assessing circulatory function. For example, a large discrepancy in the magnitude and/or arrival times of the LFO at two toes (or two fingers) on different sides of the body could indicate peripheral neuropathy in patients with diabetes. Furthermore, we have demonstrated that NIRS provides a robust method to measure these LFOs at multiple peripheral sites. However, Tachtsidis et al.43 demonstrated that LFOs measured by NIRS on the head are posture dependent (shown using the PSD), which we have also observed (data not shown). All concurrent data shown in this manuscript were measured with the participant in a supine position. Further studies on how posture affects the time delays in different body parts measured by NIRS are necessary and will add to the understanding of the nature of LFO. Another observation from the present results is that because the LFO used in RIPTiDe is derived by applying a bandpass filter (0.01 to 0.15 Hz) to the NIRS Δ[tHb], which has been sampled at a relatively high frequency (12.5 Hz), the heartbeat () and respiratory () signals have been fully sampled; therefore there is no aliasing of these signals into the LFO signal. Consequently, the LFOs we identified in the periphery, and those we identified in the brain with BOLD fMRI, are independent of the fluctuations from the cardiac pulsation (measured by pulse oximeter) and respiration (measured by respiration belt), which provides strong counterevidence to the contention that the nonneuronal LFO in BOLD is mainly the aliased signal from cardiac pulsation and respiration. Our study supports the idea that the LFOs arise from undetermined physiological processes,5 rather than experimental acquisition-induced artifacts. It is important to note that this idea does not preclude the possibility that the LFO represents physiological processes indirectly related to cardiac pulsation and respiration. Recent studies have found that hemodynamic response functions of respiratory variations and heart-rate changes can explain significant variance from BOLD signal in gray matter.12,13 We continue to investigate the relationship between these hemodynamic functions and the peripheral LFOs to understand the origin of this systemic signal. Regardless, the present study demonstrates that, irrespective of their function and origin, the physiological LFOs collected at peripheral sites are highly correlated with many BOLD signals in the brain. Finally, our results show that the voxels in the brain that are highly correlated with the peripheral LFO are widespread (as shown in Fig. 4), covering gray matter and draining veins. However, no consistent activations in the brain stem were observed in our study. These data therefore do not offer direct support to the hypothesis that Mayer waves result from an endogenous brainstem or spinal cord oscillation.5 More carefully designed experiments are needed to address the issue. In our previous work, we used NIRS regressors measured at the forehead (with a small source—detector pair separation) simultaneously with fMRI to estimate physiological noise (including the LFO and other physiological processes) and remove it from BOLD fMRI.44 Here we show that a peripherally recorded regressor improves the methodology by offering a number of advantages over a cerebrally acquired regressor. For instance, the LFO signal recorded at the fingertip or toe is a better estimate of the systemic signal, as it measures only the fluctuations propagating throughout the body, rather than reflecting a complex combination of signals comprising scalp signals, cerebral vasculature, and neuronal tissue, which is likely to be affected by local neuronal activity. Additionally, because blood in the fingertips or toes is synchronous within the recording region (being at the end of a limb, they contain only vessels feeding that region) and has very little spread of arrival times and no neural signal contamination, it is arguably more similar to the signal in the aorta. Furthermore, the readily accessible anatomy of the fingertips and toes means that a probe very similar to the standard pulse oximeter used for physiological recording during MR scans can be used to record these signals in the future. The relative ease of implementing such a device would allow this type of denoising to become a standard procedure in laboratories without a dedicated NIRS instrument. Verstynen and Deshpande45 demonstrated recently that it is possible to use a standard pulse oximeter (a simple NIRS device) to account for physiological artifacts caused by breathing and cardiac rhythms. However, based on our current and previous research,9 we have demonstrated that the LFOs are independent physiological signals (not aliased from cardiac pulsation or respiration) that have a profound effect on the interpretation of resting state scans, so they must also be considered independently. Using the RIPTiDe method with the full-bandwidth NIRS waveform, we are able to remove LFOs as well as the physiological signals from cardiac pulsation and breathing.44 From the coherence analysis, we demonstrated that coherence between the peripheral LFO and BOLD fMRI are participant specific, with the frequency of highest coherence below 0.1 Hz. While the spectral energy in the LFO coherence was concentrated in some participants, with a clear peak (at variable frequencies) in others, no frequency was clearly dominant. For this reason, analysis in the time domain provides a more robust measure of the relation between the fingertip and brain signals. Last, the patterns from the coherence map (at the frequency where the average coherence reaches maximum) are similar to the maximum -statistic maps (Fig. 4). This confirms that coherence method and time-domain method are revealing the same physiological correlation between the peripheral and cerebral blood variations. 5.ConclusionsUsing NIRS and fMRI data recorded concurrently during a resting-state scan, we found that a significant fraction of LFOs in many voxels (by BOLD fMRI) is highly correlated with the LFOs collected at fingertip and toe (by NIRS) with varying time shifts. This indicates that the LFOs originate in the periphery and travel with the blood flow to different parts of the body. We have shown that NIRS is capable of monitoring these global LFOs. We posit that the temporal delays and intensity changes between LFOs recorded at different sites could be developed into effective biomarkers for circulatory diseases, such as diabetes. AcknowledgmentsWe thank Dr. Kimberly Lindsey, Dr. Scott Lukas, and Dr. Lisa Nickerson for meaningful discussions about this work, which was supported by the National Institutes of Health, Grants R21 DA027877 (B.deB.F.), R03 DA024220 (S.C.L.), and K01 DA023659 (S.C.L.). ReferencesG. BuzsakiA. Draguhn,
“Neuronal oscillations in cortical networks,”
Science, 304
(5679), 1926
–1929
(2004). http://dx.doi.org/10.1126/science.1099745 SCIEAS 0036-8075 Google Scholar
T. Katuraet al.,
“Quantitative evaluation of interrelations between spontaneous low-frequency oscillations in cerebral hemodynamics and systemic cardiovascular dynamics,”
Neuroimage, 31
(4), 1592
–1600
(2006). http://dx.doi.org/10.1016/j.neuroimage.2006.02.010 NEIMEF 1053-8119 Google Scholar
Z. Liet al.,
“Correlation analysis between prefrontal oxygenation oscillations and cerebral artery hemodynamics in humans,”
Microvasc. Res., 82
(3), 304
–310
(2011). http://dx.doi.org/10.1016/j.mvr.2011.08.004 MIVRA6 0026-2862 Google Scholar
H. Obriget al.,
“Spontaneous low frequency oscillations of cerebral hemodynamics and metabolism in human adults,”
Neuroimage, 12
(6), 623
–639
(2000). http://dx.doi.org/10.1006/nimg.2000.0657 NEIMEF 1053-8119 Google Scholar
A. Sassaroliet al.,
“Low-frequency spontaneous oscillations of cerebral hemodynamics investigated with near-infrared spectroscopy: a review,”
IEEE J. Sel. Top. Quant. Electron., 18
(4), 1478
–1492
(2012). http://dx.doi.org/10.1109/JSTQE.2012.2183581 IJSQEN 1077-260X Google Scholar
X. N. Zuoet al.,
“The oscillating brain: complex and reliable,”
Neuroimage, 49
(2), 1432
–1445
(2010). http://dx.doi.org/10.1016/j.neuroimage.2009.09.037 NEIMEF 1053-8119 Google Scholar
D. P. Auer,
“Spontaneous low-frequency blood oxygenation level-dependent fluctuations and functional connectivity analysis of the ‘resting’ brain,”
Magn. Reson. Imag, 26
(7), 1055
–1064
(2008). http://dx.doi.org/10.1016/j.mri.2008.05.008 MRIMDQ 0730-725X Google Scholar
G. H. GloverT. Q. LiD. Ress,
“Image-based method for retrospective correction of physiological motion effects in fMRI: RETROICOR,”
Magn. Reson. Med., 44
(1), 162
–167
(2000). http://dx.doi.org/10.1002/(ISSN)1522-2594 MRMEEN 0740-3194 Google Scholar
Y. TongL. M. HockeB. Frederick,
“Isolating the sources of widespread physiological fluctuations in functional near-infrared spectroscopy signals,”
J. Biomed. Opt., 16
(10), 106005
(2011). http://dx.doi.org/10.1117/1.3638128 JBOPFO 1083-3668 Google Scholar
Y. TongB. D. Frederick,
“Concurrent fNIRS and fMRI processing allows independent visualization of the propagation of pressure waves and bulk blood flow in the cerebral vasculature,”
Neuroimage, 61
(4), 1419
–1427
(2012). NEIMEF 1053-8119 Google Scholar
C. AalkjaerD. BoedtkjerV. Matchkov,
“Vasomotion—what is currently thought?,”
Acta Physiol. (Oxf.), 202
(3), 253
–269
(2011). http://dx.doi.org/10.1111/apha.2011.202.issue-3 APACAB 0001-6756 Google Scholar
R. M. Birnet al.,
“The respiration response function: the temporal dynamics of fMRI signal fluctuations related to changes in respiration,”
Neuroimage, 40
(2), 644
–654
(2008). http://dx.doi.org/10.1016/j.neuroimage.2007.11.059 NEIMEF 1053-8119 Google Scholar
C. ChangJ. P. CunninghamG. H. Glover,
“Influence of heart rate on the BOLD signal: the cardiac response function,”
Neuroimage, 44
(3), 857
–869
(2009). http://dx.doi.org/10.1016/j.neuroimage.2008.09.029 NEIMEF 1053-8119 Google Scholar
R. M. Birnet al.,
“Separating respiratory-variation-related fluctuations from neuronal-activity-related fluctuations in fMRI,”
Neuroimage, 31
(4), 1536
–1548
(2006). http://dx.doi.org/10.1016/j.neuroimage.2006.02.048 NEIMEF 1053-8119 Google Scholar
M. Fukunagaet al.,
“Metabolic origin of BOLD signal fluctuations in the absence of stimuli,”
J. Cereb. Blood Flow Metab., 28
(7), 1377
–1387
(2008). http://dx.doi.org/10.1038/jcbfm.2008.25 JCBMDN 0271-678X Google Scholar
R. G. Wiseet al.,
“Resting fluctuations in arterial carbon dioxide induce significant low frequency variations in BOLD signal,”
Neuroimage, 21
(4), 1652
–1664
(2004). http://dx.doi.org/10.1016/j.neuroimage.2003.11.025 NEIMEF 1053-8119 Google Scholar
C. Julien,
“The enigma of Mayer waves: facts and models,”
Cardiovasc. Res., 70
(1), 12
–21
(2006). http://dx.doi.org/10.1016/j.cardiores.2005.11.008 CVREAU 0008-6363 Google Scholar
M. D. Papademetriouet al.,
“Multichannel near infrared spectroscopy indicates regional variations in cerebral autoregulation in infants supported on extracorporeal membrane oxygenation,”
J. Biomed. Opt., 17
(6), 067008
(2012). http://dx.doi.org/10.1117/1.JBO.17.6.067008 JBOPFO 1083-3668 Google Scholar
S. J. Payneet al.,
“Effects of arterial blood gas levels on cerebral blood flow and oxygen transport,”
Biomed. Opt. Express, 2
(4), 966
–979
(2011). http://dx.doi.org/10.1364/BOE.2.000966 BOEICL 2156-7085 Google Scholar
R. C. MesquitaM. A. FranceschiniD. A. Boas,
“Resting state functional connectivity of the whole head with near-infrared spectroscopy,”
Biomed. Opt. Express, 1
(1), 324
–336
(2010). http://dx.doi.org/10.1364/BOE.1.000324 BOEICL 2156-7085 Google Scholar
M. VardiA. Nini,
“Near-infrared spectroscopy for evaluation of peripheral vascular disease. A systematic review of literature,”
Eur. J. Vasc. Endovasc. Surg., 35
(1), 68
–74
(2008). http://dx.doi.org/10.1016/j.ejvs.2007.07.015 1078-5884 Google Scholar
M. Munakataet al.,
“Altered Mayer wave and baroreflex profiles in high spinal cord injury,”
Am. J. Hypertens., 14
(2), 141
–148
(2001). http://dx.doi.org/10.1016/S0895-7061(00)01236-X AJHYE6 0895-7061 Google Scholar
A. Rowleyet al.,
“Synchronization between arterial blood pressure and cerebral oxyhaemoglobin concentration investigated by wavelet cross-correlation.,”
Physiol. Meas., 28
(2), 161
–173
(2007). http://dx.doi.org/10.1088/0967-3334/28/2/005 PMEAE3 0967-3334 Google Scholar
T. Kanoet al.,
“Effects of neural blockade and general anesthesia on the laser-Doppler skin blood flow waves recorded from the finger or toe,”
J. Auton. Nerv. Syst., 48
(3), 257
–266
(1994). http://dx.doi.org/10.1016/0165-1838(94)90054-X JASYDS 0165-1838 Google Scholar
T. Kanoet al.,
“Fundamental patterns and characteristics of the laser-Doppler skin blood flow waves recorded from the finger or toe,”
J. Auton. Nerv. Syst., 45
(3), 191
–199
(1993). http://dx.doi.org/10.1016/0165-1838(93)90051-U JASYDS 0165-1838 Google Scholar
J. AllenA. Murray,
“Age-related changes in peripheral pulse timing characteristics at the ears, fingers and toes,”
J. Hum. Hypertens., 16
(10), 711
–717
(2002). http://dx.doi.org/10.1038/sj.jhh.1001478 0950-9240 Google Scholar
G. E. Burch,
“A new sensitive portable plethysmograph,”
Am. Heart J., 33
(1), 48
–75
(1947). http://dx.doi.org/10.1016/0002-8703(47)90424-9 AHJOA2 0002-8703 Google Scholar
A. Burton,
“The range and variability of the blood flow in the human fingers and vasomotor regulation of body temperature,”
Am. J. Physiol., 127
(3), 437
–453
(1939). AJPHAP 0002-9513 Google Scholar
Y. TongK. P. LindseyB. D. Frederick,
“Partitioning of physiological noise signals in the brain with concurrent near-infrared spectroscopy and fMRI,”
J. Cereb. Blood Flow Metab., 31
(12), 2352
–2362
(2011). http://dx.doi.org/10.1038/jcbfm.2011.100 JCBMDN 0271-678X Google Scholar
Y. TongP. R. BergethonB. D. Frederick,
“An improved method for mapping cerebrovascular reserve using concurrent fMRI and near-infrared spectroscopy with Regressor Interpolation at Progressive Time Delays (RIPTiDe),”
Neuroimage, 56
(4), 2047
–2057
(2011). http://dx.doi.org/10.1016/j.neuroimage.2011.03.071 NEIMEF 1053-8119 Google Scholar
Y. TongB. D. Frederick,
“Time lag dependent multimodal processing of concurrent fMRI and near-infrared spectroscopy (NIRS) data suggests a global circulatory origin for low-frequency oscillation signals in human brain,”
Neuroimage, 53
(2), 553
–564
(2010). http://dx.doi.org/10.1016/j.neuroimage.2010.06.049 NEIMEF 1053-8119 Google Scholar
D. T. Delpyet al.,
“Estimation of optical pathlength through tissue from direct time of flight measurement,”
Phys. Med. Biol., 33
(12), 1433
–1442
(1988). http://dx.doi.org/10.1088/0031-9155/33/12/008 PHMBA7 0031-9155 Google Scholar
L. KocsisP. HermanA. Eke,
“The modified Beer-Lambert law revisited,”
Phys. Med. Biol., 51
(5), N91
–N98
(2006). http://dx.doi.org/10.1088/0031-9155/51/5/N02 PHMBA7 0031-9155 Google Scholar
A. Duncanet al.,
“Optical pathlength measurements on adult head, calf and forearm and the head of the newborn infant using phase resolved optical spectroscopy,”
Phys. Med. Biol., 40
(2), 295
–304
(1995). http://dx.doi.org/10.1088/0031-9155/40/2/007 PHMBA7 0031-9155 Google Scholar
R. B. BuxtonE. C. WongL. R. Frank,
“Dynamics of blood flow and oxygenation changes during brain activation: the balloon model,”
Magn. Reson. Med., 39
(6), 855
–864
(1998). http://dx.doi.org/10.1002/(ISSN)1522-2594 MRMEEN 0740-3194 Google Scholar
Y. HoshiN. KobayashiM. Tamura,
“Interpretation of near-infrared spectroscopy signals: a study with a newly developed perfused rat brain model,”
J. Appl. Physiol., 90
(5), 1657
–1662
(2001). JAPYAA 0021-8987 Google Scholar
S. M. Smithet al.,
“Advances in functional and structural MR image analysis and implementation as FSL,”
Neuroimage, 23
(Suppl. 1), S208
–S219
(2004). http://dx.doi.org/10.1016/j.neuroimage.2004.07.051 NEIMEF 1053-8119 Google Scholar
L. ZhangX. Wu,
“On cross correlation based discrete time delay estimation,”
in Acoustics, Speech, and Signal Processing, 2005, Proceedings. (ICASSP ’05). IEEE International Conf.,
iv/981
–iv/984
(2005). Google Scholar
N. MoriT. SuzukiS. Kakuno,
“Noise of acoustic Doppler velocimeter data in bubbly flow,”
J. Eng. Mech., 133
(1), 122
–125
(2007). http://dx.doi.org/10.1061/(ASCE)0733-9399(2007)133:1(122) JENMDT 0733-9399 Google Scholar
K. LossiusM. Eriksen,
“Spontaneous flow waves detected by laser Doppler in human skin,”
Microvasc. Res., 50
(1), 94
–104
(1995). http://dx.doi.org/10.1006/mvre.1995.1041 MIVRA6 0026-2862 Google Scholar
A. C. Evanset al.,
“3D statistical neuroanatomical models from 305 MRI volumes,”
in IEEE-Nuclear Science Symposium and Medical Imaging Conf.,
1813
–1817
(1993). Google Scholar
A. C. GuytonJ. E. Hall, Textbook of Medical Physiology, 129
–139 9th ed.W. B. Saunders, Philadelphia, PA
(1996). Google Scholar
I. Tachtsidiset al.,
“Investigation of cerebral haemodynamics by near-infrared spectroscopy in young healthy volunteers reveals posture-dependent spontaneous oscillations,”
Physiol. Meas., 25
(2), 437
–445
(2004). http://dx.doi.org/10.1088/0967-3334/25/2/003 PMEAE3 0967-3334 Google Scholar
B. FrederickL. D. NickersonY. Tong,
“Physiological denoising of BOLD fMRI data using regressor interpolation at progressive time delays (RIPTiDe) processing of concurrent fMRI and near-infrared spectroscopy (NIRS).,”
Neuroimage, 60
(3), 1913
–1923
(2012). http://dx.doi.org/10.1016/j.neuroimage.2012.01.140 NEIMEF 1053-8119 Google Scholar
T. D. VerstynenV. Deshpande,
“Using pulse oximetry to account for high and low frequency physiological artifacts in the BOLD signal,”
Neuroimage, 55
(4), 1633
–1644
(2011). http://dx.doi.org/10.1016/j.neuroimage.2010.11.090 NEIMEF 1053-8119 Google Scholar
|