

|
|
1.IntroductionCoronary heart disease is the leading cause of death in the western societies.1 The onset of atherosclerosis does not always lead to clinical symptoms, as luminal narrowing is not always present. The current diagnostic tools such as fluoroscopy or intravascular ultrasound (IVUS) rely on anatomical information and are focused mostly on stenosis, causing stable angina. Acute coronary events linked to disruption of the coronary plaque are hard to predict as clinically available tools do not give comprehensive information about plaque vulnerability.2–4 Providing interventional cardiologists an effective tool to detect simultaneously plaque anatomic/morphology, biochemical, and functional features would allow them to better assess the complex features of the atherosclerotic plaques and their risk of rupture. Autofluorescence spectroscopy has been used to determine molecular composition of tissue5,6 and has shown potential for the characterization and staging of human atherosclerotic plaque.7,8 More specifically, the use of time-resolved fluorescence spectroscopy (TRFS) techniques can provide additional diagnostic information. The excited-state fluorescence lifetime(s) can be used in addition to fluorescence intensity or spectrum to enhance the analysis of tissue composition as it can improve the specificity of the fluorescence measurement.5,6 TRFS is suitable for intravascular applications as the excitation light delivery and fluorescence collection in such systems can be achieved via a single optical fiber.7–10 Moreover, a new implementation of a point-spectroscopy TRFS technique recently reported11 has demonstrated feasibility for continuous and simultaneous recording of time-resolved fluorescence data in multiple spectral bands. Such implementation enables formation of spectroscopic images of the interrogated tissue, i.e., reconstruction of fluorescence lifetime imaging (FLIm) multispectral maps. The penetration depth of the ultraviolet (UV) excitation light (e.g., 337 nm) is well matched to the study of the composition of the superficial layers of the atherosclerotic intima within 200 to 250 μm depth as it prevents spectral interference with tissues located behind the investigated region. One of the current challenges in diagnosis of clinically relevant plaques is the lack of tools capable of evaluating the composition of plaques with thin fibrotic cap. For example, one of the most common plaques with a high risk of rupture is the thin cap fibrotheroma with a cap thickness of less than 65 μm. High-resolution () IVUS technology is currently implemented in commercial systems12,13 and is routinely used in clinical practice. Generally, this consists of a single-element transducer that generates cross-sectional images of the vessel wall and surrounding tissues by simultaneously rotating and pulling back the transducer along the area of interest. High-resolution IVUS provides detailed anatomical or morphologic features where the spatial resolution depends on the central frequency of the transducer. This is typically 50 to 100 μm for commercial systems equipped with single element 40 MHz transducers.12 In addition to providing anatomical images, IVUS can be used to perform virtual histology (VH). In this case, a spectral analysis is performed on the ultrasound backscatter signal and that allows for identification of distinct compositions of the atherosclerotic tissue.12,14,15 The overall objective of this study is to develop an intravascular multifunction rotational catheter allowing the simultaneous assessment of biochemical composition and morphologic features of the arterial wall by combining FLIm and IVUS techniques. Such catheter system is expected to provide a more effective means for the characterization of arterial wall pathologies. The current study extends on our previous work that demonstrated the potential use of TRFS combined with IVUS to obtain complementary information using a fixed orientation multimodal catheter16 and the ability of scanning-TRFS to reconstruct FLIm images of luminal surfaces.11 A critical issue in bringing TRFS systems closer to clinical application, concerns the ability of the system to acquire robust TRFS data in intraluminal setting radially and continuously from the vessel wall in blood flow similarly and simultaneously with IVUS. Such constraints require the development of a rotational system for the TRFS fiber optic probe along with a blood flushing system to clear the optical field of view. The latter constraint is due to a requirement of the TRFS probe to operate in the 335 to 630 nm range corresponding to the arterial autofluorescence excitation-emission wavelengths, therefore sensitive to hemoglobin absorption.16 Here, we describe how these functions were implemented into a prototype catheter and tested in arterial phantoms. Moreover, we show that TRFS data acquired radially and continuously from the vessel under IVUS guidance allows for reconstruction of FLIm maps of the arterial wall. Also, we demonstrate that in addition to providing structural features of the arterial vessels, the information retrieved from IVUS can be used to correct for changes in distance between the tip of the fiber optic and arterial wall and localization of distinct fluorescent features located in the luminal surface of the vessel wall. 2.Multimodal Catheter Design and ComponentsThe multimodal catheter comprises three main subsystems: IVUS, point-spectroscopy scanning-TRFS or FLIm, and flushing. These are depicted in Fig. 1. The IVUS subsystem is composed of a modified commercially available IVUS catheter system, including a motor drive and a dedicated acquisition system. The scanning-TRFS subsystem is constituted of a fiber optic inserted into the IVUS catheter, rotated by a dedicated motor drive and coupled to the TRFS data acquisition module. Finally, the flushing subsystem pumping a solution through the catheter is designed to clear the blood in the fiber optic field of view. Fig. 1Scanning-TRFS and IVUS in parallel setup. (a) Schematic view of the overall system design components including a pulsed nitrogen laser (337 nm emission, 700 ps pulse width, 30 Hz repetition rate). The wavelength selection module included four wavelength bands (center frequency/bandwidth): , , and . Each spectral band was connected to distinct fiber optics in the delay fiber coil and further coupled to the detector (MCP-PMT). (b) Schematic of the catheter tip including the side-viewing fiberoptic (400 μm—core diameter) and the single element ultasound transducer. (c) Picture of catheter tip.  2.1.IVUS ImagingUltrasound data were acquired by means of a commercial IVUS system (iLab, Boston Scientific, MA) and a 3 Fr (1 mm), 40 MHz transducer imaging catheter (Atlantis SR Pro, Boston Scientific, MA). The system is composed of motor-drive providing rotation and a signal interface to a catheter on one side. It is linked to a console, itself connected to a laptop for image visualization. The catheter itself is composed of a 660 μm diameter distal housing that supports the 40 MHz single element transducer. This housing is rotated at 1800 rpm by mean of a counter wound coil connected to the motor-drive via a connecting hub. This hub also allows ultrasound radio frequency (RF) data to be transmitted between the motor drive and the transducer, via a coaxial cable located within the counter wound coil. For the commercial catheter, the rotating assembly is housed within a 3 Fr sheath, which is compact enough to image vessels down to nearly 1 mm diameter. For this project, the original sheath was replaced by an 8 Fr (2.6 mm) dual lumen sheath that allowed space for optical components integration. The IVUS information was displayed in real time during acquisitions to localize areas of interest. The data was also saved, exported and processed using Matlab (The MathWorks Inc, Natick, MA) for further use in combination with FLIm as explained below. 2.2.Scanning-TRFS for Intravascular FLImThe multispectral TRFS technique used in this study was detailed elsewhere.9,10 In brief, this is composed of a nitrogen pulsed laser (MNL 205, LTB Lasertechnik Berlin, Germany) emitting 700 ps pulses at 337 nm with a repetition rate of 30 Hz. The energy of incident light is kept at (fluence of for a 400 µm diameter beam, below the ANSI limit for maximum permissible exposure of UV light).11 The light is sent to the sample via a single UV-grade silica/silica fiber optic of 400 μm core (FVP400440480, Polymicro, Phoenix, AZ). The tissue autofluorescence is collected by the same fiber and delivered to a series of 45-deg dichroic beam splitters and band-pass filters (Semrock, Rochester, NY) so that the light is spectrally resolved into four subbands (channels) with respective central wavelength/bandwidth of (channel 1), (channel 2), (channel 3), and (channel 4). The signal is then coupled into four fibers with varying lengths of 1, 10, 19, and 28 m that act as time-delay lines. The proximal ends of the fibers are coupled to a multichannel plate photomultiplier (MCP-PMT, R5916U-50, Hamamatsu, Bridgewater, NJ) with a rise time of 180 ps. The electronic signals from the MCP-PMT are amplified by a preamplifier (C5594, 1.5 GHz bandwidth, Hamamatsu, Japan) and recorded by a digital oscilloscope (DPO7254, 2.5 GHz bandwidth, 20 GHz sampling rate, Tektronix Inc., Richardson, TX). The Fast Frame segmented memory feature of the oscilloscope was used, allowing the acquisition of up to 7000 frames with 4000 samples/frame. In this configuration, the acquisition is completed in less than 200 ns after one pulse from the excitation laser. For this project, the optical fiber used for delivery and collection was terminated by an angled polishing and a 200 nm-thick aluminum coating to deflect the optical beam at a determined angle from the fiber axis. This fiber was coupled to the wavelengths bandwidth selection module via a custom UV compatible fiber optic rotary joint (Doric Lenses, Quebec, Canada), rotated by a brushless motor with an integrated controller (Maxon MCD EPOS, Sachseln, Switzerland). The optical fiber was introduced into the second lumen of the modified IVUS catheter [Fig. 1(b)]. By realizing a helical scan of the wall, simultaneously rotating the fiber and pulling back the catheter into the vessel, the fluorescence data can be acquired dynamically for the four different wavelength bands simultaneously. Thus in this configuration, the TRFS helical scan enables rapid acquisition of multispectral FLIm images from the luminal surface. The beam exiting the fiber is not collimated, which means that the interrogated area varies with the fiber-to-tissue distance. The influence of the fiber-to-tissue distance on the acquired data has been reported in our earlier publication.11 The signal of the fluorescence decays recorded for each of the four channels was analyzed to generate the two-dimensional (2-D) fluorescence intensity and lifetime images for each channel. Images are acquired by scanning the area of interest with the optical beam. Based on the acquisition frequency and scanning parameters, a given spatial sampling is obtained, which defines the size of the pixels in the image. For the intensity image of a given channel, the intensity value of each pixel was computed by integrating over time the fluorescence decay measured for this channel at a given location. On the FLIm image, the fluorescence impulse response function (fIRF) for each pixel in the image was determined using a fast least-square numerical deconvolution technique based on the Laguerre basis of functions expansion as previously reported.11 The measured fluorescence pulse transient represents a convolution of the fIRF with the instrument impulse response function (iIRF) experimentally determined. The average lifetime value at each pixel in the image was calculated as the mean decay time of the deconvolved fluorescence decay function measured at this location. This enabled accurate and fast lifetime mapping without a priori assumption of the functional form of the fluorescence decay.17 Data processing was carried out using Matlab. 2.3.FlushingScanning-TRFS operates in a broad spectral range between 337 nm (excitation wavelength) and 655 nm. Over this range, the extinction coefficient of blood hemoglobin is very high (up to in the wavelength bands of interest18). To allow for in vivo imaging in future intravascular application, the blood has to be removed from the field of view. A new method for blood flushing, that obviates the need for balloon occlusion or bolus injection, was tested in this study. This consists of the use of a narrow jet of transparent flushing solution (described below) to clear the field of view. The solution is channeled through the catheter lumen containing the fiber and aimed at the optical imaging region by a specialized tip mounted onto the fiber [as shown in Fig. 1(b) and 1(c)], allowing for synchronized rotation of the jet with the optical beam. The tip was built from a 17 gauge polyimide tube closed at the distal end that was attached to the fiber with hot melt glue (3792 LM, 3M, Maplewood, MN) providing a side hole aligned with the beam location. The flushing concept adapted for this study was initially evaluated through a computational fluid dynamics (CFD) study reported separately.19 This study, done using the commercial code FLUENT v12.1 (ANSYS, Canonsburg, PA) and based on an unstructured tetrahedral mesh created with ICEM CFD v12.1 (ANSYS), provided qualitative information about the flow behavior in 3 and 6 mm diameter vessels. The 3 mm diameter corresponds to the minimum diameter of vessels the system can be introduced in, whereas 6 mm is a typical diameter for peripheral arteries, and this represents a more demanding case for flushing (longer fiber-to-vessel distance). As it can be observed in Fig. 2 for a 6 mm diameter vessel using saline solution for flushing, the jet is not exactly normal to the catheter axis. The CFD study also showed that the jet angle is stable for the whole range of flushing solution and blood flow rates used in this study. For a given tube size, the angle is determined primarily by the side hole diameter (the smaller the hole, the closer the jet angle to the catheter axis normal). A 0.019 in. side hole was adopted as it corresponds to the smallest opening that will not clip the optical beam. This leads to a jet angle of 79-deg with respect to the fiber axis. The fiber distal end was polished with a 50.5-deg angle to obtain an optical beam angle of 79-deg with respect to the fiber axis that could therefore be aligned with the jet. Fig. 2Schematic view of the flushing model experimentally implemented in this study. (a) Axial cross-section and (b) lateral cross section through the flushing jet. The views depict the computational fluid dynamics (CFD) analysis results reported separately15 showing the phase mix between saline solution in blue and blood, in red. This model was based on a finite volume method applied to solve governing equations and boundary conditions. 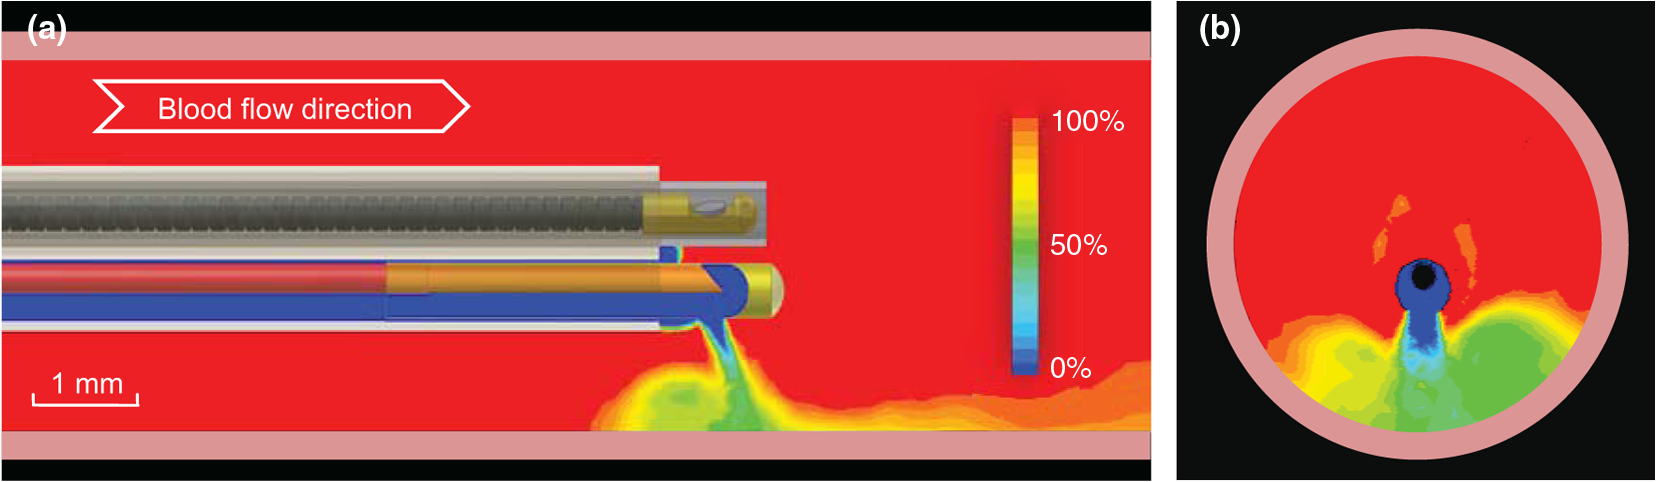 Limiting the mixing between the jet and the surrounding blood was achieved by using a higher viscosity fluid as the flushing solution. The mixing, causing a drop in measured signal, is caused by turbulence in the flow. The extent of turbulence in the flow was characterized by the Reynolds number (a measure of the ratio of inertial forces to viscous forces).20 A higher Reynolds number is associated with turbulent flow while a lower number predicts a laminar flow. The Reynolds number (Re) depends on the density of the fluid , the mean velocity , a characteristic linear dimension of the problem , and the dynamic viscosity of the fluid : As can be seen in the Reynolds number formula [Eq. (1)], an increase of fluid viscosity will lead to a lower value and therefore limit mixing. The requirements for the flushing solution outside of a high viscosity are that it can be used safely in a patient at the dose required for flushing, offers a good transmission over the wavelength range of interest and is not fluorescent. An obvious choice is fluoroscopy contrast agent (Visipaque 320, GE Healthcare Canada Inc., Mississauga, ON, Canada). For this work, we replaced this contrast agent with a 60 wt.% glycerol aqueous solution that is readily available, fits the optical properties requirements and has the same viscosity at room temperature as Visipaque 320 at 37 °C (11.8 cps) allowing for better modeling of in vivo behavior without the need of a temperature controlled test bench. The hydraulic circuit pumping the flushing solution was composed of two compact peristaltic pumps (WP-1000, WELCO Co. Ltd., Tokyo, Japan) mounted in a series followed by a low pass hydraulic filter. This filter was composed of a 4 mL air accumulator and an adjustable restriction effectively limiting the flow oscillations inherent to the peristaltic pumps. The fiber port on the proximal end of the catheter was made watertight by an adjustable Tuohy Borst Adapter (FLO , Qosina, Edgewood, NY, USA). 3.Catheter ValidationSeveral tests were conducted to verify whether the catheter complied with the design objectives. These tests covered mechanical aspects including the ability to rotate the beam uniformly, optical aspects concerning basic image characterization, and hydraulic aspects including testing the efficiency of the flushing system in a blood-like environment. In addition, the ability of the system to perform IVUS and FLIm coregistration was evaluated on a bimodal tissue phantom. 3.1.Mechanical EvaluationRotation of the catheter requires a rotational torque applied at the proximal end of the fiber by a motor drive. This is expected to generate a counter-acting drag torque caused by frictions between the rotating parts and the sheath along the whole fiber, with a notable contribution of the distal end housing. In turn, this will cause a certain amount of torsion of the drive shaft. Generally, the variations of the drag torque between the fiber assembly and the sheath are created by external constrains such as decreased bending radius of the catheter, variations of the friction coefficient itself (stick-slip phenomenon), or dynamic effects due to imbalance of the rotating parts.13 This variation can prevent a regular rotation of the fiber tip. This effect, called nonuniform rotational distortion (NURD), is well known for IVUS and leads to image artifacts. To test the presence of NURD, the fiber was rotated inside the catheter at different rotation speeds (30 to 300 rpm) and for different catheter bending radii down to the minimal recommended bending radius of the fiber (30 mm) while simultaneously imaging the tip with a camera (UI-1440 C, IDS Imaging, Obersulm, Germany). We verified that no significant () variation of rotation frequency of the tip could be observed. This suggested that the 400 μm fiber used in this study can be directly rotated by the motor-drive and does not need any additional mechanical support, such as the external counter wound coil typically implemented in IVUS systems. 3.2.Evaluation of the FLIm ComponentAs noted above, the FLIm images are acquired by combining fiber rotation and pullback of the catheter (helical scan). The characteristics of the acquired image were linked to the following parameters: (a) the pixel size in the axial direction that is dependent on the pull-back speed, acquisition frequency and rotation speed, and (b) the pixel size in the transaxial direction that is dependent on rotation speed, laser repetition rate, and the fiber optic tip to target distance. The pixel size values obtained for various rotation/pull back speeds can be observed in a nomogram depicted in Fig. 3. For example, a rotation speed of 10 rpm and pull back speed of (red dot on Fig. 3) in a 6 mm lumen diameter leads to an axial pixel size of 60 μm and a transaxial pixel size of 105 μm for a fiber located at the center of the lumen. If the fiber is not centered in the vessel, the axial pixel size remains the same while transaxial pixel size is obtained by multiplying the value available in the nomogram by the ratio between the center of the fiber-to-tissue distance and the vessel radius. In this case, the fiber-to-wall distance varies over the field of view, thus affecting transaxial pixel size. Fig. 3Nomogram showing the relationship between pixel size in axial and transaxial direction for a 6 mm diameter vessel and a 30 Hz acquisition frequency at different fiberoptic rotation and pull-back speeds. This nomogram is generated assuming the fiber is centered in the lumen.  In order to test and characterize the capability of the system for acquiring FLIm images, the first series of tests were run in water circulated within a tubular structure [Fig. 4(a)]. The catheter was inserted in an acrylic tubular phantom in which capillary tubes containing different types of dyes (fluorescein isothiocyanate (FITC), 12 mM in PBS, 540 nm peak emission, 9-cyanoanthracene (9CA), 2 mM in ethanol, 445 nm peak emission and Coumarin 120, 1 mM in methanol, and 430 nm peak emission) were positioned radially. The 6 mm lumen was chosen for this test to keep a narrow angle between the different tubes, of 20 deg and 30-deg, respectively. The fluorescence of these dyes was spectrally resolved in channels 1 (C120), 2 (C120, 9CA, FITC), and 3 (FITC). Figure 4(b) and 4(c) acquired at a rotation speed of 10 rpm and pull back speed of depict representative intensity and lifetime images obtained for channel 2 (430 to 475 nm), where all dyes presented fluorescence emission (spectral overlap). FITC and 9CA fluorescence were well distinguished from the background fluorescence of the acrylic tubular structure in both intensity and lifetime images and could be easily separated from each other on the lifetime image. Coumarin 120 could not be distinguished from background in the intensity image, whereas it was clearly visible in the lifetime image. Its lifetime is similar to FITC but both were easily separated by looking at channels 1 and 3. In the lifetime image, mean lifetime value and standard deviation were computed for each dye based on the lifetime value of each pixel in the corresponding area. The values obtained for each of the three dyes are very close to values reported in the literature,21–23 at for C120, for 9CA, and for FITC, respectively. This showed the ability of the current system to successfully measure lifetime, use this information to resolve different fluorophores and recover their location. Fig. 4(a) Schematic of the experimental setup for demonstrating the ability of the scanning-TRFS system to spectrally, temporarily, axially and angularly resolve, in one helical scan, distinct fluorescent structures located on the lumen surface. The catheter is introduced into an acrylic phantom supporting capillary tubes filled with distinct types of fluorescent dyes. (b) Example of the fluorescence signal amplitude depicted here for channel 2 (430 to 475 nm), where the emission spectra of the three dyes overlaps, and (c) corresponding fluorescence average lifetime (FLIm).  3.3.Evaluation of the Fluid Dynamics ComponentThe efficency of the flushing was evaluated by testing in a 3 mm inner diameter tubular phantom the ability of the scanning-TRFS system to generate FLIm data in blood mimicking medium [Fig. 5(a)]. The phantom was built using white Delrin (Quadrant AG, Zurich, Switzerland). Fig. 5(a) Picture of the experimental setup for demonstrating the flushing efficiency. This depicts the Delrin phantom with circulation system, including a hydraulic damper; (b) intensity of the signal acquired in channel 2 (430 to 475 nm). The signal amplitude was measured over a full rotation for (b) the absorbing (mimicking blood) fluid circulation at two distinct speeds (c) for three distinct fiberoptic rotation speeds.  At the wavelengths of interest ranging between 337 and 630 nm, the absorption in blood is predominant over scattering, therefore blood was modeled with a diluted indian ink solution.24 An ink concentration of 16.5% was chosen to model the blood absorbance obtained for the arterial wall excitation wavelength, 337 and a 415 nm collection wavelength. The 415 nm wavelength was chosen as the collection wavelength because in the system’s wavelength band, this wavelength corresponds to the hemoglobin absorption maximum. Therefore, this represents a very conservative case that should insure that these results translate easily to an in vivo environment. The ink solution was circulated in the phantom [Fig. 5(a)] by means of a peristaltic pump (Model 700043, Intramed). Flow oscillations were reduced by a low pass hydraulic filter composed of a 45 mL air accumulator and an adjustable restriction. The catheter was introduced in the test section through a connector and a custom teflon (PTFE Heat Shrink Tubing, Zeus, Vacaville, CA) dynamic lip seal to allow for a watertight junction while preventing unwanted compression of the catheter sheath. The fluorescence signal from the phantom wall was first acquired by rotating the fiber at 20 rpm while circulating water to obtain a baseline. The signal was then acquired in circulating ink solution (flow between 2.3 and ) with a flushing flow to evaluate the sensitivity of the flushing to the surrounding flow. The higher value was chosen to simulate image acquisition in the area of a 6 mm diameter peripheral artery,25 whereas the lower value corresponds to blood flow at rest in the proximal section of coronary arteries ( rest flow, for a 300 g heart, evenly divided between left and right coronary arteries).26 The data presented were obtained by averaging the data acquired during 16 s (500 frames at 30 Hz). As can be seen in Fig. 5(b), most of the phantom wall can be imaged with signal values similar to those obtained in water. Because of the geometry of the catheter (off-center fiber optic), the fiber-to-wall distance varies over a turn, leading to a sector with no signal. The angular extension of this shadowed sector decreases with circulation flow, meaning that as expected, the flushing is more efficient when the flow rate of the ink solution circulation is low. The influence of catheter rotation speed on flushing efficiency was also tested. As seen in Fig. 5(c) the sector of the phantom from which a signal can be retrieved is the same for each tested rotation speed, meaning that the flushing efficiency is not impacted by the rotation speed in the range of study. It can be noted that there is less variation of intensity at higher rotation speeds. This is due to the higher number of turns acquired during the 16 s acquisition time that allows more measurements to be averaged for each angular position. 3.4.Bimodal IVUS and FLIm System Validation3.4.1.Evaluation in a bimodal physical phantomIn future intravascular applications, the IVUS component of the bimodal tehnique described here is anticipated to have a dual role, i.e., to guide the fluorescence imaging procedure and to recognize structural features in the arterial wall. In this study, these two functional features were evaluated with a bimodal tubular phantom (3 mm inner diameter, 15 mm outer diameter) made of low density polyethylene. The phantom was designed to accommodate three equally spaced 1 mm diameter radial holes [Fig. 6(a)] that were separated from the central lumen by 0.2 mm. These holes were filled with fluorescent dyes (Coumarin 1, Coumarin 120, and Rhodamine B) serving as distinct fluorescent targets in the lumen. In addition, the low density polyethylene (specifically chosen for constructing the phantom for this test) is characterized by a low impedance (1.7 Mrayl) and attenuation ( at 5 MHz), thus allowing the bottom of the radial holes to be visible on ultrasound images. This material also presents no significant fluorescence and a good optical transmission which allowed the dyes to be imaged through the material. This configuration permitted a direct coregistration of the fluorescence and ultrasonic images. Fig. 6IVUS—FLIm coregistration: Evaluation in a physical phantom. (a) Schematic of the multimodal tubular phantom; (b) experimental results depicting the IVUS image fused with intensity thresholded lifetime image for channel 2 (430 to 475 nm). It can be observed that the target holes providing ultrasound contrast are coregistered with the fluorescent targets. Note: the top of the IVUS image has been cropped for easier visualization of the optical and ultrasonic targets in the image. 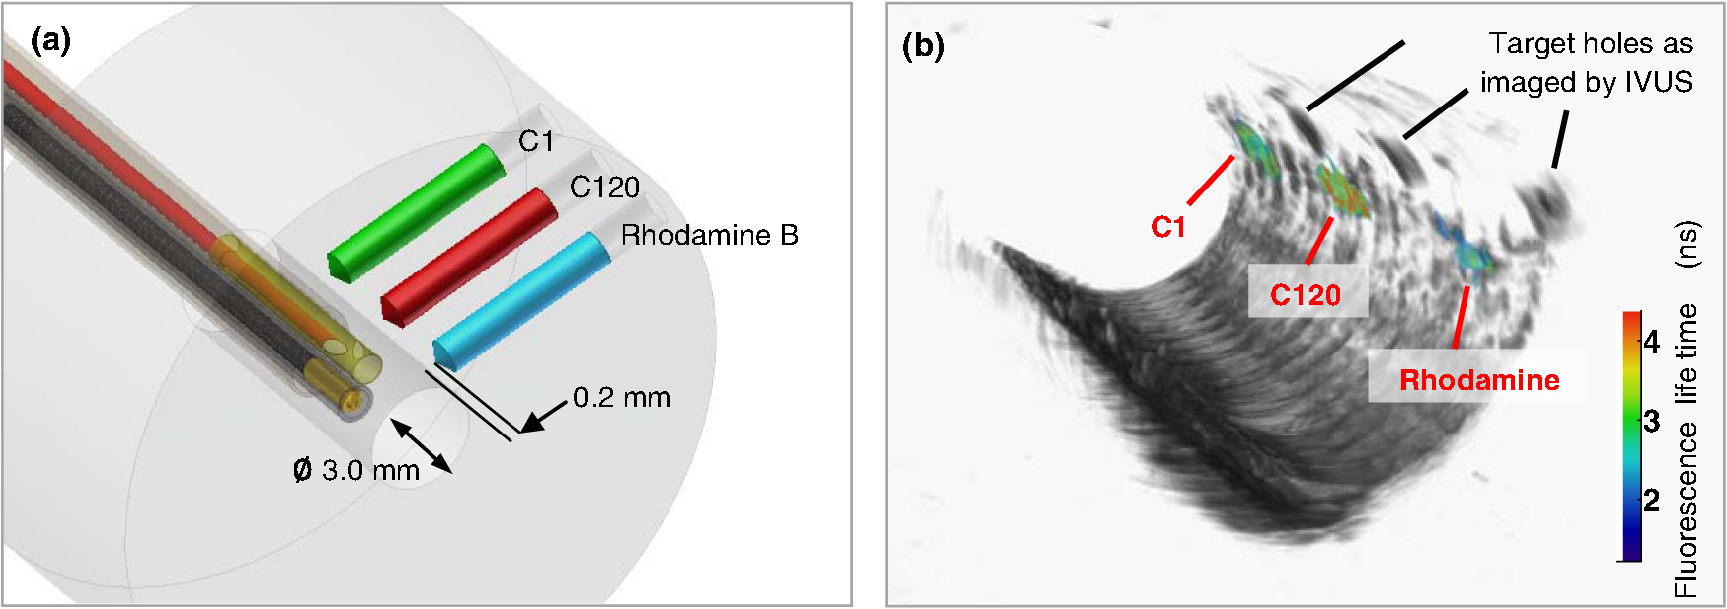 The bimodal acquisition has been realized in the following way: first, during a scouting phase, the IVUS was run continuously and displayed a real time image of the phantom cross section. In this phase, the catheter was displaced manually in order to identify the area of interest. Once the area was identified, the catheter was positioned at the starting point of the section selected for imaging with both modalities and attached to a motorized pull-back device. Then, the pull-back device, the IVUS acquisition, and the scanning-TRFS acquisition were started in a synchronized way. Two sets of results were obtained from this acquisition sequence: (a) a three-dimensional (3-D) ultrasound image and (b) for each spectral band of the scanning-TRFS system a 2-D fluorescence intensity and a 2-D fluorescence lifetime image. As both optical and ultrasonic images were obtained by helical scanning, the images need to be fused and axially and angularly aligned. The axial alignment is straigthforward as IVUS and FLIm systems share the same imaging plane [Fig. 1(b) and 1(c)]. The beginning of each acquisition was synchronized, so that in one pull-back sequence the same section/length of the vessel was imaged with both modalities i.e., IVUS and FLIm. The angular alignment requires the angular position of each modality to be recorded with respect to the catheter sheath. To address this, instead of mounting angular encoders on both ultrasound and TRFS rotating parts, we use information available in the images. As can be seen in Fig. 4(b), the IVUS tip is visible in the fluorescence image. In a similar way, the fiberoptic tip can be seen on the IVUS image. This allows both IVUS and FLIm to be angularly aligned. To accurately coregister IVUS and FLIm information, for each IVUS frame the vessel wall was segmented. Then, for each pixel of the vessel wall, the corresponding viewing angle for FLIm was computed using the position of the pixel, the center of the IVUS image and the center of the fiber, as recovered from the IVUS image. This step was necessary because FLIm and IVUS do not share the same angle of rotation and therefore have a different viewing angle of a given point of the vessel wall. Once the FLIm viewing angle is determined, the lifetime or intensity value at this point can be retrieved from the 2-D FLIm images. A fused image was created by applying a threshold to the intensity image to recover areas of sufficient intensity and projecting as described above the corresponding areas in the lifetime image onto the vessel lumen surface. The image obtained in channel 2 (430 to 475 nm) of the scanning-TRFS system is given in Fig. 6(b). This channel allowed for the visualization of C1, C120, and FITC. The three wells containing the dye were visible in the ultrasound image since the bottom of the wells creates backscattered signal, as well as in the FLIm image because of the fluorescence signal provided by the dyes. This proves that the system allows for coregistration or mapping of the FLIm image on the IVUS image. 3.4.2.Evaluation in a hybrid (physical and biological) tissue phantomA hybrid tissue phantom was designed to study the ability of the rotational system to resolve 1. specific structural features located on the luminal surface (e.g., fluorescent targets, coronary stent) from the arterial wall background and 2. to determine whether the scanning-TRFS system is sensitive enough to detect and time-resolve the autofluorescence emission of a coronary artery tissue sample. For this test, coumarin-based beads ( diameter) with a lifetime of simulating a short lifetime lipid-rich plaque9 were made by mixing this fluorescent dye with UV curable optical cement (NOA88, Norland, Cranbury, NJ) and polymerizing this mixture onto a copper support wire. The beads were then mounted onto a stent, itself mounted on a balloon catheter [Fig. 7(a)]. The stent was deployed in a pig coronary artery [Fig. 7(b)] by inflating the balloon to the target pressure (14 atm) using a balloon inflator. Both fluorescence intensity/lifetime images [Fig. 7(c) and 7(d)] and IVUS images [Fig. 7(e)] were acquired using the multifunctional catheter. Similar to the previous test in the bimodal physical phantom, the IVUS image was segmented to obtain the vessel lumen geometry. This information was used to project the fluorescence image on the vessel surface, thus creating a 3-D representation of the fluorescence lifetime image [Fig. 7(f)]. Fig. 7IVUS—FLIm coregistration: evaluation in a coronary artery phantom. (a) Stent before deployment (b) stent inserted in pig coronary artery; (c) open-loop intensity image; (d) folded open intensity lifetime image with intensity threshold; (e) IVUS image cross-section; and (f) reconstructed 3-D FLIm image of the coronary lumen. 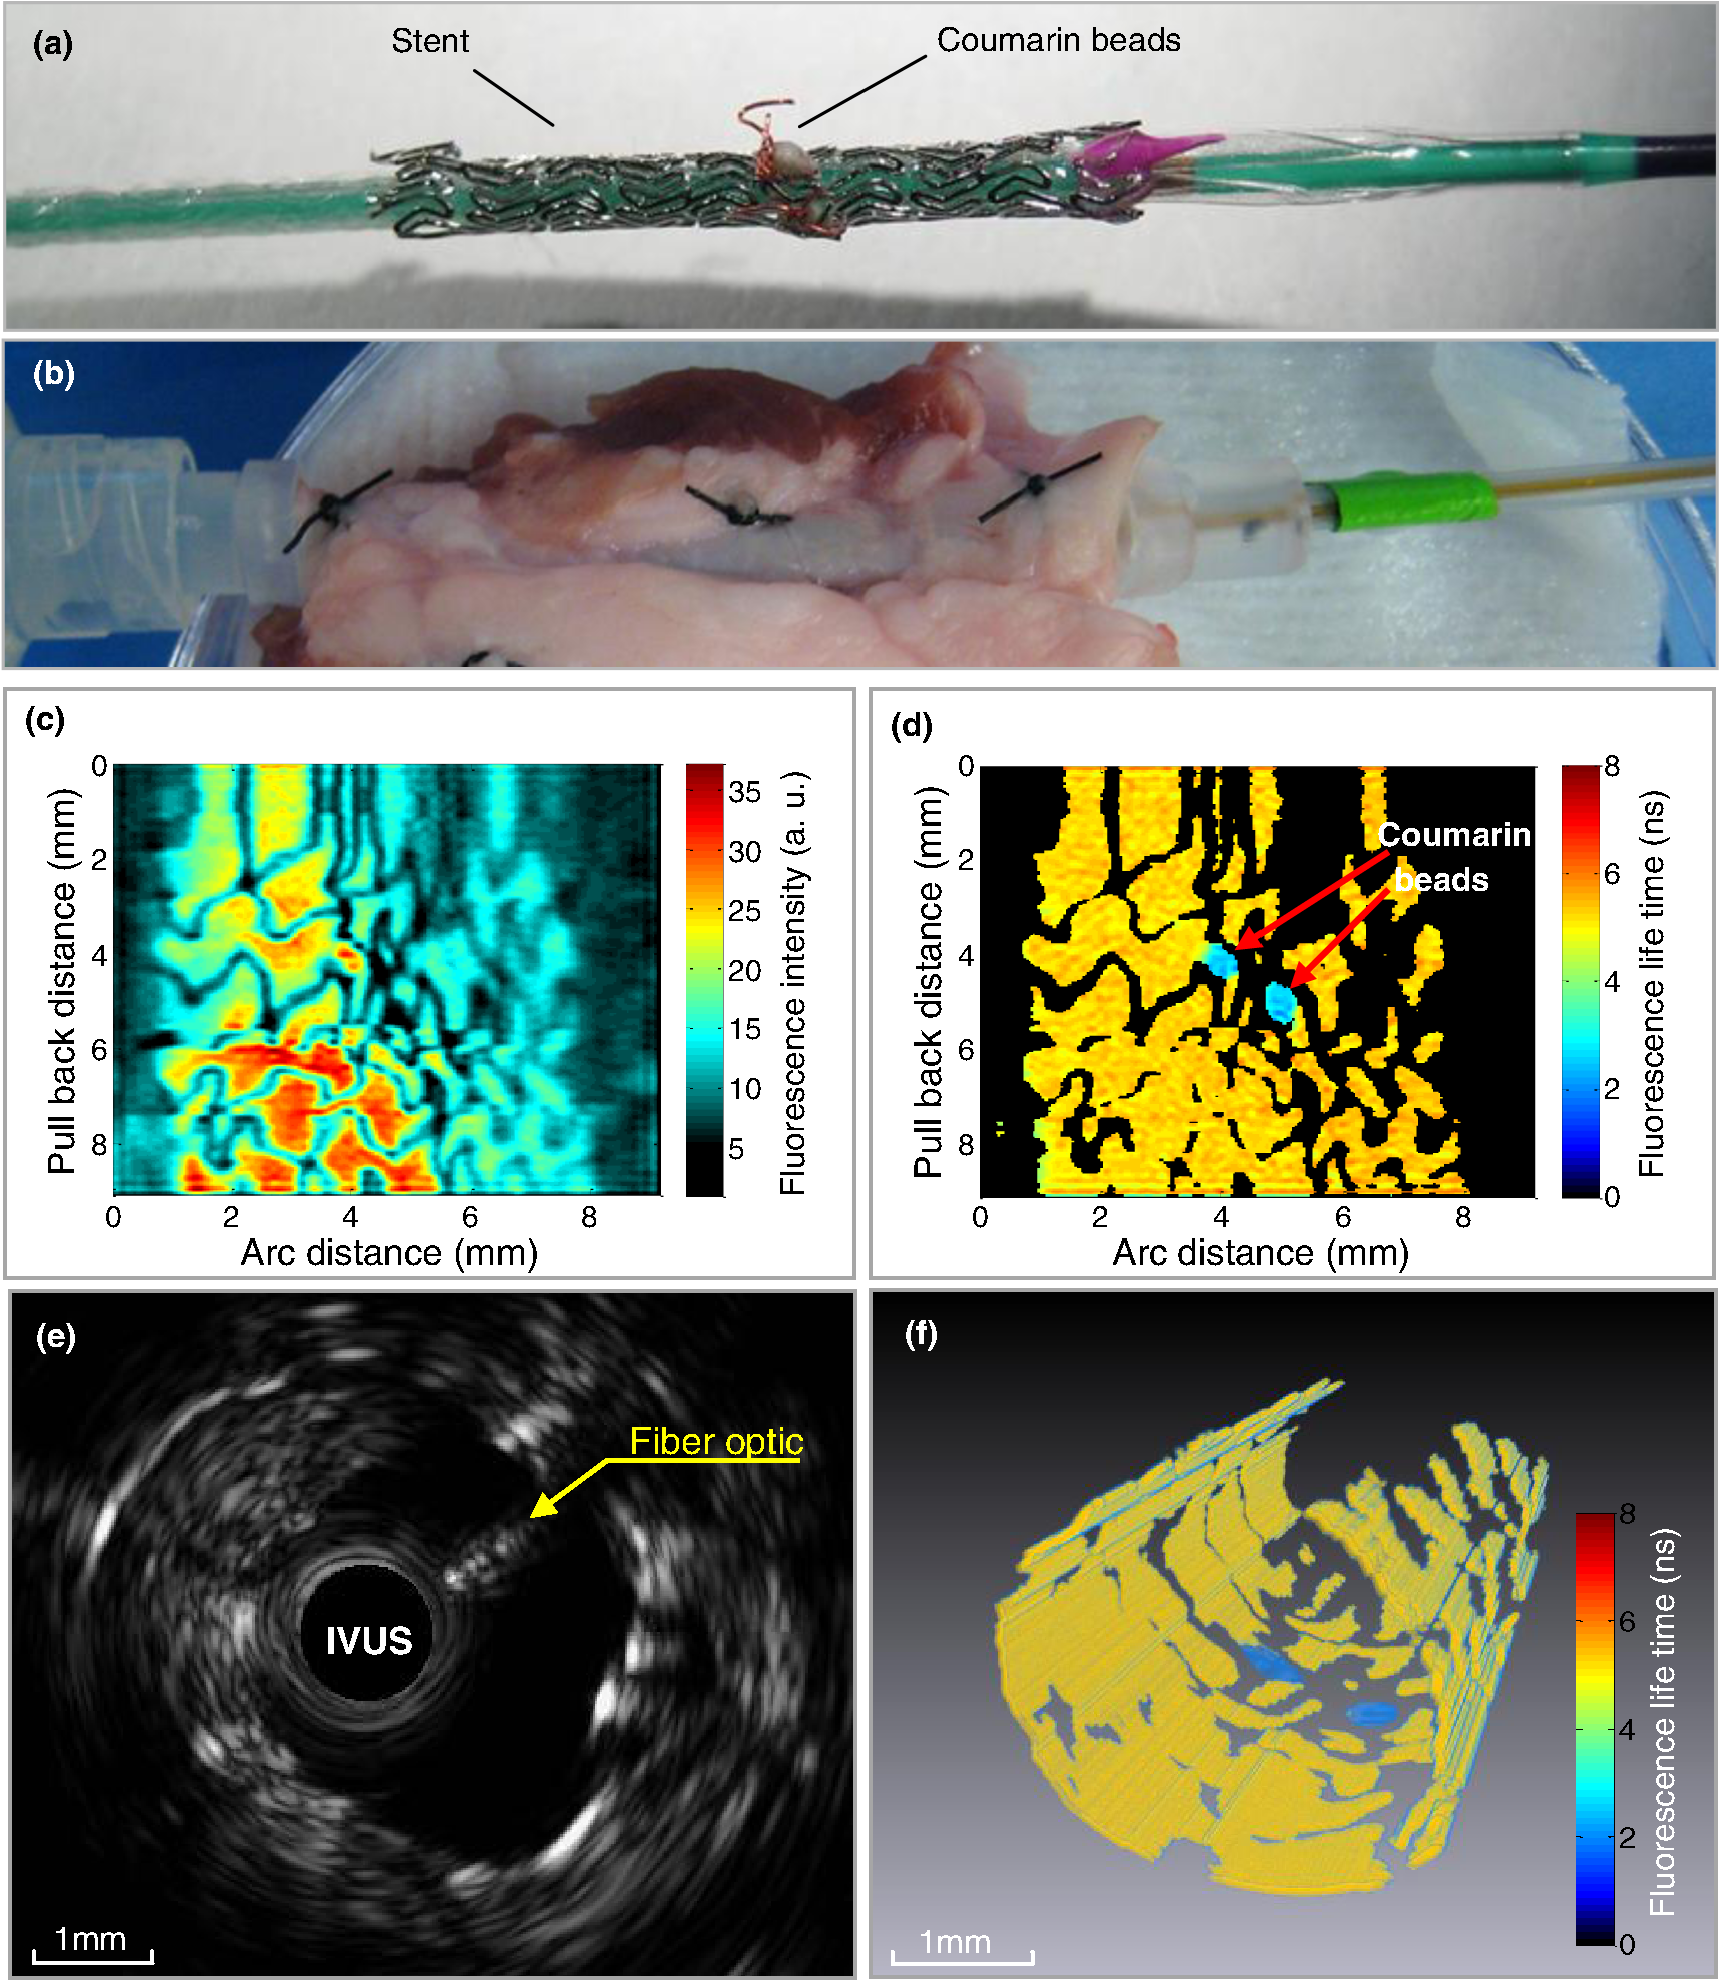 The intensity image, Fig. 7(c), clearly showed the structure of the stent. It can be noted that a large variation of signal occurs across the luminal surface due to changes in excitation-collection geometry during radial scanning. In contrast, the time-resolved fluorescence data permitted construction of the lifetime image, Fig. 7(d), showing that both the fluorescent beads (average lifetime ) and the arterial wall (average lifetime ) can be easily resolved in channel 2. The lifetime signal was accurately retrieved over the whole field of view but displayed only for areas where the signal intensity is above a threshold value, chosen to be a third of the maximum intensity in this case. This allows structural information from the stent struts to be displayed on the lifetime image. The coronary arterial wall autofluorescence with broad emission (350 to 600 nm) was clearly observed and time-resolved in the corresponding spectral emission channels (channels 1 and 2). This characteristic is attributed to the fluorescence emission of structural proteins in the arterial wall (elastin and collagen). Elastin, in particular, is known to be the dominant contributor of fluorescence signal in the normal coronary artery upon UV excitation.27,28 The capability of IVUS to display real-time images played initially an important role in the localization of the area of interest (i.e., stent covered area) for bimodal interrogation of the coronary vessel. Subsequently, this information was used for guiding and triggering the data acquisition. In addition to providing a 3-D image of the stent, vessel wall and surrounding tissue, the ultrasonic data was used, as noted above, to recover the vessel wall surface and therefore allowed for mapping of the fluorescence data on the IVUS image. The IVUS information could be further used to correct for the variation of fluorescence intensity due to variations of the fiber optic to arterial wall distance. 4.Discussion and ConclusionThis study demonstrates the design and construction of a novel intravascular diagnostic catheter and validation of its multifunctional features in narrow cylindrical structures and pig coronary arteries. This catheter system enabled mapping of biochemical features provided by FLIm on structural features provided by IVUS through a direct spatial coregistration of the bimodal features. The specialized flushing system integrated in the catheter enables continuous release of a small amount of fluid that clears the optical field of view without the need for blood flow occlusion during optical interrogation. For the initial validation of the bimodal imaging system, we built up on a commercially available IVUS catheter system and the associated motor drive by integrating a fiber optic that can be rotated independently but coordinated with IVUS. This provided a direct solution to demonstrate the concept of bimodal imaging using IVUS and FLIm. While the catheter system presented here is rather large for the practical investigation of coronary arteries with a lumen diameter smaller than 3 mm, knowledge developed with the application enables further development of catheters where the fiber optic and the IVUS transducer are coaxial and rotated by one motor drive. This will facilitate a reduction of the overall catheter outer diameter. Current results showed that the FLIm component of the catheter system allows for robust acquisition of 2-D autofluorescence data from coronary artery vessel simultaneously in multiple spectral bands. The FLIm of ex vivo coronary arterial sample (rich in elastin and collagen) demonstrated that this technique is sensitive to levels of fluorescence signals similar to that expected in vivo in human arteries. Importantly, the synchronous scanning-TRFS and IVUS enabled a continuous evaluation of distance between the tips of the fiber optic as the ultrasonic measurement provides real-time information on catheter position with respect to the vessel wall. This information can be used to correct not only the signal intensity but also the pixel size in the FLIm image as a function of changes in probe-to-tissue distance; thus a better localization of distinct structures in the vessel wall can be achieved. Current catheter system was able to identify fluorescent beads (size 0.3 mm) and structures smaller than 0.2 mm diameter such as stent struts. This aspect can be further improved by optimizing the optical beam shape and by increasing the spatial sampling. However, this will result in a longer data acquisition time. In the current system, the data acquisition speed is limited by the repetition rate of the laser (i.e., 30 Hz). The use of high repetition-rate laser devices with repetition rates up to 20 MHz will allow for more practical application of scanning-TRFS in in vivo setting. This represents a new effort currently pursued by our laboratory. The increased acquisition speed will require fast data processing methods. Although the constrained least-squares deconvolution with Laguerre expansion technique used is fast, faster analysis methods such as the phasor approach could also be envisioned.29 The fluorescence measurements took advantage of a novel blood flushing system. While the measurement of the fluorescence decay (excited state lifetime) is independent of the absolute value of the fluorescence intensity, thus a small amount of blood hemoglobin in the optical pathway is unlikely to affect the measurement, the presence of a layer of blood in the optical pathway can decrease the signal-to-noise ratio to a level where the emission may not be recorded. To remove the blood during acquisition, other intravascular optical systems such as optical coherence tomography have implemented either balloon occlusion or bolus injection during acquisition.12,30 However, these methods limit the data acquisition to areas that are intermittently cleared of blood. In this study, we experimentally tested an approach that demonstrated a continuous acquisition of fluorescence data in blood mimicking fluid without the need for vessel occlusion. The flushing worked effectively for small distances between the tip of the fiber and the arterial wall. This is the situation that will be encountered in future practical applications in coronary arteries, where due to the small diameter of these arteries the distance between catheter and vessel wall is expected to be very small. Current work provided a set of parameters that can be used in future studies for the optimization of this new flushing approach. In summary, this study demonstrates the feasibility of integrating FLIm with IVUS techniques and for developing intravascular catheters based on these two complementary imaging modalities. The ability of FLIm to detect compositional features of the arterial vessel can address current diagnostic limitations of the conventional IVUS technology. Reciprocally, IVUS can play an enabling role on translating FLIm to a clinical setting as it can serve as an established intravascular platform supporting the practical implementation of the FLIm component. AcknowledgmentsThis study was supported by the National Institute of Health Grant Number R01 HL 67377. The IVUS system used in this study was made available by Boston Scientific Corporation. ReferencesD. Lloyd-Joneset al.,
“Heart disease and stroke statistics—2009 update,”
Circulation, 119
(3), 480
–486
(2009). http://dx.doi.org/10.1161/CIRCULATIONAHA.108.191259 CIRCAZ 0009-7322 Google Scholar
P. LibbyM. DiCarliR. Weissleder,
“The vascular biology of atherosclerosis and imaging targets,”
J. Nucl. Med., 51
(Supplement 1), 33S
–37S
(2010). http://dx.doi.org/10.2967/jnumed.109.069633 JNMEAQ 0161-5505 Google Scholar
F. LeuschnerM. Nahrendorf,
“Molecular imaging of coronary atherosclerosis and myocardial infarction,”
Circ. Res., 108
(5), 593
–606
(2011). http://dx.doi.org/10.1161/CIRCRESAHA.110.232678 CIRUAL 0009-7330 Google Scholar
M. J. Suteret al.,
“Intravascular optical imaging technology for investigating the coronary artery,”
JACC: Cardiovas. Imag., 4
(9), 1022
–1039
(2011). http://dx.doi.org/10.1016/j.jcmg.2011.03.020 Google Scholar
L. Marcu,
“Fluorescence lifetime techniques in medical applications,”
Ann. Biomed. Eng., 40
(2), 304
–331
(2012). http://dx.doi.org/10.1007/s10439-011-0495-y ABMECF 0090-6964 Google Scholar
R. Richards-KortumE. Sevick-Muraca,
“Quantitative optical spectroscopy for tissue diagnosis,”
Annu. Rev. Phys. Chem., 47
(1), 555
–606
(1996). http://dx.doi.org/10.1146/annurev.physchem.47.1.555 ARPLAP 0066-426X Google Scholar
L. Marcuet al.,
“Discrimination of human coronary artery atherosclerotic lipid-rich lesions by time-resolved laser-induced fluorescence spectroscopy,”
Arterioscler. Throm. Vas., 21
(7), 1244
–1250
(2001). http://dx.doi.org/10.1161/hq0701.092091 Google Scholar
L. Marcuet al.,
“Detection of rupture-prone atherosclerotic plaques by time-resolved laser-induced fluorescence spectroscopy,”
Atheroscler., 204
(1), 156
–164
(2009). http://dx.doi.org/10.1016/j.atherosclerosis.2008.08.035 ATHSBL 0021-9150 Google Scholar
Y. Sunet al.,
“Dynamic tissue analysis using time- and wavelength-resolved fluorescence spectroscopy for atherosclerosis diagnosis,”
Opt. Express, 19
(5), 3890
–3901
(2011). http://dx.doi.org/10.1364/OE.19.003890 OPEXFF 1094-4087 Google Scholar
Y. Sunet al.,
“Simultaneous time- and wavelength-resolved fluorescence spectroscopy for near real-time tissue diagnosis,”
Opt. Lett., 33
(6), 630
–632
(2008). http://dx.doi.org/10.1364/OL.33.000630 OPLEDP 0146-9592 Google Scholar
H. Xieet al.,
“Multispectral scanning time-resolved fluorescence spectroscopy (TRFS) technique for intravascular diagnosis,”
Biomed. Opt. Express, 3
(7), 1521
–1533
(2012). http://dx.doi.org/10.1364/BOE.3.001521 BOEICL 2156-7085 Google Scholar
Y. HondaP. J. Fitzgerald,
“Frontiers in intravascular imaging technologies,”
Circulation, 117
(15), 2024
–2037
(2008). http://dx.doi.org/10.1161/CIRCULATIONAHA.105.551804 CIRCAZ 0009-7322 Google Scholar
G. S. Mintzet al.,
“American College of Cardiology clinical expert consensus document on standards for acquisition, measurement and reporting of intravascular ultrasound studies (IVUS): a report of the American college of cardiology task force on clinical expert consensus documents developed in collaboration with the European society of cardiology endorsed by the society of cardiac angiography and interventions,”
J. Am. Coll. Cardiol., 37
(5), 1478
–1492
(2001). http://dx.doi.org/10.1016/S0735-1097(01)01175-5 JACCDI 0735-1097 Google Scholar
S. Sathyanarayanaet al.,
“Characterisation of atherosclerotic plaque by spectral similarity of radiofrequency intravascular ultrasound signals,”
EuroIntervention, 5
(1), 133
–139
(2009). Google Scholar
T. Sawadaet al.,
“Feasibility of combined use of intravascular ultrasound radiofrequency data analysis and optical coherence tomography for detecting thin-cap fibroatheroma,”
Eur. Heart J., 29
(9), 1136
–1146
(2008). http://dx.doi.org/10.1093/eurheartj/ehn132 EHJODF 0195-668X Google Scholar
D. Stephens,
“Intraluminal fluorescence spectroscopy catheter with ultrasound guidance,”
J. Biomed. Opt., 14
(3), 30505
(2009). http://dx.doi.org/10.1117/1.3146813 JBOPFO 1083-3668 Google Scholar
J. Liuet al.,
“A novel method for fast and robust estimation of fluorescence decay dynamics using constrained least-squares deconvolution with Laguerre expansion,”
Phys. Med. Biol., 57
(4), 843
–865
(2012). http://dx.doi.org/10.1088/0031-9155/57/4/843 PHMBA7 0031-9155 Google Scholar
S. Prahl,
“Optical absorption of hemoglobin,”
(2012) http://omlc.ogi.edu/spectra/hemoglobin/index.html June ). 2012). Google Scholar
N. Ghataet al.,
“Towards development of an intravascular diagnostic catheter based on fluorescence lifetime spectroscopy: study of an optimized blood flushing system,”
Proc. SPIE, 7883 78833E
(2011). http://dx.doi.org/10.1117/12.874957 PSISDG 0277-786X Google Scholar
B. Eckhardt,
“Introduction. Turbulence transition in pipe flow: 125th anniversary of the publication of Reynolds’ paper,”
Philos. T. Roy. Soc. A: Math. Phys. Eng. Sci., 367
(1888), 449
–455
(2009). http://dx.doi.org/10.1098/rsta.2008.0217 PTRMAD 1364-503X Google Scholar
H. PalS. NadM. Kumbhakar,
“Photophysical properties of coumarin-120: unusual behavior in nonpolar solvents,”
J. Chem. Phys., 119
(1), 443
–452
(2003). http://dx.doi.org/10.1063/1.1578057 JCPSA6 0021-9606 Google Scholar
N. Boenset al.,
“Fluorescence lifetime standards for time and frequency domain fluorescence spectroscopy,”
Anal. Chem., 79
(5), 2137
–2149
(2007). http://dx.doi.org/10.1021/ac062160k ANCHAM 0003-2700 Google Scholar
M. ArıkN. ÇelebiY. Onganer,
“Fluorescence quenching of fluorescein with molecular oxygen in solution,”
J. Photochem. Photobiol. A: Chem., 170
(2), 105
–111
(2005). http://dx.doi.org/10.1016/j.jphotochem.2004.07.004 JPPCEJ 1010-6030 Google Scholar
S. J. MadsenM. S. PattersonB. C. Wilson,
“The use of India ink as an optical absorber in tissue-simulating phantoms,”
Phys. Med. Biol., 37
(4), 985
–993
(1992). http://dx.doi.org/10.1088/0031-9155/37/4/012 PHMBA7 0031-9155 Google Scholar
Y. Itzchaket al.,
“External iliac artery blood flow in patients with arteriosclerosis obliterans,”
Am. J. Roentgenol., 125
(2), 437
–441
(1975). AJROAM 0092-5381 Google Scholar
P. Ghosh,
“A clinical review of myocardial blood flow and coronary flow reserve with dynamic myocardial perfusion PET/CT,”
Google Scholar
L. Laiferet al.,
“Biochemical basis for the difference between normal and atherosclerotic arterial fluorescence,”
Circulation, 80
(6), 1893
–1901
(1989). http://dx.doi.org/10.1161/01.CIR.80.6.1893 CIRCAZ 0009-7322 Google Scholar
J. Phippset al.,
“Fluorescence lifetime imaging for the characterization of the biochemical composition of atherosclerotic plaques,”
J. Biomed. Opt., 16
(9), 096018
(2011). http://dx.doi.org/10.1117/1.3626865 JBOPFO 1083-3668 Google Scholar
C. Stringariet al.,
“Phasor approach to fluorescence lifetime microscopy distinguishes different metabolic states of germ cells in a live tissue,”
Proc. Natl. Acad. Sci., 108
(33), 13582
–13587
(2011). http://dx.doi.org/10.1073/pnas.1108161108 PNASA6 0027-8424 Google Scholar
A. F. Lowet al.,
“Technology Insight: optical coherence tomography--current status and future development,”
Nat. Clin. Pract. Cardiovasc. Med., 3
(3), 154
–162
(2006). http://dx.doi.org/10.1038/ncpcardio0482 NCPCC4 1743-4297 Google Scholar
|


