|
|
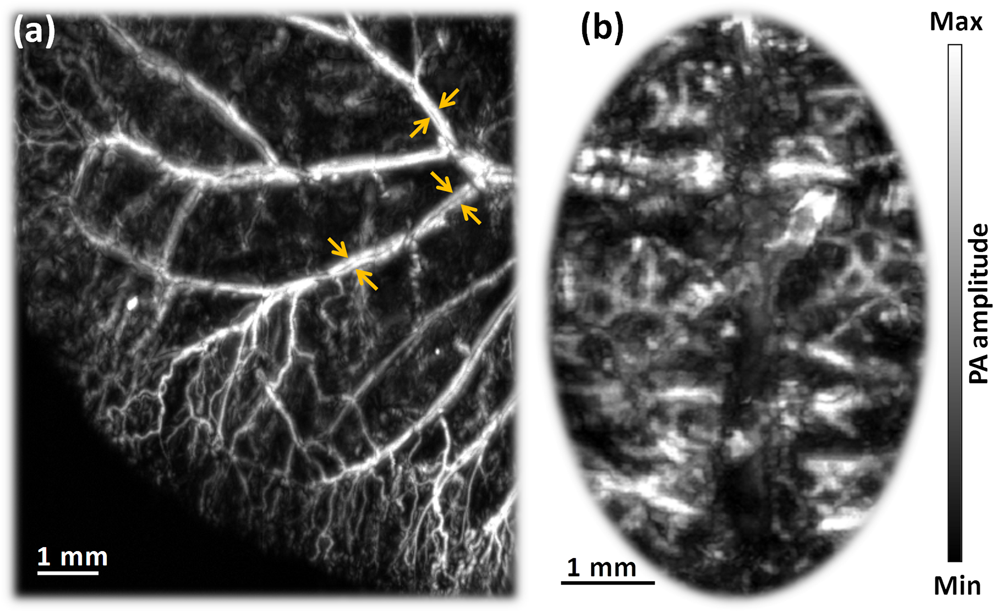
1.IntroductionTaking advantage of low scattering of sound and deep penetration of diffused photons,1 photoacoustic tomography (PAT) offers high spatial resolution in deep tissue. Using optical absorption contrasts, different PAT systems have demonstrated anatomical, functional, and molecular imaging up to several millimeters and even centimeters deep in vivo.2–8 Recently, in order to apply this emerging technique to broader clinical practice and biomedical studies, researchers are working on improving its overall performance, including imaging speed. A fast imaging speed can bring many benefits to PAT, such as enabling the study of dynamic physiological or pathological processes, reducing motion artifacts, and shortening imaging time. Recently, array-based PAT systems have demonstrated high two-dimensional (2-D) imaging speeds, ranging from several hertz to hundreds of hertz.9–11 An array-based system usually employs an unfocused multiple-element ultrasound array to simultaneously receive photoacoustic (PA) signals at different positions; 2-D images are reconstructed from the PA signals. The use of a multiple-element array avoids mechanical scanning and thus enables fast imaging. However, array-based PAT systems inevitably increase hardware complexity and cost, and there is a limited selection of high-frequency ultrasound arrays on the market. Furthermore, image reconstruction requires good uniformity among different elements. Another major implementation of PAT, acoustic-resolution photoacoustic microscopy (AR-PAM), mechanically scans a single-element focused ultrasound transducer and does not require image reconstruction. Compared with array-based PAT, AR-PAM is simpler, cheaper, and free of reconstruction artifacts. Recently, the mechanical scanning speed of dark-field AR-PAM was increased to 10 Hz over 9-mm scanning range using a voice-coil stage.12 However, due to a low laser repetition rate, only slow PA imaging was implemented. Since dark-field illumination requires millijoule (mJ) scale pulse energy,3,13,14 it is technically challenging and cost-prohibitive to manufacture a high-pulse energy laser with a tens of kHz pulse repetition rate. Furthermore, in fast imaging using a high-repetition-rate laser, the skin surface is continuously exposed to multiple pulses in short time, which lowers the single-pulse maximum permissible exposure.15 Therefore a more efficient light-delivery system is necessary for fast AR-PAM. Here we report the development of a bright-field AR-PAM system based on a lightweight PA probe and a fast voice-coil scanner. The PA probe is comprised mainly of a 50-MHz ultrasound transducer, a compact PA beam combiner, and a bright-field light delivery system. The light delivery system focuses the light beam onto a 400-μm-diameter circular spot, which has a smaller area than those in reported dark-field AR-PAM systems. The optical and acoustic axes are aligned through the PA beam combiner confocally and co-axially. This design improves light delivery efficiency and lowers the required pulse energy to tens of micro-joules. A voice-coil stage is employed to fast scan the PA probe. Using this system, video-rate () 2-D B-scan imaging is achieved over a 9-mm range. A customized dual-wavelength pulsed laser permits measuring deep-tissue oxygenation of hemoglobin. The oxygen dynamics of mouse cardio-vasculature are imaged in this work to demonstrate the real-time functional imaging capability. 2.System DesignAs shown in Fig. 1, a dual-wavelength pulsed laser (wavelength: 532 and 559 nm; pulse width: 10 ns; EdgeWave GmbH, Wurselen, Germany) delivers light to the PA probe through a multimode optical fiber (core diameter: 400 µm). The laser system consists of a 532-nm pump laser followed by a Raman shifter that converts 532-to 559-nm wavelength. An electro-optic modulator is used to rapidly change the polarization of the pump laser, so that a polarized beam splitter can either direct the laser beam through the Raman shifter or bypass it. The two laser beam paths are recombined through another polarized beam splitter. The laser can operate at a pulse repetition rate of 30 kHz in single-wavelength mode, and 15 kHz in dual-wavelength mode. The maximum pulse energies are at 532 nm and at 559 nm. The light beam diverges from the output of the fiber and is then weakly focused by an optical lens. A custom-made PA beam combiner redirects the light beam onto the imaged objects. The PA beam combiner is made of two right-angle glass prisms. One of them has an aluminum coating on its hypotenuse. Because aluminum coating has similar acoustic impedance with glass, the PA beam combiner effectively reflects the optical beam and transmits the acoustic beam. A plano-concave ultrasound lens (acoustic NA in water: 0.5) is attached to the PA beam combiner to convert spherical ultrasound waves to planar waves. After passing through the PA beam combiner, the acoustic wave is received by a 50-MHz broadband ultrasound transducer. The PA signal from the ultrasound transducer is amplified by two identical 28-dB amplifiers connected in series (ZFL-500LN+, Mini-circuits, NY, USA) and then digitized at a 500-MHz sampling rate. The entire PA probe, enclosed by the dashed box in Fig. 1, weighs 33 g. Fig. 1Schematic of voice-coil AR-PAM system. MF: multiple-mode fiber; OL: optical lens; PAC: photoacoustic beam combiner; T: tissue; UL: ultrasound lens; UT: ultrasound transducer; W: water.  A voice-coil stage (VCS-1010, Equipment Solutions, Sunnyvale, CA, USA) is employed to scan the PA probe in the fast scanning axis (-axis). A stepper motor stage translates the entire voice-coil stage in the slow scanning axis (-axis). At each location, the system records a one-dimensional time-resolved signal, which is converted into a depth-resolved image (A-line) according to the acoustic propagation speed in soft tissue (). Scanning the PA probe along the -axis generates 2-D B-scan images. Due to the light weight of the PA probe and the high force-to-mass ratio of the voice-coil actuator, the imaging system can acquire 40 B-scan images per second over a scanning range of 9 mm. A field-programmable-gate-array (FPGA) card is used to generate synchronized laser triggers, digitizer triggers, and motion control commands. In the in vivo experiments, nude mice were imaged under anesthesia. The mice were placed on a 37°C heating pad and secured with a nose cone. Ultrasound gel was applied between the tissue surface and the membrane, attached to an opening at the bottom of the water tank, to transmit ultrasound waves. All experimental animal procedures were carried out in conformance with the laboratory animal protocol approved by the Animal Studies Committee of Washington University in St. Louis. 3.Monte Carlo Simulation of Illumination EfficienciesTo estimate the efficiency of the bright-field illumination, we used the Monte Carlo method to simulate photon propagation in tissue. The illuminated spot on the tissue surface had a diameter of 2 mm. As a comparison, a typical dark-field illumination was also studied, where the light beams were incident at 45 deg with respect to the -axis direction, and the illuminated surface area was a donut shape with a 3-mm inner diameter and a 9-mm outer diameter. Incident pulse energies in both cases were identical. Tissue optical properties were set as refractive index , absorption coefficient , scattering coefficient , and scattering anisotropy . Figure 2(a) and 2(b) show the relative fluence distributions of the bright- and dark-field illuminations. Figure 2(c) presents the relative on-axial fluence at different penetration depths under bright- and dark-field illuminations. The results indicate that, with the same pulse energy, bright-field illumination provides higher central fluence than dark-field illumination at several millimeters depth. However, the dark-field illumination does serve the original purpose of reducing the surface interference to the deeper signals.13 Since pulse energy is usually limited in high-repetition-rate pulsed lasers, the tighter-focused bright-field illumination is more suitable for fast AR-PAM imaging than dark-field illumination. 4.System CharacterizationThe spatial resolution of the imaging system was measured by imaging a carbon fiber with a 6-μm diameter. The carbon fiber was submerged in water, parallel with the -axis. A cross-sectional profile of the carbon fiber in the -axis direction is shown in Fig. 3(a), where a Gaussian fit gives a full width at half maximum (FWHW) of 44 μm. Fig. 3(a) 44-μm lateral resolution; (b) 28-µm axial resolution; (c) representative in vivo B-scan image showing 4.8-mm penetration depth.  The axial (-axis) resolution was quantified by taking the FWHM of the envelope of PA signal in the depth direction. The envelope was calculated from the absolute value of the Hilbert transformed radio-frequency (RF) signal. Figure 3(b) shows the measured axial resolution as 28 μm. Using the RF signal, rather than its envelope, the shift-and-summethod14,16 can differentiate two identical point sources at an axial distance of 15 µm with . To quantify the in vivo penetration depth, we imaged the mouse chest. The mouse was set in a supine position so that its chest wall faced up toward the PA probe. The laser was operated at a 532-nm wavelength with a 28-μJ pulse energy. The optical fluence on the skin surface was estimated to be . Figure 3(c) shows a cross-sectional PA image, where we can find strong signals with an SNR of 5 at 4.8 mm below the skin surface. 5.In Vivo Anatomical ImagingAs shown in Fig. 4(a), micro-vasculatures in the mouse ear were imaged in vivo at a 532-nm wavelength. Artery-vein pairs can be identified in the anatomical image. Brain imaging was also demonstrated on a living mouse with both the scalp and skull intact. Figure 4(b) shows a maximum-amplitude-projection image of micro-vasculature in the brain cortex. 6.Real-Time Functional ImagingA-line-based dual-wavelength () switching was implemented to image deep-tissue oxygenation in real time. Oxygenated and deoxygenated hemoglobin ( and Hb) have different molar optical absorption coefficients at 532 nm and 559 nm. Since photoacoustic signals are proportional to the absorption coefficient, the change of relative concentration affects the PA amplitudes differently at the two wavelengths. Local fluence also affects the PA amplitudes. If the local optical fluence fluctuation can be compensated for, absolute oxygen saturation () might be determined, which is an active area of research in deep tissue in vivo imaging.17–20 Accurate fluence compensation is beyond the scope of this paper. Here we directly use the PA amplitude ratio between 532 and 559 nm to relate to oxygen saturation, without compensation for local fluence fluctuation. To avoid confusion, we denote the noncompensated oxygen saturation value as instead of in the following text. Mouse cardio-vasculature was imaged in real time in vivo. Video 1 clearly shows both breathing and heart beating motions. Via A-line-based dual-wavelength switching, cross-sectional 2-D images at each wavelength were acquired at 40 frames per second. The images at the two wavelengths are naturally registered due to the fast A-line-based wavelength switching. Figure 5(a) to 5(c) show representative functional images of mouse cardio-vasculatures under systemic hypoxia, normaxia, and hyperoxia, which were controlled by varying the inhalation gas to 5, 21, and 100% oxygen, respectively. Because of strong blood absorption at 532 and 559 nm, photons cannot penetrate the entire cardio-vascular region. Arrows in Fig. 5(a) denote the top surfaces of the cardio-vasculatures. Fig. 5In vivo functional imaging of mouse cardio-vasculature under systemic (a) hypoxia, (b) normaxia, and (c) hyperoxia (Video 1, MPEG, 15 MB [URL: http://dx.doi.org/10.1117/1.JBO.17.10.106007.1].; Video 2, MPEG, 7 MB [URL: http://dx.doi.org/10.1117/1.JBO.17.10.106007.2].; Video 3, MPEG, 7 MB [URL: http://dx.doi.org/10.1117/1.JBO.17.10.106007.3].). In (a), the dashed line denotes the skin surface, and the arrows point at cardio-vascular features; (d) average cardio-vascular versus time while the inhalation gas was altered between 5 and 100% oxygen; (e) frequency spectrum of shown in (d); (f) average cardio-vascular versus time showing correlation with breathing motion; (g) average cardio-vascular versus time showing correlation with heart beating.  During cardio-vascular functional imaging, we challenged the mouse by alternating the inhalation gas between 5 and 100% oxygen. Two videos show real-time functional imaging during transitions from low to high oxygen (Video 2), and from high to low oxygen (Video 3) The in the imaged cardio-vascular region was averaged over each round-trip voice-coil scan to achieve 20 measurements per second, and plotted in Fig. 5(d). The follows the changes in the inhalation gas. When the inhalation gas changed from low to high oxygen, the took 38.2 s to transition from 10 to 90% of the eventual change. When the respired gas changed from high to low oxygen, the took 82.8 s to transition from 90 to 10% of the eventual change. As shown in Fig. 5(e), three major peaks exist in the frequency spectrum of the signal. The first peak, at , is caused by alternation in inhalation gas. The other two peaks, at 1.3 and 3.8 Hz, are the frequencies of breathing and heart beating motions, respectively. To further confirm the motion-related change, we compare the with the breathing and heart beating motions, respectively, in the time domain. Due to the fast imaging speed, breathing motion is captured in the PA images. The -axis position of the skin surface was detected to measure the breathing motion. Figure 5(f) shows the changes synchronously with breathing motion. ECG (electrocardiography) was used to record the heart beating motion concurrently with real-time PA imaging. The averaged signals were time-gated by the ECG signals and further averaged over multiple heart beating cycles. Figure 5(g) shows that the also varies synchronously with heat beating. 7.ConclusionIn summary, we have successfully developed a novel AR-PAM system that enabled video-rate functional imaging in deep tissue. A lightweight PA probe and a voice-coil scanner were employed for fast mechanical scanning. Bright-field, instead of dark-field, illumination improved the photon delivery efficiency, which enabled the use of high-repetition-rate low-energy pulsed lasers to implement fast PA imaging. Anatomical imaging of the mouse ear and brain as well as functional imaging of the mouse cardio-vasculature has been demonstrated in vivo. The fast speed can effectively improve imaging throughput, reduce motion artifacts, and enable the visualization of highly dynamic biomedical processes. AcknowledgmentsThe authors appreciate Prof. James Ballard’s help with editing the manuscript. This work was sponsored by NIH grants R01 EB000712, R01 EB008085, R01 CA134539, U54 CA136398, R01 CA157277, and R01 CA159959. Lihong Wang has a financial interest in Endra, Inc., and Microphotoacoustics, Inc., which did not support this work. Konstantin Maslov has a financial interest in Microphotoacoustics, Inc., which did not support this work. ReferencesL. V. WangS. Hu,
“Photoacoustic tomography: in vivo imaging from organelles to organs,”
Science, 335
(6075), 1458
–1462
(2012). http://dx.doi.org/10.1126/science.1216210 SCIEAS 0036-8075 Google Scholar
X. Wanget al.,
“Noninvasive laser-induced photoacoustic tomography for structural and functional in vivo imaging of the brain,”
Nat. Biotech., 21
(7), 803
–806
(2003). http://dx.doi.org/10.1038/nbt839 NABIF9 1087-0156 Google Scholar
H. F. Zhanget al.,
“Functional photoacoustic microscopy for high-resolution and noninvasive in vivo imaging,”
Nat. Biotech., 24
(7), 848
–851
(2006). http://dx.doi.org/10.1038/nbt1220 NABIF9 1087-0156 Google Scholar
K. H. SongL. V. Wang,
“Deep reflection-mode photoacoustic imaging of biological tissue,”
J. Biomed. Opt., 12
(6), 060503
(2007). http://dx.doi.org/10.1117/1.2818045 JBOPFO 1083-3668 Google Scholar
L. Meng-Linet al.,
“Simultaneous molecular and hypoxia imaging of brain tumors using spectroscopic photoacoustic tomography,”
Proc. IEEE, 96
(3), 481
–489
(2008). http://dx.doi.org/10.1109/JPROC.2007.913515 IEEPAD 0018-9219 Google Scholar
A. De La Zerdaet al.,
“Carbon nanotubes as photoacoustic molecular imaging agents in living mice,”
Nat. Nano., 3
(9), 557
–562
(2008). http://dx.doi.org/10.1038/nnano.2008.231 1748-3387 Google Scholar
C. Kimet al.,
“Deeply penetrating in vivo photoacoustic imaging using a clinical ultrasound array system,”
Biomed. Opt. Express, 1
(1), 278
–284
(2010). http://dx.doi.org/10.1364/BOE.1.000278 BOEICL 2156-7085 Google Scholar
G. S. Filonovet al.,
“Deep-tissue photoacoustic tomography of a genetically encoded near-infrared fluorescent probe,”
Angewandte Chemie International Edition, 51
(6), 1448
–1451
(2012). http://dx.doi.org/10.1002/anie.201107026 ACIEAY 0570-0833 Google Scholar
R. J. Zempet al.,
“Realtime photoacoustic microscopy in vivo with a 30-MHz ultrasound array transducer,”
Opt. Express, 16
(11), 7915
–7928
(2008). http://dx.doi.org/10.1364/OE.16.007915 OPEXFF 1094-4087 Google Scholar
J. Gamelinet al.,
“A real-time photoacoustic tomography system for small animals,”
Opt. Express, 17
(13), 10489
–10498
(2009). http://dx.doi.org/10.1364/OE.17.010489 OPEXFF 1094-4087 Google Scholar
L. SongK. MaslovL. V. Wang,
“Section-illumination photoacoustic microscopy for dynamic 3D imaging of microcirculation in vivo,”
Opt. Lett., 35
(9), 1482
–1484
(2010). http://dx.doi.org/10.1364/OL.35.001482 OPLEDP 0146-9592 Google Scholar
T. Harrisonet al.,
“Combined photoacoustic and ultrasound biomicroscopy,”
Opt. Express, 17
(24), 22041
–22046
(2009). http://dx.doi.org/10.1364/OE.17.022041 OPEXFF 1094-4087 Google Scholar
K. MaslovG. StoicaL. V. Wang,
“In vivo dark-field reflection-mode photoacoustic microscopy,”
Opt. Lett., 30
(6), 625
–627
(2005). http://dx.doi.org/10.1364/OL.30.000625 OPLEDP 0146-9592 Google Scholar
W. S. ErichM. KonstantinV. W. Lihong,
“Noninvasive, in vivo imaging of the mouse brain using photoacoustic microscopy,”
J. Appl. Phys., 105
(10), 102027
(2009). http://dx.doi.org/10.1063/1.3116134 JAPIAU 0021-8979 Google Scholar
“American national standard for the safe use of lasers,”
(2000). Google Scholar
C. Zhanget al.,
“Reflection-mode submicron-resolution in vivo photoacoustic microscopy,”
J. Biomed. Opt., 17
(2), 020501
(2012). http://dx.doi.org/10.1117/1.JBO.17.2.020501 JBOPFO 1083-3668 Google Scholar
L. Janet al.,
“Quantitative spatially resolved measurement of tissue chromophore concentrations using photoacoustic spectroscopy: application to the measurement of blood oxygenation and haemoglobin concentration,”
Phys. Med. Bio., 52
(1), 141
–168
(2007). http://dx.doi.org/10.1088/0031-9155/52/1/010 PHMBA7 0031-9155 Google Scholar
A. Q. Baueret al.,
“Quantitative photoacoustic imaging: correcting for heterogeneous light fluence distributions using diffuse optical tomography,”
J. Biomed. Opt., 16
(9), 096016
(2011). http://dx.doi.org/10.1117/1.3626212 JBOPFO 1083-3668 Google Scholar
Z. GuoS. HuL. V. Wang,
“Calibration-free absolute quantification of optical absorption coefficients using acoustic spectra in 3D photoacoustic microscopy of biological tissue,”
Opt. Lett., 35
(12), 2067
–2069
(2010). http://dx.doi.org/10.1364/OL.35.002067 OPLEDP 0146-9592 Google Scholar
Z. Guoet al.,
“Quantitative photoacoustic microscopy of optical absorption coefficients from acoustic spectra in the optical diffusive regime,”
J. Biomed. Opt., 17
(6), 066011
(2012). http://dx.doi.org/10.1117/1.JBO.17.6.066011 JBOPFO 1083-3668 Google Scholar
|