|
|
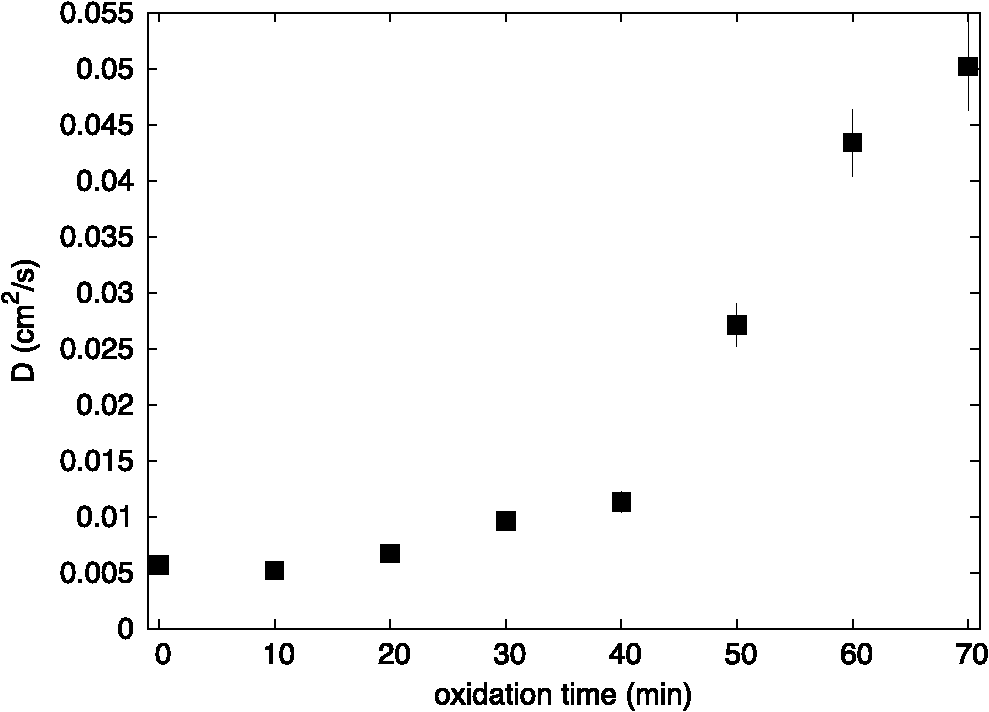
1.IntroductionAtherosclerotic disease is the leading cause of death and morbidity in the western world.1 It is a systemic, dynamic, progressive and essentially inflammatory disease. Since Steinberg and colleagues in 1989 suggested that modification of low-density lipoprotein (LDL) is involved in atherosclerosis,2 a large number of studies have confirmed the hypothesis that the modification of LDL is the key for the formation and progression of atherosclerotic lesions in humans and experimental animals.3,4 Furthermore, studies have shown that atherosclerosis is associated with higher concentrations of modified LDL (moLDL) in the bloodstream.5,6 Recently, Haka et al.7 used a combination of Raman and fluorescence spectroscopies to investigate the atherosclerotic plaque formation. The difficulty in determine directly the amount of moLDL in the bloodstream, associated with the existence of few techniques for this purpose, led our group to use the -Scan technique (ZS)8,9 and develop a new physical approach for the quantification of moLDL in a sample of LDL isolated from the human blood. The ZS technique was developed with the purpose of measuring the nonlinear optical response of a sample in a simple and direct way. Mainly, it is used to characterize the nonlinear response of inorganic materials,10–12 however, nonlinear optics can play a significant role in the understanding of systems of biological interest. Recently, Vasudevan et al.13 reported an investigation about the death process of red blood cells by using the thermal lens technique. Lapotko et al.14 used this technique to study the diameter, the degree of spatial heterogeneity of light absorbance and laser-induced damage thresholds in various types of cells. Some years ago, we showed that there is a relationship between structural changes in LDL particle and its nonlinear optical response in the thermal time-scale regime (i.e., typical times of ).15 Moreover, we used the ZS to show that patients with periodontal disease had a higher amount of moLDL particles when compared to healthy individuals.16 This conclusion was possible analyzing the amplitude the value of )15 of the peak-to-valley characteristic ZS curve of LDL solutions extracted from those individuals. LDL particles in solution present a value of that depends on this oxidation degree: the higher the oxidation degree, the smaller the value of . Solutions of unmodified LDL (native LDL) present a pronounced ZS optical response with a high value of the parameter . The ZS technique showed to be very sensitive, being able to differentiate solutions of minimally oxidized LDL from solutions of native LDL (naLDL), which cannot be distinguished with the biochemical techniques commonly used. The parameter depends on different sample properties, namely, the thermo-optical coefficient, the density, heat capacity, linear optical absorption coefficient and thermal diffusivity. Despite the experimental fact that this parameter depends on the oxidative degree of the LDL particles, until now, there has not been an understanding of what occurs with the particles during this oxidation process that changes their nonlinear optical response, modifying the value of . This knowledge is important not only from a fundamental point of view, but also may help in the understanding of LDL modification process and eventually propose new therapies. Gómez et. al.,17 showed that the linear absorbance coefficient of LDL solutions decreases (in the range between 250 and 550 nm) with the increasing of sample’s oxidation degree. This decrease could be associated to the consumption of carotenoids during the oxidation process. The decrease in the sample absorbance is one of the responsible factors for the change in the nonlinear optical response. Other candidates to explain the observed behavior are the heat capacity, the thermo-optical coefficient and the thermal diffusivity. All these parameters are related with the nonlinear optical transmittance and influence the value. In this paper, we focus on the different physical parameters of the sample that can influence on the amplitude of the nonlinear optical response. We report on measurements of the density, heat capacity, linear optical absorption coefficient, thermo-optical coefficient and thermal diffusivity of native and in vitro oxidized LDL (oxLDL) solutions. This type of oxidative process mimics, in some extent, what may happen in the human circulatory system.18 Therefore, we aim to determine the role of each of these physical parameters in the nonlinear optical response of LDL samples due to the oxidation process. Different experimental techniques besides the ZS were employed in this study. In particular, in the case of the analysis of the ZS experimental results, we propose a fitting method, which takes into account the time-evolution of the transmittances measured and the typical peak-to-valley curve in the same fitting procedure. We used a high-performance liquid chromatography (HPLC) coupled to UV-Vis and fluorescence detectors to quantify the oxidation products, in particular the hydroperoxides and the -tocopherol, and correlate these quantities with the physical parameters measured. 2.Materials and Methods2.1.Isolation of LDLLDL was isolated from plasma by density differences in a sequential ultracentrifugation process at , at 4°C, using a 75-rotor from Hitachi Ultracentrifuge.19 The obtained solution was dialyzed for 24 h at 4°C against phosphate buffered saline (PBS), pH 7.4. Protein concentration was determined using bicinchoninic acid (BCA) protein assay kit (Pierce, USA) with bovine serum albumin as standard. 2.2.LDL In Vitro Oxidation by Copper IonsIn vitro oxLDL was obtained by incubation of naLDL with 20 μM protein at 37°C.20 The samples were oxidized sequentially from 10 to 90 min, in steps of 10 min. At each predefined time, the oxidation reaction was inhibited with the addition of 1 mM of EDTA to the sample solution. 2.3.SpectrophotometrySpectrophotometry setup was composed by a light source with a deuterium and a halogen lamps, a sample holder and two spectrophotometers from Ocean Optics, model USB4000. The lamps cover the light spectrum between 200 and 1100 nm. In this set-up, light is lead from the source to the sample holder and then to the spectrophotometers by optical fibers. 2.4.RefractometryTo measure the thermo-optical coefficient of the samples we used a refractometer, from Atago, model 3T, connected to a heating/cooling system, from Julabo, model F12. Temperature was varied between 23°C and 46°C. Measurements were performed with only the native and 90 min in vitro oxidized LDL. 2.5.Calorimetry and DensitometryHeat capacity at constant volume () measurements were performed using a Differential Scanner Calorimeter (DSC) from Shimadzu, model DSC-60. Temperature was varied between 25°C and 45°C with a slope of . The density of the samples was measured using pycnometers made of glass, with volumes of approximately 500 μl. 2.6.-Scan TechniqueZS set-up was composed by a continuous-wave (CW) Nd: () laser model Verdi V10 from Coherent, with a Gaussian profile beam. In this set-up the laser beam was chopped at 17 Hz and focused by a 25.4 mm lens with focal distance , which gave a Rayleigh length .21 Transmitted light was collected by a silicon photo detector model PDA36A from THORLABS, positioned at the far field (distance between the beam waist and the detector was about 1500 mm). All samples were measured using sample holders with 200 μm of width. The incident power of the laser on the samples varied between and . The power of the beam was set to obtain the ZS peak-to-valley dependence curve in the limit of the technique, i.e., the normalized transmittance lies between 1.2 and 0.8. For each sample, we measured the time-dependent transmittance in 80 different positions around beam waist. At every position 10 independent measurements were performed. To construct the ZS position-dependent transmittance curve it is necessary to make a normalization using the average time-dependent curve in every position. The normalization used is as follows , where stands for the transmittance measured at the time and position . The value corresponds to the time when the thermal lens effect reaches the steady state. Our set-up allows concomitantly the measurement of the nonlinear optical absorption and refraction. The samples did not present any nonlinear optical absorption in all the experimental conditions investigated. 2.7.HPLC Measurements of HydroperoxidesThe lipid content of both naLDL and oxLDL was extracted according to the Bligh and Dyer method.22 Briefly, methanol and chloroform containing 1 mM butylated hydroxytoluene (BHT) were added to each LDL sample. The resulting mixture was centrifuged at 1000 g for 10 min and the lower phase retrieved. Each sample was concentrated, resuspended in 50 μL and injected in the HPLC. The HPLC method consisted of gradient of water (solvent A) and methanol (solvent ). The gradient was: 90%B for 10 min; 90% to 100% for 1 min; 100% for 19 min; 100% to 90% for 1 min; 90% for 9 min. Determinations were made in a Nexera HPLC system (Shimadzu Co.) equipped with a photo diode array detector. A phenomenex column (Luna C8 ) was used for the separations. The flow was adjusted to and 10 μL was the injection volume. Maximum pressure was . Unoxidized cholesterol esters (Ch) and phospholipids (PL) were monitored in 205 nm. The respective hydroperoxides (ChOOH and PLOOH) were monitored in 235 nm. 2.8.Tocopherol Analyses by HPLCThe antioxidant content of the LDL samples was extracted and analyzed according to the method proposed by Hatam and Clayden.23 Briefly, to 100 μL of each LDL sample a mixture containing NaOH 60%, ethanol and pyrogallol 6% was added. Samples were then incubated for 30 min at 70°C. At the end of this incubation, 1 mL of NaCl 1% and 1 mL of a mixture of ethylacetate:hexane () were added to each sample and the organic phase retrieved. The samples were dried with , resuspended in 100 μL of methanol:ethanol () and injected in the HPLC. The HPLC method consisted of a gradient of water (solvent A) and acetonitrile (solvent ). The gradient was: 10% for 0.5 min; 10% to 85% for 2.5 min; 85% for 3.5 min; 85% to 10% for 0.2 min; 10% for 3.3 min. Determinations were made in the same system as described in Sec. 2.7. A Shim-pack column (XR-ODS ) was used for the separations. The flow was adjusted to in and 10 µL was the injection volume. The -tocopherol content was monitored in 298 nm. 3.Results and DiscussionFigure 1 shows typical (average) time-dependent normalized transmittance curves in two different positions of the sample (naLDL), before and after the focal point. From the set of time-dependent transmittance curves of each sample we construct the ZS characteristic position-dependent normalized transmittance curve (Fig. 2). Our results corroborate the fact that the bigger the oxidation time, the smaller the peak-to-valley amplitude. The asymmetry observed in some of the ZS curves seems to be caused by experimental errors, since the samples did not show nonlinear optical absorption in the experimental conditions of this work. Fig. 1Typical (average) time-dependent normalized transmittance curves in two different z positions of the sample (naLDL) with the respective fit. The focal point is located at .  Fig. 2Position-dependent normalized transmittance curves as a function of , from native (▵), 60 min (▪) and 90 min (○) copper oxidated LDL samples. Solid and dashed lines are fits with Eq. (4).  The time-dependent and position-dependent transmittance curves can be analyzed by using the thermal-lens model.21 In this framework the normalized time and position-dependent transmittance is written as: where is the Rayleigh length (), is the laser wavelength, and is the spot radius at the beam waist. The parameters and are defined as: where is the beam power in the sample, is the decadic absorbance, is the linear optical absorption coefficient at , is the sample thickness, is the heat capacity at constant pressure, is the thermo-optical coefficient and is the thermal diffusivity.Usually, to analyze the position-dependent normalized transmittance curve, Eq. (1) is written fixing , and there are two fitting parameters, and . In the same way, to analyze the time-dependent normalized transmittance curve at a given position, Eq. (1) is used fixing , and again one has two fitting parameters and . However, the fitting parameters and must be the best to fit the position-dependent and the time-dependent normalized transmittances. At this point, we propose an iterative method to fit all the time and position-dependent transmittance curves at the same time. With this procedure we are able to determine the pair ( and ) that best fit the whole set of curves (about 50 time-dependent curves and 1 position-dependent curve) for each sample investigated. Dr. F. Batalioto, an expert from our group, developed best-fit software to account for this task. Gómez et al. showed that the linear absorption at of a completely oxidized LDL sample solution is much lower than that of a naLDL sample solution.17 Figure 3(a) shows the linear absorption coefficient of the LDL sample solutions as a function of the oxidation time. The naLDL presents a yellowish aspect, which tends to disappear as a function of the oxidation process. Possible responsibles for this are the carotenoids present in the LDL structure, mainly inlaid in the phospholipid monolayer. To verify this hypothesis we measured the carotenoid content in the samples, as a function of the oxidation time, by using the HPLC. Figure 3(b) shows the carotenoids percentage extracted from the LDL solutions and linear absorption of the samples for each oxidation time. We see that the carotenoids are responsible for about 50% of the sample linear absorption, and after 90 min of oxidation, practically all the carotenoids are consumed. Fig. 3(a) Linear absorption coefficient at 532 nm as a function of oxidation time. (b) The percentage of carotenoid content extracted from the LDL solutions (▴) present in the sample and the linear absorption coefficient at 532 nm (□) as a function of the oxidation time. 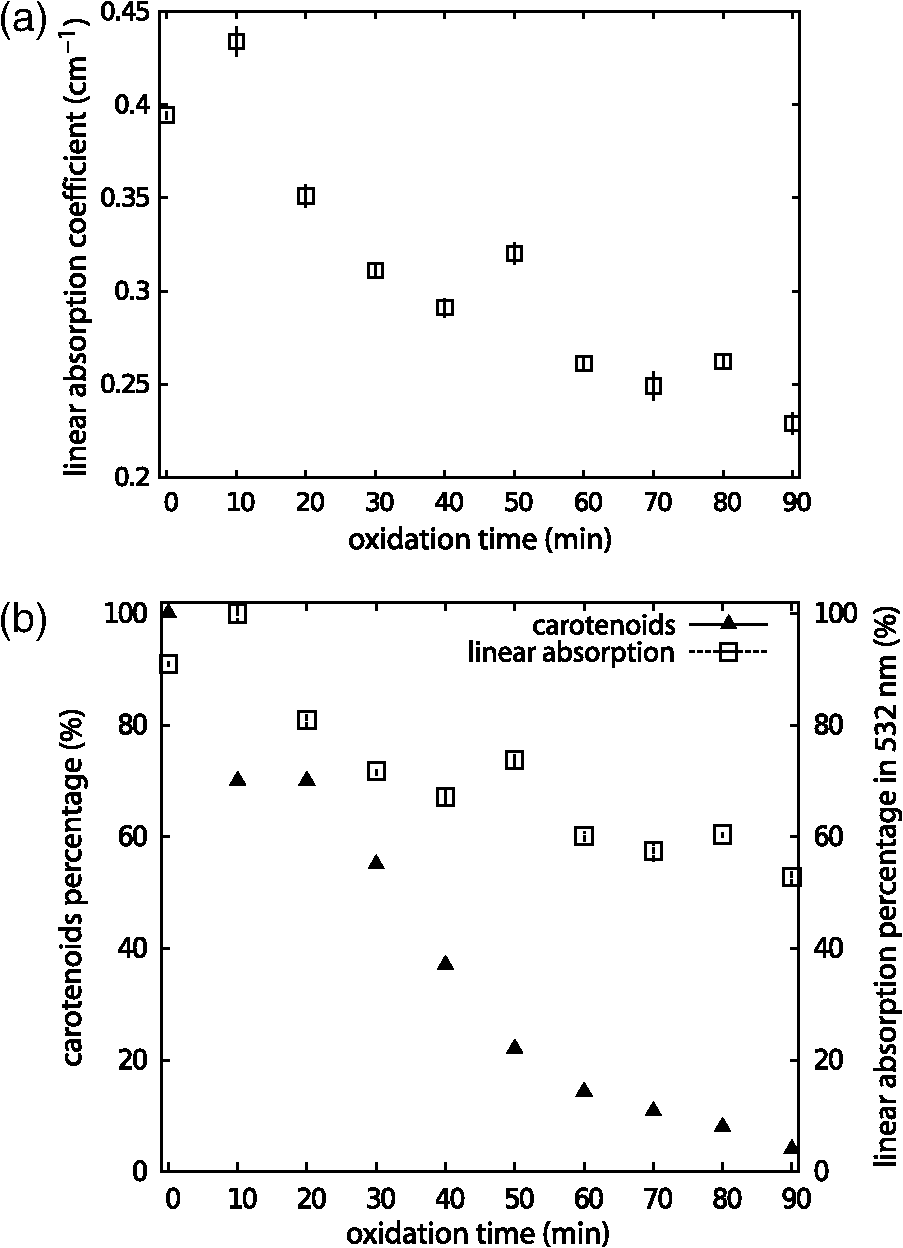 Let us now analyze the samples nonlinear optical response represented by the parameter . If the linear absorption was the only physical parameter, characteristic of the sample, responsible for the variation of [Eq. (2)], should be independent on the oxidation time. Figure 4 shows as a function of the oxidation time for all the samples investigated. As shows a decreasing behavior as a function of the oxidation degree, at least, one more parameter in Eq. (2) is changing with sample’s oxidation degree. The result shown in Fig. 4 must be interpreted at the moment as a tendency of decrease as the oxidation time increases. The actual errors in each measurement of are certainly larger than those depicted in Fig. 4 (obtained only from the fitting procedure). Biological samples are very complexes and the response of them to manipulation may introduce additional variations which increase the errors in the measured parameters. The values of encountered in the fitting process vary from about to , but with large fitting uncertainty, i.e., the curves are less sensitive to variations in this parameter when comparing to the sensitivity in . As the linear optical absorption is not the unique parameter changing with the oxidation time we will focus our attention to the other parameters present in Eq. (2). The measured density, heat capacity at constant volume and thermo-optical coefficient as a function of the oxidation time are shown in Fig. 5(a) to 5(c), respectively. In Eq. (2) the heat capacity at constant pressure () is present. It is reasonable to assume that in our samples (liquid at the SATP) . Figure 5(b) shows that does not present a significant variation as a function of the oxidation time. From these measurements we calculate the mean value for the LDL samples, which is compatible within two standard deviations, with that of water [].24 In the same way, measurements of the density and thermo-optical coefficient presented an almost constant behavior as a function of the sample oxidation time [Fig. 5(a) and 5(b)]. The mean values of these parameters are and . These values are, likewise, compatible with those from water. Fig. 5Experimental results of the (a) density; (b) heat capacity at constant volume; (c) thermo-optical coefficient, of the LDL samples, as a function of the oxidation time. 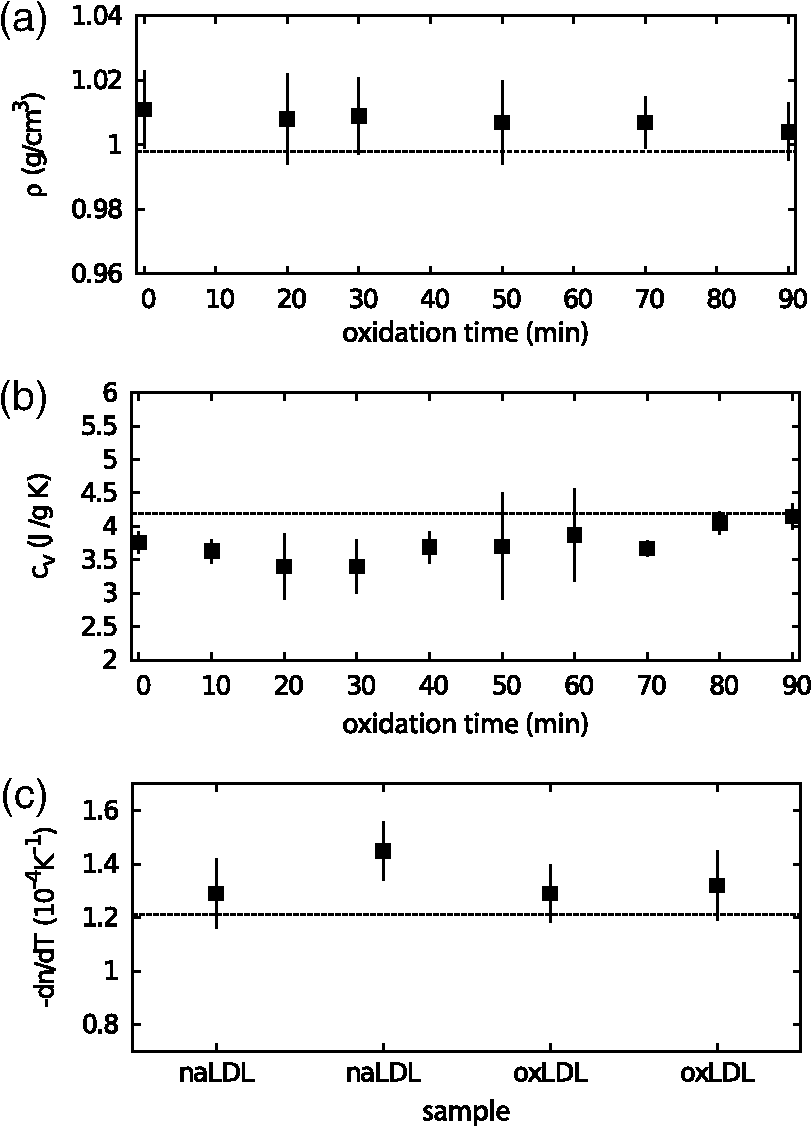 As the parameters ρ, and of LDL solutions were shown to be constants as a function of the oxidation time, the modification of the nonlinear optical response observed in our experiments with the LDL solutions seems to be due to variations in the thermal diffusivity. Taking into account the presence of these parameters in Eq. (2), we will rewrite Eq. (1) explicitly as a function of the thermal diffusivity D, which will be the unique fitting parameter. This procedure is more appropriate for the fitting process since and are not independent parameters [as can be seen in Eqs. (2) and (3)]: To determine D through Eq. (4) we used the same fitting procedure as before, i.e., using the time and position-dependent normalized transmittance curves at the same time. Typical results of the fittings are shown in Figs. 1 and 2. The fit shown in Fig. 2 captures the overall physics of the system, however, the width of the peak and valley in the experiment is larger than that the fitting procedure furnishes. We verified that this deviation should be due to the error in the evaluation of the parameter : The higher the , the bigger the peak and valley widths. However, the amplitude of the nonlinear optical response, represented by the peak-to-valley amplitude does not present a significant variation changing a little the value of . This aspect, which extrapolates the specific problem of the LDL solutions, is being faced by us theoretically, and will be the subject of a future publication. Figure 6 shows the thermal diffusivity as a function of the oxidation time. We observe a tendency of D to increase with the oxidation time. Samples oxidized for 80 and 90 min had very low linear absorption and low nonlinear transmittance. The normalized position-dependent ZS curves of these samples were flat, taking into account the experimental errors on the experimental points measured. In this way we could not determine a peak-to-valley and a reliable diffusivity value for these two samples. For that reason they do not appear in Fig. 6. This result indicates that, with the sample oxidation procedure, the heat absorbed by the medium (mainly the LDL particles) diffuses more efficiently across the sample insofar as the oxidation time increases. In order to understand this process we have investigated the effect of the Cu-induced oxidation on lipid components in the LDL particles. Copper-mediated LDL oxidation process occurs in several steps [see scheme presented in the chemical Eqs. (5) to (10)].25 It initiates with the reaction between and preexisting lipid hydroperoxides (LOOH) generating peroxyl radicals [Eq. (5)]. These peroxyl radicals can react with -tocopherol (a membrane-integrating antioxidant, TOCH) or other lipid molecules (LH) present in the lipoprotein, yielding the respective radical species [Eqs. (6) and (7), respectively]. The reaction of α-tocopherol with peroxyl radicals inhibits the progression of the oxidation. However, when almost all the α-tocopherol content in LDL particle is consumed, the production of conjugated dienes and hydroperoxides begins to accelerate. This is the end of the initiation phase (or the lag stage). The major formation of hydroperoxides occurs in the propagation phase (or the log stage), in which the peroxyl radicals begin to react mostly with other lipid molecules producing more hydroperoxides [Eqs. (7) and (8)]. In addition, ions also can react with lipid hydroperoxides-in a Fenton-type reaction [Eq. (9)]-generating alkoxyl radicals (). These radicals can lead, in a second reaction, to the formation of lipid radicals () [Eq. (10)], which enhances the propagation step and increases the formation of hydroperoxides. The process evolves until the hydroperoxides start to decompose into aldehydes, ketones, hydroxides and hydrocarbonates, reaching a stage, which is called the termination stage.26 This whole process can take several hours. Our ZS experiment shows that the nonlinear optical response of the sample drops to almost zero in less than 2 h, showing that ZS is sensitive to the beginning of the oxidation process. To quantitatively investigate the oxidation process we measured, by using the HPLC, the -tocopherol consumption and the production of both cholesterol ester hydroperoxides (ChOOH) and phospholipids hydroperoxides (PLOOH) along the oxidation process in LDL samples. Figure 7(a) and 7(b) shows an increase in the hydroperoxides content in the sample along with the oxidation time. On the other hand, the -tocopherol content in the samples decreases with increasing oxidation time [Fig. 7(c)]. Most of -tocopherol was consumed within 40 min of incubation and at this time a progressive increase in hydroperoxide content was observed. It is interesting to remark that the production of ChOOH and PLOOH present a time-dependent behavior very similar to that of the thermal diffusivity: a modest increasing rate until oxidation time of about 40 min and after that time a more pronounced increase in their amount. These results suggest a strong correlation between the hydroperoxides production and an increase of the sample’s thermal diffusivity. It is important to point out that PLOOH, ChOOH and some other small molecules (therefore, more mobile in the solution) formed during the lipid peroxidation process can translocate from one LDL particle to another and, thereby, disseminate the oxidative damage.26 This process of exchanging oxidation products between particles increases the heat diffusion across the sample. It is expected that the exchange of ChOOH and PLOOH increase with the oxidation time since more oxidation products are available in the solution. As a consequence of this oxidation products exchange between different LDL particles, the thermal diffusivity measured is expected to increase and the thermal lens response of the sample vanish as the oxidation time increases. Fig. 7(a) Increase of phospholipids hydroperoxides content extracted from LDL solutions as a function of time. (b) Increase of cholesterol ester hydroperoxides content extracted from LDL solutions as a function of time. (c) Decrease of -tocopherol content extracted from LDL solutions as a function of oxidation time. The percentages were calculated considering the final incubation time (90 min) as 100% for phospholipid and cholesterol hydroperoxides. For α-tocopherol the initial time was considered as 100%.  4.ConclusionOur results show that native and oxidized LDL solutions present similar values of density, heat capacity and thermo-optical coefficient. On the other hand, the linear optical absorption decreases as a function of the oxidation time. The -scan experiment was used to measure the thermal diffusivity of native and oxidized LDL solutions with different oxidation times. The thermal diffusivity of oxidized LDL samples was shown to be bigger than that of native samples. The higher the oxidation time, the higher the thermal diffusivity of the sample. The linear optical absorption decrease observed in oxLDL is partially explained by the consumption of LDL’s carotenoids, which is a consequence of lipid peroxidation processes. The increase in the thermal diffusivity, in turn, seems to be related to the production of lipid hydroperoxides. These hydroperoxides, PLOOH and ChOOH, are exchanged among the LDL particles, disseminating the oxidation process and spreading the heat across the sample. This hypothesis is reinforced by the HPLC measurements, in which the production of hydroperoxides correlates itself with the increase in the thermal diffusivity. In this sense, the higher the PLOOH and ChOOH production, the more efficient the heat diffuses across the solution. This phenomenon leads to a faster thermal homogenization at the solution, inhibiting the thermal lens formation observed prior to the LDL oxidation. The results reported herein indicate that the ZS technique can be a complementary tool to estimate the LDL oxidation state in human plasma. AcknowledgmentsAuthors acknowledge Dr. Fernando Batalioto for writing the code of the iterative method-fitting program. This study was supported by The National Counsel for Scientific and Technological Development (CNPq), São Paulo Research Foundation (FAPESP) and National Institute of Science and Technology of Complex Fluid (INCT-FCx) and Redoxoma (INCT-Redoxoma). ReferencesA. D. Lopezet al.,
“Global and regional burden of disease and risk factors, 2001: systematic analysis of population health data,”
Lancet, 367
(9524), 1747
–1757
(2006). http://dx.doi.org/10.1016/S0140-6736(06)68770-9 LANCAO 0140-6736 Google Scholar
D. Steinberget al.,
“Beyond cholesterol. Modifications of low-density lipoprotein that increase its atherogenicity,”
N. Engl. J. Med., 320
(14), 915
–924
(1989). http://dx.doi.org/10.1056/NEJM198904063201407 NEJMAG 0028-4793 Google Scholar
R. Stockeret al.,
“Role of oxidative modifications in atherosclerosis,”
Physiol. Rev., 84
(4), 1381
–1478
(2004). http://dx.doi.org/10.1152/physrev.00047.2003 PHREA7 0031-9333 Google Scholar
J. L. Witztumet al.,
“The oxidative modification hypothesis of atherosclerosis: does it hold for humans?,”
Trends. Cardiovasc. Med., 11
(3–4), 93
–102
(2001). http://dx.doi.org/10.1016/S1050-1738(01)00111-6 TCMDEQ 1050-1738 Google Scholar
S. Eharaet al.,
“Elevated levels of oxidized low density lipoprotein show a positive relationship with the severity of acute coronary syndromes,”
Circulation, 103
(15), 1955
–1960
(2001). http://dx.doi.org/10.1161/01.CIR.103.15.1955 CIRCAZ 0009-7322 Google Scholar
P. Holvoetet al.,
“Circulating oxidized LDL is a useful marker for identifying patients with coronary artery disease,”
Arterioscler. Thromb. Vasc. Biol., 21
(5), 844
–848
(2001). http://dx.doi.org/10.1161/01.ATV.21.5.844 ATVBFA 1079-5642 Google Scholar
A. S. Hakaet al.,
“Mechanism of ceroid formation in atherosclerotic plaque: in situ studies using a combination of Raman and fluorescence spectroscopy,”
J. Biomed. Opt., 16
(1), 011011
(2011). http://dx.doi.org/10.1117/1.3524304 JBOPFO 1083-3668 Google Scholar
M. Sheik-Bahaeet al.,
“High-sensitivity, single-beam measurements,”
Opt. Lett., 14
(17), 955
–957
(1989). http://dx.doi.org/10.1364/OL.14.000955 OPLEDP 0146-9592 Google Scholar
M. Sheik-Bahaeet al.,
“Sensitive measurement of optical nonlinearities using a single beam,”
IEEE J. Quantum Electron., 26
(4), 760
–769
(1990). http://dx.doi.org/10.1109/3.53394 IEJQA7 0018-9197 Google Scholar
B. Guet al.,
“Determination of the nonlinear refractive index in multiphoton absorbers by Z-scan measurements,”
J. Opt. Soc. Am. B, 27
(11), 2438
–2442
(2010). http://dx.doi.org/10.1364/JOSAB.27.002438 JOBPDE 0740-3224 Google Scholar
S. Liuet al.,
“Optical nonlinear absorption characteristics of crystalline thin films,”
J. Appl. Phys., 110
(3), 033503
(2011). http://dx.doi.org/10.1063/1.3614501 JAPIAU 0021-8979 Google Scholar
T. R. Tsaiet al.,
“Nonlinear optical properties of lanthanum-modified lead zirconate titanate investigated by the femtosecond Z-scan technique,”
Appl. Phys. Lett., 99
(24), 241101
(2011). http://dx.doi.org/10.1063/1.3668099 APPLAB 0003-6951 Google Scholar
S. Vasudevanet al.,
“Application of thermal lens response to monitor health status of red blood cells: a quantitative study of the cell death process by extracting thermal diffusivity and size,”
Appl. Phys. Lett., 96
(11), 113703
(2010). http://dx.doi.org/10.1063/1.3366723 APPLAB 0003-6951 Google Scholar
D. Lapotkoet al.,
“Photothermal responses of individual cells,”
J. Biomed. Opt., 10
(1), 014006
(2005). http://dx.doi.org/10.1117/1.1854685 JBOPFO 1083-3668 Google Scholar
S. L. Gómezet al.,
“Cu and Fe metallic ions-mediated oxidation of low-density lipoproteins studied by NMR, TEM and Z-scan technique,”
Chem. Phys. Lipids, 163
(6), 545
–551
(2010). http://dx.doi.org/10.1016/j.chemphyslip.2010.03.008 CPLIA4 0009-3084 Google Scholar
A. M. Monteiroet al.,
“Cardiovascular disease parameters in periodontitis,”
J. Periodontol, 80
(3), 378
–388
(2009). http://dx.doi.org/10.1902/jop.2009.080431 JOPRAJ 0022-3492 Google Scholar
S. L. Gómezet al.,
“Characterization of native and oxidized human low-density lipoproteins by Z-scan technique,”
Chem. Phys. Lipids, 132
(2), 185
–195
(2004). http://dx.doi.org/10.1016/j.chemphyslip.2004.07.001 CPLIA4 0009-3084 Google Scholar
I. Levitanet al.,
“Oxidized LDL: diversity, patterns of recognition, and pathophysiology,”
Antioxid. Redox Signal., 13
(1), 39
–75
(2010). http://dx.doi.org/10.1089/ars.2009.2733 ARSIF2 1523-0864 Google Scholar
R. J. Havelet al.,
“The distribution and chemical composition of ultracentrifugally separeted lipoproteins in human serum,”
J. Clin. Invest., 34
(9), 1345
–1353
(1955). http://dx.doi.org/10.1172/JCI103182 JCINAO 0021-9738 Google Scholar
E. C. Fernviket al.,
“The autoantibody repertoire against copper- or macrophage-modified LDL differs in normolipidemics and hypercholesterolemic patients,”
J. Clin. Immunol., 24
(2), 170
–176
(2004). http://dx.doi.org/10.1023/B:JOCI.0000019782.67993.0b JCIMDO 0271-9142 Google Scholar
C. A. Carteret al.,
“Comparison of models describing the thermal lens effect,”
Appl. Opt., 23
(3), 476
–481
(1984). http://dx.doi.org/10.1364/AO.23.000476 APOPAI 0003-6935 Google Scholar
E. G. Blighet al.,
“A rapid method of total lipid extraction and purification,”
Can. J. Biochem. Physiol., 37
(8), 911
–917
(1959). http://dx.doi.org/10.1139/o59-099 CJBPAZ 0576-5544 Google Scholar
L. J. Hatamet al.,
“A high-performance liquid chromatographic method for the determination of tocopherol in plasma and cellular elements of the blood,”
J. Lipid Res., 20
(5), 639
–645
(1979). JLPRAW 0022-2275 Google Scholar
D. R. Lide, Handbook of Chemistry and Physics, CRC Press, Boca Raton, Florida
(1998). Google Scholar
H. Esterbaueret al.,
“The role of lipid peroxidation and antioxidants in oxidative modification of LDL,”
Free Radic. Biol. Med., 13
(4), 341
–390
(1992). http://dx.doi.org/10.1016/0891-5849(92)90181-F FRBMEH 0891-5849 Google Scholar
A. W. Girotti,
“Translocation as a means of disseminating lipid hydroperoxide-induced oxidative damage and effector action,”
Free Radic. Biol. Med., 44
(6), 956
–968
(2008). http://dx.doi.org/10.1016/j.freeradbiomed.2007.12.004 FRBMEH 0891-5849 Google Scholar
|