
|
|
1.IntroductionNeurovascular diseases, such as stroke and Alzheimer’s disease (AD), have become a serious social issue these days. In this regard, it has become increasingly important to measure both neuronal activity and cortical hemodynamics. Among a variety of noninvasive neuronal imaging techniques for the human brain, both electroencephalography (EEG) and magnetoencephalography (MEG)1 can directly measure neuronal activity with time resolution below one millisecond. EEG is obviously the simplest and the most convenient neuronal imaging technique; however, its spatial resolution is low in principle owing to the inhomogeneous electrical conductivity in the human head, which consists of different kinds of tissues, such as, brain, blood vessel, cerebrospinal fluid, skull, scalp, and hair. On the other hand, MEG is better than EEG in terms of spatial resolution because of the homogeneous magnetic permeability in the human head. Moreover, MEG allows noncontact measurement, while EEG requires electrodes attached to the scalp. In contrast to MEG and EEG, functional magnetic-resonance imaging (fMRI) and near-infrared spectroscopy (NIRS)23.4.–5 can measure cortical hemodynamics caused by neuronal activity. The greatest strength of fMRI is its high spatial resolution in the whole brain, including the deep brain. NIRS, which is similar to EEG in terms of its portable hardware and light probes, is suitable for measuring cortical hemodynamics. Understanding neurovascular coupling (NVC), which is the correlation between neuronal activity and cortical hemodynamics, is an important factor in shedding light on the mechanism of a variety of brain functions and neuronal diseases.6,7 NVC has been widely studied by simultaneously measuring neuronal activity and cortical hemodynamics using two or more modalities.8 For example, Logothetis et al. simultaneously measured fMRI and a few kinds of extracellular potentials of a monkey and found that the origin of the blood oxygen level dependent (BOLD) signal is not spikes but local field potentials, or synapses.9 When it comes to focusing on NVC in the human brain, noninvasiveness is required. In accordance with this requirement, neuronal activity should be measured by using EEG or MEG, and cortical hemodynamic response should be obtained by using fMRI or NIRS. As for combining these modalities for NVC measurement, there are four combinations, as listed in Table 1. Among these combinations, a high-field fMRI and MEG are obviously incompatible. The combination of EEG and fMRI has been widely reported in NVC studies;10 however, in this case, electromagnetic interference between these measurements is an obstacle. Table 1Simultaneous measurement of neuronal and hemodynamic responses in the human brain by EEG, MEG, fMRI, and NIRS.
On the other hand, NIRS is compatible with both EEG and MEG, because it is based on optical measurement.11,12 In addition, MEG and NIRS are sensitive to local neuronal and hemodynamic responses, respectively, and the compatibility of the two modalities is thus favorable. Simultaneous measurement of neuronal activity and cortical hemodynamics using MEG and NIRS has been reported by only a few groups so far. For example, a neuronal activity and cortical hemodynamics from motor-evoked responses were measured by using DC-MEG and NIRS with prism probe.13 Moreover, those from somatosensory responses were measured by using whole-head MEG and NIRS with thin (10-mm thickness) probe.14 A whole-head MEG system, in which more than one hundred superconducting quantum interference device (SQUID)15 sensors are arranged surrounding the subject’s head, has been hitherto commercialized by several companies. Taking advantage of the multi-channel sensing, this type of MEG system is aimed at imaging the neuronal activity in the cerebral cortex. On the other hand, an MEG system is available at only a small number of hospitals or research institutes due to its huge cost (several million dollars) and its large footprint (more than ). An MEG system with smaller size and lower cost than a conventional MEG system is therefore required. Accordingly, we previously developed an unshielded bilateral MEG system using a new type of gradiometer based on a low- SQUID.16 Its cost is less than half a conventional MEG system with a magnetically shielded room (MSR), and its footprint is less than a third. In the present study, we aimed to develop a simultaneous measurement system based on unshielded MEG and NIRS. The developed system has no MSR and is therefore small, open, and low-cost, compared to the previous system using a conventional MEG with an MSR. The present study focused on auditory responses because it is reported that auditory-evoked magnetic field components such as the N100 m are important indicators of cognitive dysfunction. For example, it has been reported that N100 m latency is significantly delayed in patients with AD17 and dementia.18 Moreover, patients with Down syndrome (DS) significantly delay and attenuate the intensity of N100 m and delay without attenuating the intensity of P50 m responses over both hemispheres.19 Cognitive dysfunction in these diseases has been thought to be associated with degeneration of the cholinergic system. It has also been reported that auditory-evoked magnetic field latencies of the P50 m and N100 m are modulated by scopolamine, which temporarily blocks the cholinergic system.20,21 On the other hand, a variety of NIRS studies with regard to cognitive dysfunction have been reported.22 In this context, studying NVC using MEG and NIRS is one of the most appropriate methods for shedding light on human cognitive dysfunction. 2.Method2.1.NIRS ProbesThere are two requirements for optical probes in the case of combining NIRS with MEG. The first requirement is that optical probes should be nonmagnetic because optical probes using magnetic material such as steel obviously generate much greater magnetic noise than MEG signals do. The second requirement is a thin shape for minimizing the gap between the MEG sensor and head, because the intensity of MEG signals drastically decreases as the gap increases. With regard to the first requirement, for a conventional NIRS probe, as shown in Fig. 1(a), an L-shaped metallic part for reinforcing optical fiber and a metallic spring part for attachment of probe are used. In the present study, we moved a conventional NIRS probe at a distance of about 10 cm from SQUID gradiometers and it was experimentally confirmed that a conventional NIRS probe generates magnetic-field noise of more than a few hundred picotesla, which is more than one thousand times larger than the strength of the MEG signals, due to its movement. It was therefore concluded that these metallic parts interfere with MEG measurements and should be removed for simultaneous measurement by MEG and NIRS. As for the second requirement, thickness of a conventional NIRS probe is 40 mm, which should be reduced as much as possible. Fig. 1(a) Conventional NIRS probe. (b) Nonmagnetic thin NIRS probe 12 mm in diameter and 5 mm in thickness, including a tip 3 mm in diameter and 1 mm in length. (c) Probe configuration.  In view of these requirements, we developed nonmagnetic thin NIRS probes, as shown in Fig. 1(b). The NIRS probes are 12 mm in diameter and only 5 mm in thickness. The fiber is also L-shaped, but no metallic parts are used. This structure enables the gap between the head and the outer surface of the cryostat less than 10 mm. Four incident nonmagnetic thin NIRS probes (sources) and four detection nonmagnetic thin NIRS probes (detectors), which were arranged alternately, separated by 30 mm, in a lattice pattern, were fixed on a flexible plastic sheet and then attached to the head by a rubber band. This configuration resulted in 10 measurement positions, each corresponding to the midpoint between a source-detector pair, as shown in Fig. 1(c). 2.2.System ConfigurationThe simultaneous measurement system based on unshielded MEG and NIRS is shown in Fig. 2(a). The optical fibers are 5 m in length and the NIRS system is located about 3 m apart from the unshielded MEG system to avoid interference of electromagnetic noise from the NIRS system. Figure 2(b) shows configuration of the simultaneous measurement system. The bilateral unshielded MEG system uses four two-dimensional (2D) gradiometers and two symmetric cryostats.16 The gantry is 1.5 m wide, 2.3 m tall, and 1.0 m deep, and the total footprint of the MEG system, including a chair, a signal processing unit, and a personal computer, is no more than , which is about one third of the footprint of a conventional MEG system with an MSR. The cryostats can be symmetrically positioned in three directions: vertical, horizontal, and rotational. This configuration makes it possible to detect bilateral neuronal activity in the cerebral cortex. An acoustic stimulator is connected to both the MEG and the NIRS systems to synchronize timing of the both systems. The acoustic stimulation was delivered by using nonmagnetic earphones with plastic tubes. Fig. 2(a) Photograph and (b) configuration of simultaneous measurement system based on unshielded MEG and NIRS. (c) Photograph of a pair of SQUID gradiometers used in this study. (d) Schematic of a pair of gradiometer pickup coils. 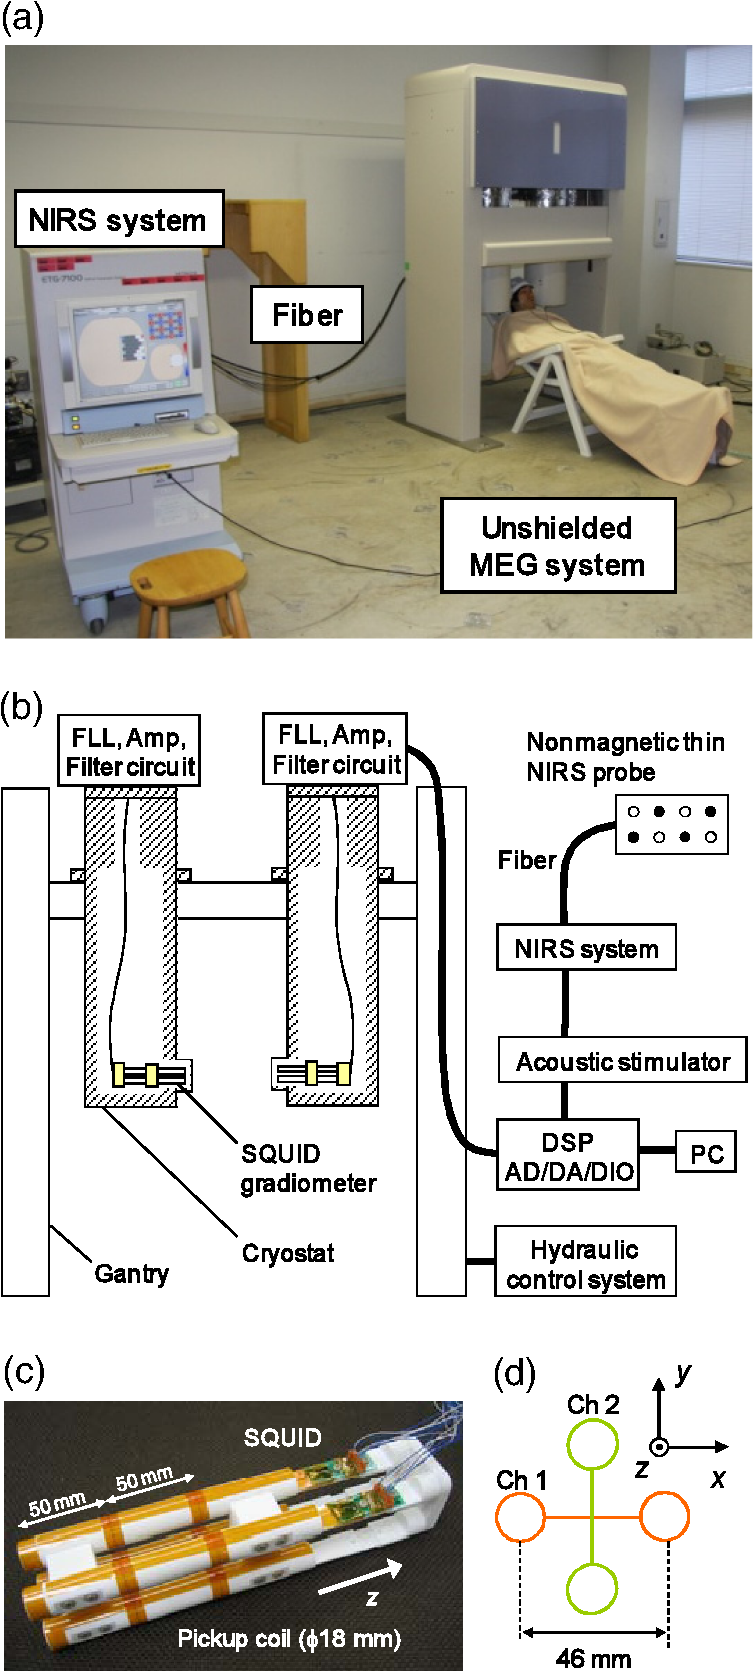 A photograph of the pair of SQUID gradiometers used in this system is shown in Fig. 2(c). Each SQUID gradiometer consists of a niobium-based conventional dc SQUID and a wire-wound pickup coil. The pickup coil detects a magnetic-field gradient in two orthogonal directions, or , and reduces environmental magnetic-field noise by more than 50 dB.23 The sensitivity of the gradiometers is about . The planar baseline and axial baseline of the gradiometer are 46 and 50 mm, respectively, and each coil is 18 mm in diameter. The planar arrangements of the two pickup coils are perpendicular to each other, as shown in Fig. 2(c). In addition, the gradiometers are cooled by liquid helium in a cryostat and operated by a direct-coupled flux-locked-loop (FLL) circuit fixed on the cryostat. The distance between the bottom pickup loop and the outer surface of the cryostat is 8 mm to achieve high signal intensity. The cryostat is coated by conductive material to shield high-frequency electromagnetic fields, which degrade SQUID performances. The probes were connected to an NIRS system (ETG-7100, Hitachi Medical Corporation, Japan), which simultaneously irradiates light with wavelengths of 695 and 830 nm through an optical fiber to one irradiation point. The average power of each light source was 2.0 mW, and each source was modulated at a distinctive frequency (1 to 10 kHz) to enable them to be separated by a lock-in amplifier after detection. The transmitted light was detected every 100 ms with an avalanche photodiode through an optical fiber located 30 mm from the incident position. 2.3.Simultaneous Measurement of Neuronal Activity and Cortical HemodynamicsThe combined system was used to simultaneously measure the auditory-evoked magnetic field and hemodynamic response of 12 subjects. Auditory stimulation was performed by using 30 cycles of block design (30 s stimulation and 30 s rest). Specifically, a 1-kHz-tone burst of 100 ms duration was applied to the both ears at a frequency of 1 Hz during each 30 s stimulation period, as shown in Fig. 3(a). Fig. 3(a) Experimental setup of simultaneous measurement of auditory responses of neuronal activity and cortical hemodynamics by unshielded MEG and NIRS. Configuration of (b) NIRS probes and (c) MEG pickup coils.  MEG data were acquired at a sampling rate of 1 kHz and passed through band-pass filtering at 0.1 to 50 Hz and comb filtering to eliminate power-line noise in real time. On the other hand, NIRS data were acquired at a sampling rate of 10 Hz and were passed through band-pass filtering at 0.01 to 0.5 Hz. As for sensor positioning, the international 10 to 20 system, which is usually used for the EEG electrode arrangement, was used. Specifically, both the lower right NIRS incident probe and the center of the bottom loops of a pair of SQUID gradiometers were positioned at T4 (right auditory area) of a subject, as shown in Figs. 3(b) and 3(c). According to a dual-wavelength analysis based on the modified Beer-Lambert law, the concentration changes of oxy-hemoglobin (“oxy”), deoxy-hemoglobin (“deoxy”), and total hemoglobin (“total”) are approximately obtained using the logarithms of the intensity changes , and absorption coefficients of oxy-hemoglobin , and deoxy-hemoglobin for two wavelengths, and . 3.Experimental ResultsFigures 4(a) to 4(d) show four typical examples of both auditory-evoked magnetic field measured by using the pair of 2-D gradiometers (left) and hemoglobin-concentration change measured by using the nonmagnetic thin probes (right). Both MEG and NIRS data were obtained by averaging over trials. According to the MEG results, the N100 m (i.e., the magnetic counterpart of electric N100) peak, which appears about 100 ms after the onset of the auditory stimulus, is clearly detected for all the 12 subjects. Moreover, N100 m peak is positive at channel 1 and negative at channel 2 for all the subjects. Fig. 4Simultaneous measurement of neuronal and hemodynamic responses by MEG and NIRS. Auditory-evoked field measured by using a pair of two-dimensional gradiometers (left) and hemoglobin concentration change measured by nonmagnetic thin probes (right). (a) to (d) correspond to subjects 1, 6, 8, and 11 listed in Table 2. 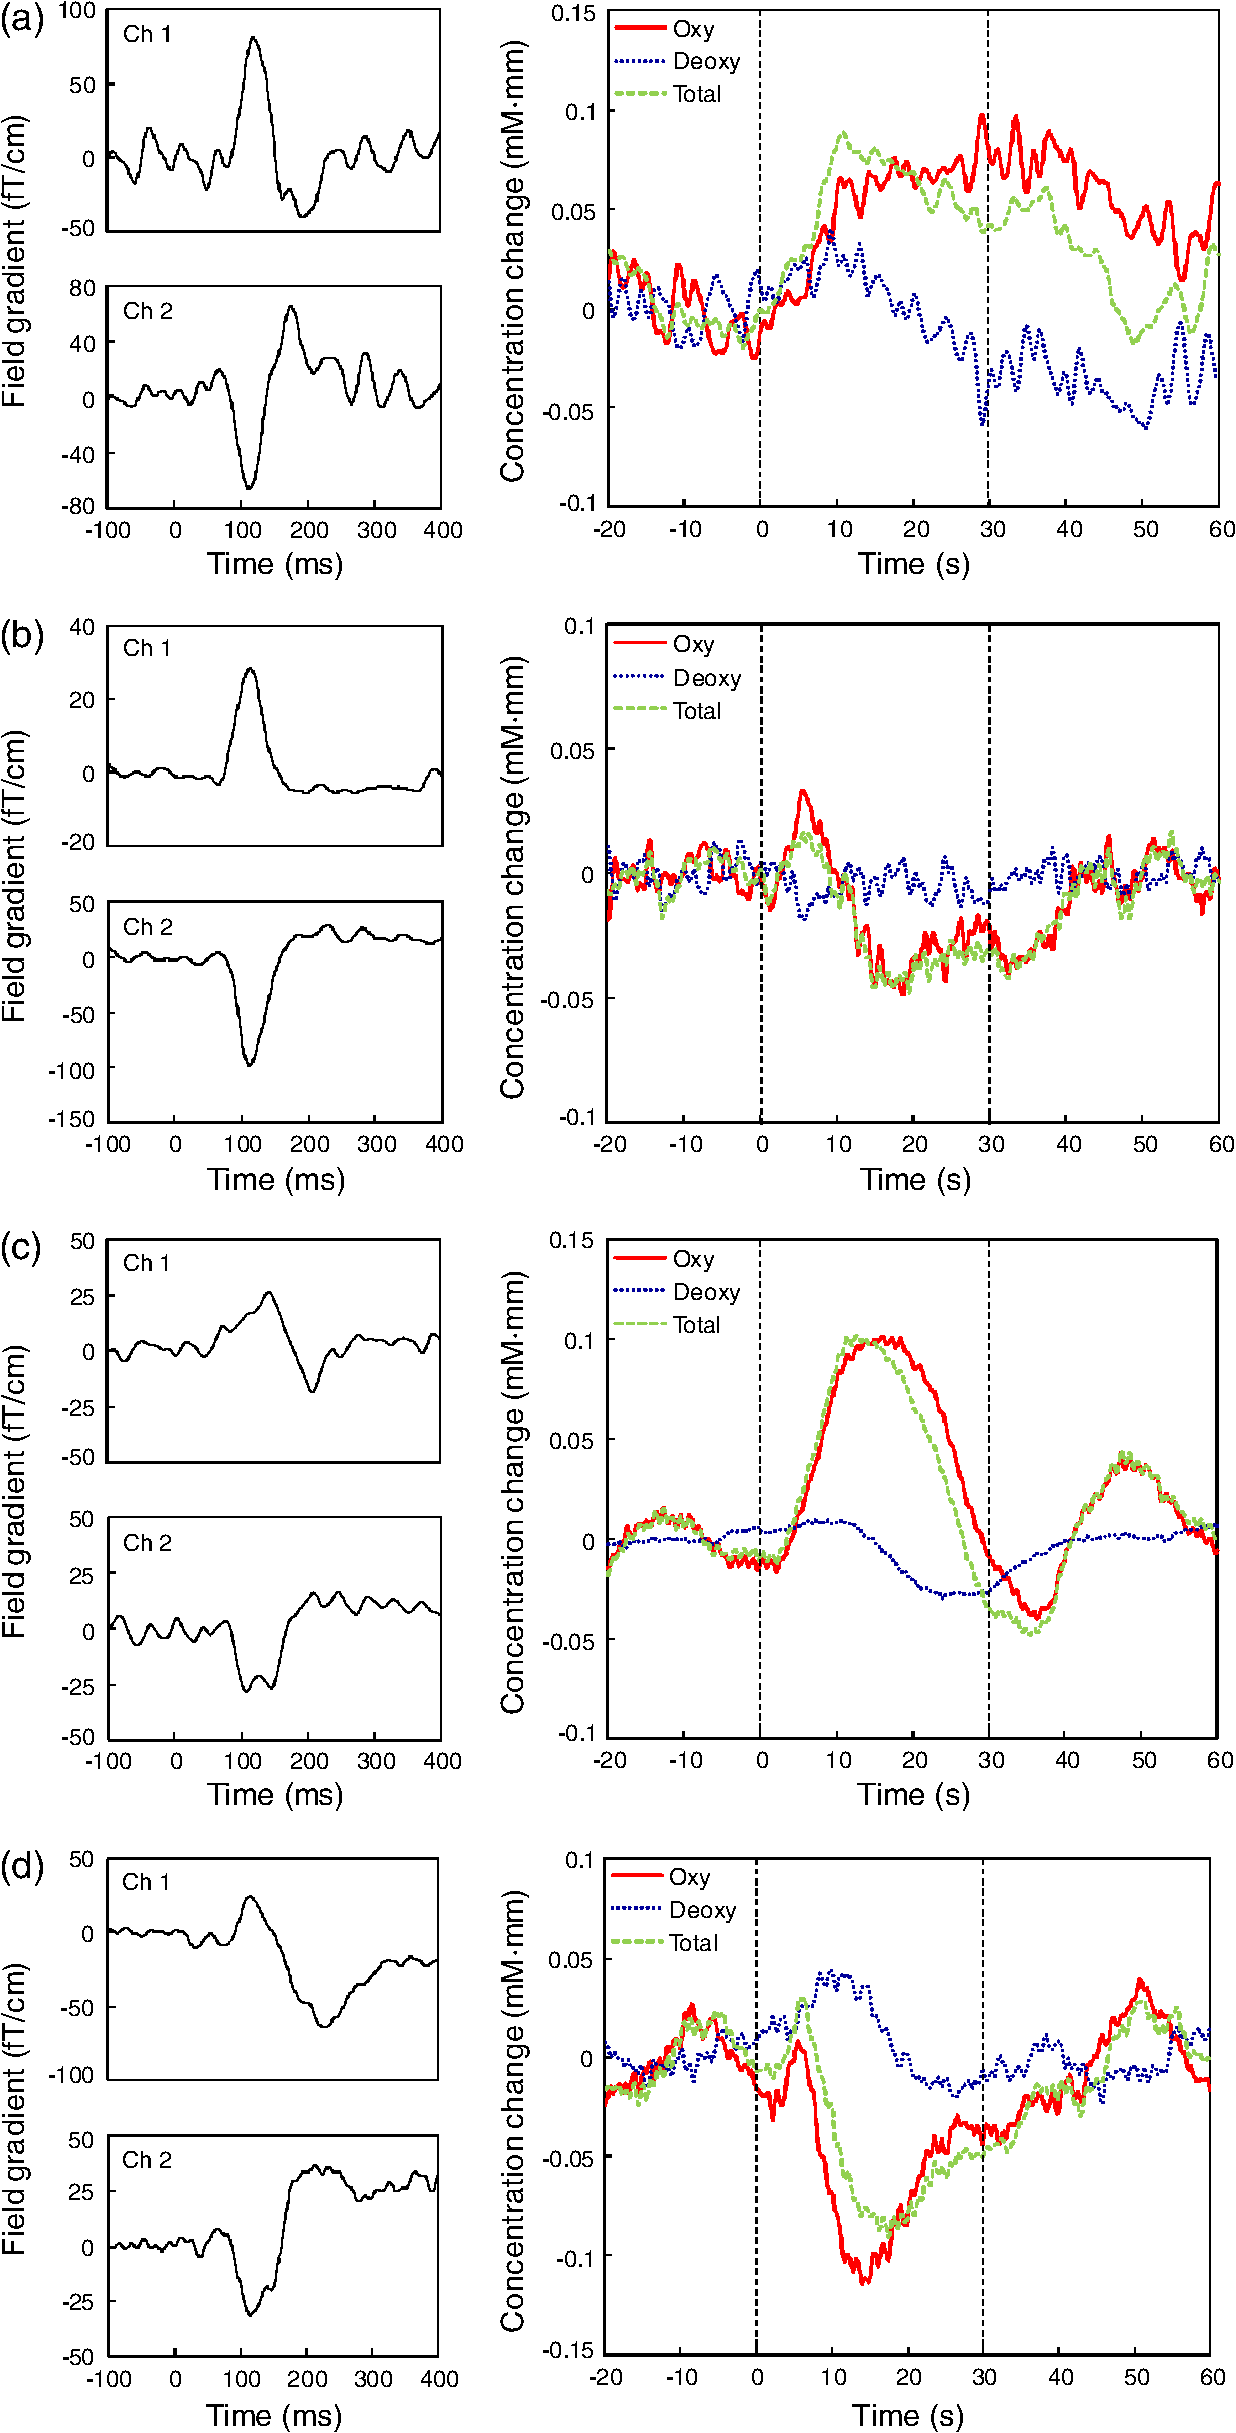 As for the NIRS data, the behavior of each hemoglobin-concentration is different from one another unlike the MEG data. Therefore, we calculated -values to determine whether the hemoglobin concentration significantly changes in the stimulation period or not compared to that in the rest period. Specifically, -values were obtained by statistically comparing 5 s moving average for every 1 s in the stimulation period to 5 s average from to 0 s in the rest period. Table 2 shows maximum or minimum -values and its time (shown in the bracket) obtained by comparing resting and stimulating period for the concentration changes of oxy, deoxy, and total hemoglobin. Obvious artifacts were eliminated for averaging, and trial (averaging) number for each subject is also listed on the table. According to the paired -test (degrees of freedom is trial number minus one), at least one parameters among oxy, deoxy, and total hemoglobin-concentration changes (namely, cortical blood flow) significantly change during the stimulation period (0 to 30 s) for all the 12 subjects. Table 2Maximum or minimum t-values and its time (shown in the bracket) obtained by comparing resting and stimulating period for the concentration changes of oxy, deoxy, and total hemoglobin. Time axis is given in Fig. 4. Bold number with asterisk shows a significantly large or small value judged by paired t-test (degrees of freedom is trial number minus one).
4.DiscussionThe developed MEG system has a pair of SQUID gradiometers on a side. Each pair of SQUID gradiometers can detect not only MEG waveform but also quasi neuronal current (, ) using the following equation:16,24 where and are magnetic fluxes detected by pickup coils channel 1 and channel 2. As described in the Sec. 3, the polarities of and are always positive and negative respectively for all the 12 subjects. Therefore, direction of the neuronal current of N100 m can be estimated to be backward and downward, which is in good agreement with a well-known fact.25,26On the other hand, this system is not aimed at mapping the neuronal activity, or finding localization of a source because of the small number of sensors. However, the gradiometer design does not limit the number of sensors; therefore, it is possible to make an unshielded whole head MEG system by arranging multiple 2-D gradiometer pairs. As shown in Fig. 4, neuronal responses are fast, usually less than one second, while hemodynamic responses are slow, usually more than several seconds. It is thus difficult to compare both responses and to understand NVC. However, it is possible to understand NVC by using a correlation function between the neuronal and hemodynamic responses. For example, Ou et al. evaluated the contribution of a single neural component to the hemodynamic responses.14 NIRS studies with auditory cortex activation have been also reported for both adults27–29 and infants.30,31 These studies are mainly based on linguistic viewpoint. On the other hand, this study focuses on simple auditory stimuli. That may be the reason why some NIRS data shows deactivation, namely, decrease in oxy hemoglobin or increase in deoxy hemoglobin, as shown in Fig. 4 and listed in Table 2. The tip of the NIRS probe shown in Fig. 1(b) is 3 mm in diameter and 1 mm in length, which makes it difficult for the tip to be tightly attached to the scalp covered with a large amount of hair. Therefore, it may be favorable that the tip would be about 3 mm. 5.Concluding RemarksA simultaneous measurement system based on a combination of unshielded MEG and NIRS was developed and used to simultaneously measure an auditory-evoked field and increased cortical blood flow. It was experimentally demonstrated that the combination of unshielded MEG and NIRS can simultaneously measure neuronal activity and cortical hemodynamics. The combined system will be useful for studying neurovascular disease such as stroke and AD. AcknowledgmentsThe authors thank Hiroki Sato, Takushige Katsura, and Hirokazu Tanaka for their productive discussions. ReferencesM. S. Hämäläinenet al.,
“Magnetoencephalography—theory, intrumentation, and applications to noninvasive studies of the working human brain,”
Rev. Mod. Phys., 65
(2), 413
–497
(1993). http://dx.doi.org/10.1103/RevModPhys.65.413 RMPHAT 0034-6861 Google Scholar
F. F. Jöbsis,
“Noninvasive, infrared monitoring of cerebral and myocardial oxygen sufficiency and circulatory parameters,”
Science, 198
(4323), 1264
–1267
(1977). http://dx.doi.org/10.1126/science.929199 SCIEAS 0036-8075 Google Scholar
A. Makiet al.,
“Spatial and temporal analysis of human motor activity using noninvasive NIR topography,”
Med. Phys., 22
(12), 1997
–2005
(1995). http://dx.doi.org/10.1118/1.597496 MPHYA6 0094-2405 Google Scholar
H. Koizumiet al.,
“Higher-order brain function analysis by trans-cranial dynamic near-infrared spectroscopy imaging,”
J. Biomed. Opt., 4
(4), 403
–413
(1999). http://dx.doi.org/10.1117/1.429959 JBOPFO 1083-3668 Google Scholar
M. FerrariV. Quaresima,
“A brief review on the history of human functional near-infrared spectroscopy (fNIRS) development and fields of application,”
Neuroimage,
(2012). NEIMEF 1053-8119 Google Scholar
C. Iadecola,
“Neurovascular regulation in the normal brain and in Alzheimer’s disease,”
Nat. Rev. Neurosci., 5
(5), 347
–360
(2004). http://dx.doi.org/10.1038/nrn1387 NRNAAN 1471-0048 Google Scholar
H. GirouardC. Iadecola,
“Neurovascular coupling in the normal brain and in hypertension, stroke, and Alzheimer disease,”
J. Appl. Physiol., 100
(1), 328
–335
(2006). http://dx.doi.org/10.1152/japplphysiol.00966.2005 JAPYAA 0021-8987 Google Scholar
O. J. ArthursS. Boniface,
“How well do we understand the neural origins of the fMRI BOLD signal?,”
TRENDS Neurosci., 25
(1), 27
–31
(2002). http://dx.doi.org/10.1016/S0166-2236(00)01995-0 TNSCDR 0166-2236 Google Scholar
N. K. Logothetiset al.,
“Neurophysiological investigation of the basis of the fMRI signal,”
Nature, 412
(6843), 150
–157
(2001). http://dx.doi.org/10.1038/35084005 NATUAS 0028-0836 Google Scholar
D. Mantiniet al.,
“Complete artifact removal for EEG recorded during continuous fMRI using independent component analysis,”
Neuroimage, 34
(2), 598
–607
(2007). http://dx.doi.org/10.1016/j.neuroimage.2006.09.037 NEIMEF 1053-8119 Google Scholar
H. Obriget al.,
“Habituation of the visually evoked potential and its vascular response: implications for neurovascular coupling in the healthy adult,”
Neuroimage, 17
(1), 1
–18
(2002). http://dx.doi.org/10.1006/nimg.2002.1177 NEIMEF 1053-8119 Google Scholar
A. C. Ehliset al.,
“Cortical correlates of auditory sensory gating: a simultaneous near-infrared spectroscopy event-related potential study,”
Neuroscience, 159
(3), 1032
–1043
(2009). http://dx.doi.org/10.1016/j.neuroscience.2009.01.015 Google Scholar
B. M. Mackertet al.,
“Dynamics of cortical neurovascular coupling analyzed by simultaneous DC-magnetoencephalography and time-resolved near-infrared spectroscopy,”
Neuroimage, 39
(3), 979
–986
(2008). http://dx.doi.org/10.1016/j.neuroimage.2007.09.037 NEIMEF 1053-8119 Google Scholar
W. Ouet al.,
“Study of neurovascular coupling in humans via simultaneous magnetoencephalography and diffuse optical imaging acquisition,”
Neuroimage, 46
(3), 624
–632
(2009). http://dx.doi.org/10.1016/j.neuroimage.2009.03.008 NEIMEF 1053-8119 Google Scholar
The SQUID Handbook, Vol. II Applications of SQUIDs and SQUID Systems, Wiley-VCH Verlag GmbH & Co. KGaA, Weinheim, Germany
(2004). Google Scholar
Y. Sekiet al.,
“Unshielded bilateral magnetoencephalography system using two-dimensional gradiometers,”
Rev. Sci. Instrum., 81
(9), 096103
(2010). http://dx.doi.org/10.1063/1.3482154 RSINAK 0034-6748 Google Scholar
E. Pekkonenet al.,
“Impaired preconscious auditory processing and cognitive functions in Alzheimer’s disease,”
Clin. Neurophysiol., 110
(11), 1942
–1947
(1999). http://dx.doi.org/10.1016/S1388-2457(99)00153-4 CNEUFU 1388-2457 Google Scholar
H. Oeet al.,
“Prolonged interhemispheric neural conduction time evaluated by auditory-evoked magnetic signal and cognitive deterioration in elderly subjects with unstable gait and dizzy sensation,”
Int. Congress Series, 1270 177
–180
(2004). http://dx.doi.org/10.1016/j.ics.2004.05.090 EXMDA4 0531-5131 Google Scholar
E. Pekkonenet al.,
“Delayed auditory processing underlying stimulus detection in Down syndrome,”
Neuroimage, 35
(4), 1547
–50
(2007). http://dx.doi.org/10.1016/j.neuroimage.2007.01.036 NEIMEF 1053-8119 Google Scholar
E. Pekkonenet al.,
“Auditory sensory memory and the cholinergic system: implications for Alzheimer’s disease,”
Neuroimage, 14
(2), 376
–382
(2001). http://dx.doi.org/10.1006/nimg.2001.0805 NEIMEF 1053-8119 Google Scholar
E. Pekkonenet al.,
“Cholinergic modulation of preattentive auditory processing in aging,”
Neuroimage, 27
(2), 387
–392
(2005). http://dx.doi.org/10.1016/j.neuroimage.2005.04.018 NEIMEF 1053-8119 Google Scholar
A. J. Fallgatteret al.,
“Loss of functional hemispheric asymmetry in Alzheimer’s dementia assessed with near-infrared spectroscopy,”
Cogn. Brain Res., 6
(1), 67
–72
(1997). http://dx.doi.org/10.1016/S0926-6410(97)00016-5 CBRREZ 0926-6410 Google Scholar
Y. SekiA. Kandori,
“Two-dimensional gradiometer,”
Jpn. J. Appl. Phys., 46
(6A), 3397
–3401
(2007). http://dx.doi.org/10.1143/JJAP.46.3397 JJAPA5 0021-4922 Google Scholar
Y. Sekiet al.,
“Unshielded fetal magnetocardiography system using two-dimensional gradiometers,”
Rev. Sci. Instrum., 79
(3), 036106
(2008). http://dx.doi.org/10.1063/1.2897588 RSINAK 0034-6748 Google Scholar
J. E. T. Knuutilaet al.,
“A 122-channel whole-cortex SQUID system for measuring the brainfs magnetic fields,”
IEEE Trans. Magn., 29
(6), 3315
–3320
(1993). http://dx.doi.org/10.1109/20.281163 IEMGAQ 0018-9464 Google Scholar
M. S. HämäläinenR. J. Ilmoniemi,
“Interpreting magnetic fields of the brain: minimum norm estimates,”
Med. Biol. Eng. Comput., 32
(1), 35
–42
(1994). http://dx.doi.org/10.1007/BF02512476 MBECDY 0140-0118 Google Scholar
H. SatoT. TakeuchiK. L. Sakai,
“Temporal cortex activation during speech recognition: an optical topography study,”
Cognition, 73
(3), B55
–B66
(1999). http://dx.doi.org/10.1016/S0010-0277(99)00060-8 CGTNAU 0010-0277 Google Scholar
R. P. Kennanet al.,
“Simultaneous recording of event-related auditory oddball response using transcranial near infrared optical topography and surface EEG,”
Neuroimage, 16
(3), 587
–592
(2002). http://dx.doi.org/10.1006/nimg.2002.1060 NEIMEF 1053-8119 Google Scholar
M. M. Plichtaet al.,
“Auditory cortex activation is modulated by emotion: a functional near-infrared spectroscopy (fNIRS) study,”
Neuroimage, 55
(3), 1200
–1207
(2011). http://dx.doi.org/10.1016/j.neuroimage.2011.01.011 NEIMEF 1053-8119 Google Scholar
S. Telkemeyeret al.,
“Acoustic processing of temporally modulated sounds in infants: evidence from a combined near-infrared spectroscopy and EEG study,”
Front Psychol., 2
(62), 1
–14
(2011). 1664-1078 Google Scholar
K. Kotilahtiet al.,
“Bilateral hemodynamic responses to auditory stimulation in newborn infants,”
Neuroreport, 16
(12), 1373
–1377
(2005). http://dx.doi.org/10.1097/01.wnr.0000175247.35837.15 NERPEZ 0959-4965 Google Scholar
|
||||||||||||||||||||||||||||||||||||||||||||||||||||||||||||||||||||||||||||||||


