|
|
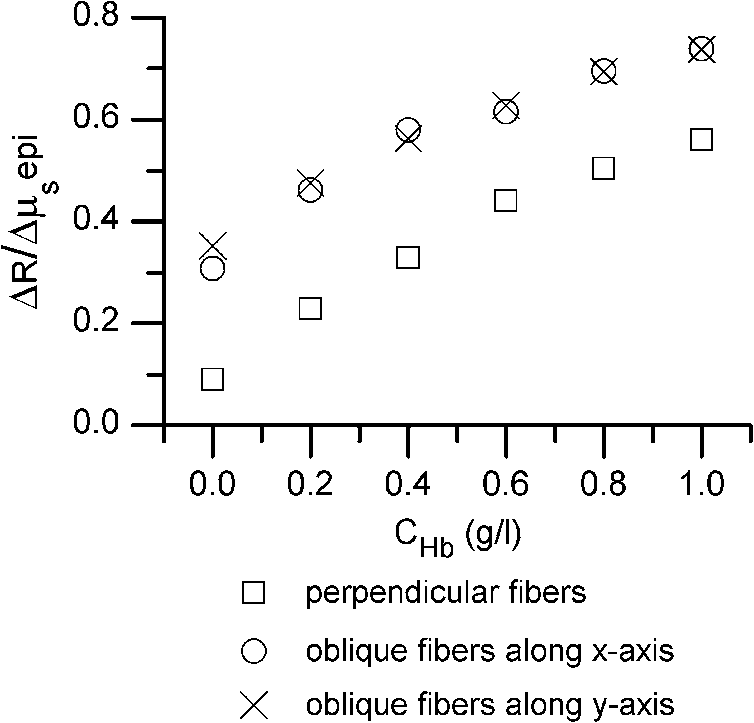
1.IntroductionIntraepithelial neoplasia or dysplasia is a precursor of many cancers. Due to the potential of dysplastic lesions to progress into lethal invasive carcinoma, these lesions need to be treated or followed up depending on the level of abnormality and, if any, known factors predictive of progression. Diffuse reflectance spectroscopy (DRS) and fluorescence spectroscopy have been applied to obtain dysplasia-associated tissue optical properties of tissue in vivo.1–9 The abilities of optical spectroscopy techniques to obtain quantitative and diagnostically relevant information about tissue are highly desirable to meet the clinical need of noninvasively detecting visually nonapparent dysplastic lesions. DRS can be used to estimate tissue scattering and absorption properties. The changes in tissue optical properties associated with the progression of dysplasia have been found to be layer dependent including an increase of scattering in the epithelium, a decrease of scattering in the stroma and an increase of absorption in the stroma. The epithelial layer consists of one or multiple layers of epithelial cells that have little absorption of visible light. The major histopathologic characteristics of dysplasia including enlarged, irregularly shaped and hyperchromatic epithelial cell nuclei and an increased nuclear-to-cytoplasmic ratio are expected to increase scattering in the epithelial layer.10–12 Absorption in the epithelium is at least an order of magnitude lower than scattering and has not been reported to change during precancerous development. The stroma underlying the epithelial layer mainly consists of structural proteins and blood vessels. It is well accepted that the higher absorption found in dysplastic tissue is caused by increased hemoglobin absorption due to angiogenesis, which occurs during precancerous transformation.2,3,5,6 The origin of the lower scattering in the stroma of dysplastic tissue has been attributed to a breakdown of the collagen fiber network.2,13,14 Tissue fluorescence properties that are associated with dysplasia include increased fluorescence from NADH in the epithelial layer due to elevated metabolism and decreased stromal fluorescence due to remodeling of the collagen fiber network.15,16 The majority of existing quantitative optical spectroscopy techniques applied to detecting dysplasia has approximated the tissue as a homogeneous medium based on the assumption that the effect of a thin and transparent epithelial layer on the measured reflectance and fluorescence signals is negligible.2–8 For stratified squamous epithelia, such as those lining the mucosa of the uterine cervix, oral cavity, and esophagus, the effect of epithelial scattering may need to be considered because epithelial layers in these organs are typically 200 to 500 μm thick17 while the probing depths of the optical spectroscopy instruments used in the published studies are less than 1 mm.13,18–20 Therefore, a DRS-based technique that can quantify the scattering coefficient and thickness of the epithelial layer in addition to the absorption and scattering properties of the stroma is promising to improve the detection of dysplasia in stratified squamous epithelium. In addition, a more accurate estimation of the tissue scattering and absorption properties and epithelial thickness will improve the extraction of intrinsic tissue fluorescence from fluorescence spectroscopic measurements, thereby providing more diagnostic information.9,21,22 Quantification of tissue optical properties by DRS requires establishing a model of photon propagation and finding the set of optical properties that lead to the reflectance signals at the tissue surface. Many two-layered models, whether analytical, numerical or empirical, have been proposed to describe the relationship between tissue scattering and absorption properties and tissue surface reflectance. However, literature on quantification of the optical properties of a thin epithelial layer and an underlying thick stroma from spatially and/or spectrally resolved reflectance is very limited.23–26 Weber et al. reported a two-step inverse method to extract diagnostically relevant tissue parameters from DRS and fluorescence spectroscopy measurements performed on cervical mucosa.9 In the first step a one-layered diffusion theory model was used to fit the reflectance spectra measured at multiple distances from the illumination fiber, and the extracted absorption and reduced scattering coefficients were taken as the stromal optical properties. Fluorescence spectra were then fitted to an analytical fluorescence model developed by Chang et al.27 to extract epithelial scattering coefficient and fluorescence efficiencies of major fluorophores. The errors of estimated epithelial parameters were not reported for comparison with other methods. The thickness of the epithelial layer needs to be known, and the accuracy of the estimated epithelial scattering coefficient is contingent on the accuracy of the tissue fluorescence properties. Liu and Ramanujam reported a two-step approach based on Monte Carlo simulations to estimate the absorption and scattering coefficients of two layers and the thickness of the epithelium from simulated reflectance spectral data.23 In the first step, a one-layered Monte Carlo model was used to estimate the epithelial scattering and absorption coefficients from the reflectance spectrum obtained with a pair of obliquely oriented source and detection fibers whose optical axes were tilted as shown in Fig. 1(a). The estimated epithelial absorption and scattering coefficients were then used in a two-layered Monte Carlo model to extract the remaining unknown parameters, including epithelial thickness and stromal absorption and scattering coefficients. For an epithelial thickness ranging from 200 to 500 μm, the ranges of errors in estimated epithelial scattering coefficient and thickness were to and to 30%, respectively. Errors in estimated stromal absorption and scattering coefficients were to and to , respectively. The accuracy of extracted epithelial optical properties is influenced by tissue optical properties and has not been validated with typical ranges of tissue optical properties. Wang et al. reported theoretical and experimental evaluations of quantifying two-layered tissue optical properties from reflectance spectra measured with six detection fibers that are located at center-to-center distances between 0.25 mm and 2.25 mm to an illumination fiber.24 Reflectance data generated with Monte Carlo simulations were used to build a neural-network-based inverse method. They found that the accuracy of estimated optical properties was significantly improved by fitting the absorption and scattering coefficients obtained from the inverse method with known spectral dependences of the absorption and scattering coefficients, respectively. Theoretical evaluation under the conditions of a known top-layer thickness and 5% uniform random noise resulted in prediction errors in the range of 4% to 39% for the four optical coefficients. Variance of the errors among multiple tests, which is important to evaluate the performance of the proposed method, was not provided. The errors of experimental evaluations on tissue mimicking phantoms were in the range of 14% to 42% under four different phantoms conditions. The major limitation of this approach is that the thickness of the epithelium needs to be independently determined, for example, with optical coherence tomography. Yudovsky and Pilon reported accurate extraction of oxygen saturation, melanin content and epidermis thickness of skin from simulated reflectance spectra based on a semi-empirical two-layered model.25 Yudovsky and Durkin applied spatially modulated imaging in a theoretical study to quantify two-layered optical properties in an epidermis/dermis tissue model.26 These two methods are not generally applicable to the extraction of the scattering coefficient of amelanotic epithelial tissue. Fig. 1Geometric arrangements of fiber-optic probe configurations consisted of (a) one source fiber and one detection fiber tilted toward each other, (b) one source fiber and three detection fibers perpendicular to the tissue surface, (c) one source fiber and three detection fibers oriented obliquely to the tissue surface and arranged along the -axis, and (d) one source fiber and three detection fibers oriented obliquely to the tissue surface and arranged along the -axis.  A major challenge of quantifying optical absorption and scattering properties of two-layered tissue models is lack of unique mapping between tissue optical properties and the reflectance signals measured at the tissue surface.24,26,28,29 We have addressed the issue by simultaneously fitting spatial and spectral information of reflectance data with a two-layered scalable Monte Carlo model.30 A 5% Gaussian white noise was added to simulated reflectance spectra for nine detection fibers located at center-to-center distances of 0.4 to 2 mm to an illumination fiber. The errors of estimated epithelial thickness, epithelial scattering coefficient, stromal absorption coefficient, and stromal scattering coefficient were 3%, 6%, 7%, and 1%, respectively. Although high accuracy was demonstrated in the previous study, photon packets were launched perpendicularly to the tissue surface, and all photons leaving the tissue surface within the contact areas of the detection fibers were considered detected to improve computational efficiency. Realistic optical fibers have a numerical aperture (NA) typically no more than 0.6, and the reduction in fiber NA is expected to increase the penetration depth of detected photons and reduce the sensitivity to epithelial optical properties.19 The most commonly used fiber-optic contact probe configuration, which was also used in our previous study30 consists of one or multiple optical fibers perpendicular to the tissue surface. A schematic illustration is shown in Fig. 1(b). Because scattering of light in the epithelium is predominantly in the forward direction (i.e., with small deviation angles), most detected photons in this probe configuration travel a much longer distance in the stroma than in the thin epithelium.20 The relatively low sensitivity to epithelial scattering property makes accurate estimation of epithelial scattering coefficient difficult. Various fiber-optic probe designs have been proposed theoretically and demonstrated experimentally to improve selective detection of epithelial fluorescence or scattering properties. Using obliquely oriented illumination and/or detection fibers similar to the configuration illustrated in Fig. 1(a) shifts the overlap between illumination and collection cones to shallower tissue31,32 and effectively reduces the penetration depth of reflected photons.19,20 However, this probe geometry is not suitable to make compact probes for in vivo endoscopic measurements due to the potential problem of damaging the fibers with a small bending radius.31 This issue is addressed by deflecting the illumination and/or collection light paths with a half-ball lens,20 a ball-lens,33 lensed fibers,34 or beveled fibers35 to increase light-tissue interaction within shallower tissue without bending the fibers. Although enhanced detection of reflectance and fluorescence from shallower tissue layers has been experimentally demonstrated with these probe configurations, the volume of tissue that is interrogated by a probe depends on the presumably unknown optical properties of the tissue under investigation. Therefore, it is advantageous to incorporate a two-layered tissue model suitable for the probe of choice to facilitate the detection of diagnostically relevant and layer-specific tissue optical properties. Building on our previous success of establishing a technique to quantify optical properties of two-layered tissue30 we seek to continue developing our technique for noninvasive detection of dysplasia. Specifically, the goal of the numerical investigation described in this paper is to improve the sensitivity of the measured reflectance to scattering properties of a thin epithelial layer. We propose to use a beveled fiber-optic bundle whose distal end surface is parallel and in contact with tissue surface as illustrated in Fig. 1(c) and 1(d). The proposed probe geometry facilitates fabrication of compact endoscope-compatible probes without the need for precise alignment. Using obliquely oriented fibers parallel to each other to enhance the interrogation of superficial tissue has been suggested36,37 but no detailed investigation of its performance has been reported. In this study a representative normal oral mucosa tissue model was used to compare the sensitivity to epithelial scattering between the proposed probe and fibers perpendicular to tissue surface [Fig. 1(b)]. A definite proof of improved sensitivity to epithelial optical properties by the proposed fiber configuration was provided by highly accurate quantification of the epithelial thickness and scattering coefficient of a thin epithelial layer in a two-layered tissue model with various optical properties. 2.Methods2.1.Fiber-Optic Probe Geometry and ParametersFigure 1(b) shows a conventional geometry for spatially resolved spectroscopy in which one source fiber and multiple detection fibers are parallel to each other and perpendicular to the tissue surface. In the proposed fiber geometry all fibers are rotated about the -axis by an angle and the end surfaces of the fibers are polished parallel to the tissue surface and put in contact with the tissue surface. Figure 1(c) and 1(d) shows obliquely oriented source and detection fibers arranged along the -axis and -axis, respectively. All fibers have a diameter of 200 μm and a core refractive index of 1.61. Although only three detection fibers are shown in the probe configurations illustrated in Fig. 1(c) and 1(d), the envisioned practical implementation of the proposed probe is accomplished with an imaging fiber-optic bundle through which two-dimensional distribution of reflectance spectra is acquired by hyperspectral imaging.30 With a much smaller core diameter (), the closely packed fibers in the imaging fiber bundle provide the flexibility of varying the size and SDS of detection areas for optimum analysis of the spatially resolved reflectance spectra. Throughout the text, numerical aperture (NA) of the fibers in the oblique probe configuration is referred to the nominal NA of the fiber bundle before polishing. A nominal NA of 0.6 was used for all fibers to compare the sensitivity of the fibers. The source-detector separation (SDS) of a detection fiber is defined as the center-to-center distance between the source fiber and the detection fiber at the fiber/tissue interface. It is well accepted that reflected photons measured at a shorter SDS go through a shorter path length and reach a shallower penetration depth in tissue. Therefore, to optimize the sensitivity to the optical properties of the epithelial layer we chose three detection fibers at the shortest possible SDS without overlap for each of the three fiber configurations shown in Fig. 1(b)–1(d). For the perpendicular fibers and oblique fibers arranged along the -axis, SDS1, SDS2, and SDS3 equal to 200, 400, and 600 μm, respectively. In the case of oblique fibers arranged along the -axis, the contact areas between the fibers and the tissue are elliptical instead of circular and SDS1, SDS2, and SDS3 correspond to , , and , respectively. 2.2.Tissue Optical PropertiesTo analyze the sensitivity of fiber optic probes we used a two-layered tissue model representative of normal oral mucosa.22 The top layer was 300 μm thick to represent the epithelium, and the bottom layer was assumed to be infinitely thick. The thickness of stroma underlying the epithelium varies with anatomical sites, but for the optical properties and probe geometry concerned in this study the assumption of an infinitely thick stroma is reasonable. Figure 2 shows wavelength-dependent absorption coefficients [Fig. 2(a)] and scattering coefficients [Fig. 2(b)] of the two layers within a spectral range of 400 to 800 nm. The absorption coefficient of the stroma was assumed to only depend on total hemoglobin concentration, , oxygen saturation, , and known molar extinction coefficient spectra of oxygenated and deoxygenated hemoglobin.38 In the epithelium a low level of absorption was assumed to be caused by cellular chromophores, such as proteins and enzyme cofactors and the absorption spectrum was assumed to be known.22 The of the epithelium used in the model is approximately where is wavelength in nm. A proportional constant was used to allow variability. The scattering coefficients of both tissue layers were assumed to have power-law dependence on wavelength Fig. 2(a) Absorption coefficients, , and (b) scattering coefficients, , of the two-layered tissue model representing normal oral mucosa.  The meanings of parameters and can be understood intuitively when the source of scattering in the tissue is assumed to be discrete particles whose scattering is independent of each other.39 The parameter is a proportional constant corresponding to the concentration of the scattering particles, and the parameter is related to the size of the scattering particles. A larger value of indicates smaller size, with an upper bound of due to Rayleigh scattering. We deliberately chose the same optical properties as those used in our previous study to compare the results and gain knowledge about the effects of realistic fiber NA on the performance of quantifying tissue optical properties.30 The two tissue layers were assumed to have the same refractive index of 1.4 and anisotropy factor . The values of the parameters used to calculate the optical properties of the normal oral mucosa tissue model are listed in Table 1. The scattering coefficient of the epithelium was based on ex vivo measurements of cervical tissue using reflectance confocal microscopy.10 The values of of the stroma were comparable to those obtained from in vivo single-probe DRS measurements of oral mucosa.40 The estimated by the previously published DRS method is expected to represent mainly the stromal because the DRS method utilizes a homogeneous tissue model, and the probe used is not designed to selectively detect epithelial . Table 1Parameters used to establish the normal oral mucosa tissue model. 2.3.Scalable Monte Carlo (sMC) MethodAn sMC algorithm has been developed to speed up obtaining full spectra of spatially-resolved reflectance with the three fiber configurations described in Sec. 2.1 and the tissue optical properties described in Sec. 2.2. A detailed description of the sMC method has been published.30 Briefly, the fundamental concept is to use the results of a single baseline MC run for (1) scaling the photon propagation length at each propagation step by the ratio of total interaction coefficients between the baseline tissue model and the tissue of interest, and (2) adjusting the photon exit weight by a factor equal to the albedo of the tissue of interest raised to the exponent of where is the total number of photon-tissue interactions.41 In the baseline MC simulation we used , , and the Henyey-Greenstain phase function with the anisotropy factor in a 1 cm thick homogeneous (single-layered) tissue model. The length-scaling and weight-adjusting procedure was modified to be used in a two-layered tissue model following a previously published method.42 To save computational time photons undergoing more than 2000 interactions without exiting the tissue surface were terminated since their contributions to reflectance are negligible. The previously reported sMC method30 was modified in the current study to model the oblique fiber geometry and consider the NA of the source and detection fibers. For the perpendicular fibers, each photon packet was launched in a propagation direction randomly selected within the illumination cone of the source fiber determined by the fiber NA and refractive index. All photon packets were launched at the origin, which coincides with the center of the source fiber at the tissue surface to obtain an impulse response of radially dependent reflectance. Only photons exiting the tissue surface within the acceptance cone of the detection fibers were recorded and used in subsequent scaling procedure. Convolution was performed on the impulse response after scaling to get the photon weight detected by each detection fiber following a reported method.43 For simulating photon propagation through oblique source and detection fibers, we adopted the rotation matrix method as proposed by Arifler et al.20 Each photon packet was launched at a location randomly assigned within the contact area of the source fiber and in an initial propagation direction randomly selected within the illumination cone of the source fiber determined by the fiber NA and refractive index. Then the vector composed of direction cosines of the initial propagation direction was rotated about the -axis by an angle using a three-dimensional rotation matrix where , , and are direction cosines of the initial propagation direction and , , and are direction cosines after rotation. After refraction at the fiber/tissue interface according to Snell’s law the incident photon packet continues its random walk in tissue as in conventional MC simulations. Only photons exiting the tissue surface within the acceptance cone of the detection fibers were recorded and used in the subsequent scaling procedure. To determine whether a photon packet leaving the tissue surface falls within the acceptance cone of the oblique detection fibers, we used a reverse procedure consisting of refraction at the fiber/tissue interface followed by rotating the direction cosines vector by an angle . After the scaling and weight-adjusting process, photon packets exiting the tissue surface at locations within the contact areas of the detection fibers were detected. Loss of photon energy in both perpendicular and oblique fibers was not considered and can be accounted for by experimental calibration. In the model, the tissue surface was assumed to be completely flat. This is generally not the case in real tissue. Any space between irregular tissue surface and the fiber facet can be filled with water to approximately match the refractive index of tissue. In the sMC model we assumed the mismatch in refractive indices between tissue and water was negligible so that refraction and reflection of photon propagation direction at the tissue/fiber interface could be determined by incidence angle and the refractive indices of the tissue and the fiber.2.4.Sensitivity AnalysisTo evaluate the sensitivity of the fiber-optic probe configurations to optical properties of diagnostic relevance, we calculated the percent change in reflectance, , detected by a detection fiber due to a change in one of the optical coefficients in the two-layered tissue model: where is the reflectance from the normal oral mucosa model whose optical coefficients are described in Sec. 2.2 and is the reflectance after one of the optical coefficients is varied. In addition, the mean path length that detected photon packets spend in the stroma is expected to correlate positively with the influence of stromal absorption on the detected reflectance. Given a combination of wavelength, fiber geometry, and detection fiber SDS, the path length of each detected photon packet in the stroma was recorded. Since variable-weight photon packets were implemented in the sMC code, a weighted average of the path length in the stroma was calculated as follows: where is the detected photon weight, is the total number of detected photon packets, is the path length in the stroma of a detected photon packet with index .2.5.sMC-Based Inverse ProcessThe inverse problem of extracting tissue absorption and scattering coefficients from spatially resolved reflectance spectra was tackled by iteratively fitting input data with the results of forward sMC simulation.30,44 We used a nonlinear least-squares curve-fitting function provided in MATLAB (The MathWorks, Inc.) and made a graphical user interface to automate the process and facilitate parameter setting. The input data consisted of multiple-SDS reflectance spectra in the range of 400 to 800 nm with an increment of 8 nm were preprocessed before they were fed into the curve-fitting algorithm. A total of eight free parameters were varied within specified upper and lower bounds to best fit the input data. The free parameters include , , , of the epithelium, of the epithelium, of the stroma, of the stroma, and thickness of the epithelial layer. Based on our experience, the ranges over which the free parameters are allowed to vary do not affect the fitting accuracy as long as the ranges cover the correct values. The purpose of the preprocessing step was to approximately equalize the influences of all detection fibers on the fitting results.30 The reflectance spectrum of the detection fiber nearest to the source fiber was taken as a reference, and the reflectance spectra of the other detection fibers were scaled so that the integrated reflectance of each fiber within a wavelength range of 590 to 620 nm was equal to that of the reference fiber. The same set of scaling factors was applied to the results of sMC simulation during the iterative curve-fitting process before the simulation results were compared with the input data. The input spatially resolved spectra data were generated by the developed sMC code using optical properties described in Secs. 2.1 and 2.2 with 5% random Gaussian noise added to simulate experimental errors. For every fiber-optic probe condition tested, we generated five sets of input data with different noise values. Each input data was fitted three times with a different set of initial values of the free parameters each time to avoid converging to a local minimum. The resultant values of the free parameters that yielded the smallest mean squared percentage error among the three fitting trials were chosen as the solution to the inverse problem for the corresponding set of input data. 3.Results3.1.Validation and Computational Time of the sMC CodeThe sMC code, written in C++, was first validated with the open-source MCML program45 on 200 sets of absorption and scattering coefficients taking from the normal oral mucosa tissue model described in Sec. 2.2. One million photons were launched orthogonally to tissue surface at the origin and all photons leaving the tissue surface were taken as detected. The detected photon weights were binned into 10 consecutive annular areas (the innermost area was a circle) and divided by to get spatially resolved reflectance. The width of each ring and the radius of the innermost circle were 100 μm. The absolute percentage error of the sMC results was , taking the MCML results as true values. The computational efficiency of the sMC code was also benchmarked with the MCML code. On a desktop computer equipped with an Intel Core i5-760 CPU (2.80 GHz), the baseline MC simulation using photons took 125 s. The scaling and weight-adjusting procedure to obtain the spatially resolved reflectance took 3.5 s per set of optical coefficients. The computational time needed by the MCML code on the same computer was on average 200 s per set of optical coefficients. The capability of using the developed sMC code to calculate reflectance measured by oblique fibers along the -axis with a rotation angle was validated by comparison with a nonscalable MC code developed previously.20 The absolute percentage error was based on simulation results of 24 different combinations of optical properties and SDSs using photons. 3.2.Influence of Changes in a Single Optical Property to ReflectanceChanges in optical coefficients that have been shown to accompany the progression of dysplasia, including higher scattering in the epithelium, higher absorption in the stroma and lower scattering in the stroma, were investigated individually. As an example, Fig. 3 shows the effect of increasing the epithelial scattering coefficient by 30% and 50% on reflectance spectra. In both perpendicular and oblique fiber configurations, the fibers with a shorter SDS showed more prominent increases in reflectance intensity. By comparing Fig. 3(a) with Fig. 3(c) and 3(e) one observes that both the oblique fibers along the -axis and the -axis were more sensitive to changes in the epithelial scattering coefficient than the perpendicular fiber. All reflectance spectra showed three dips around wavelengths of 414, 540, and 576 nm due to hemoglobin absorption in the stroma. It can be seen that the oblique fibers showed shallower dips in reflectance spectra at these wavelengths than the corresponding perpendicular fibers, indicating a weaker dependence on stromal absorption. This suggests that the proposed oblique fibers are more sensitive to epithelial optical properties than the perpendicular fibers. Fig. 3Reflectance spectra of the normal oral mucosa model ( of epithelium ) detected by (a)(b) the perpendicular fibers, (c) and (d) the oblique fibers along the -axis, and (e) and (f) the oblique fibers along the -axis. Effects of increasing the epithelial by 30% and 50% on reflectance spectra are shown for comparison. (a), (c), and (e) are for fibers with the shortest SDS (SDS1) and (b), (d), and (f) are for fibers with the largest SDS (SDS3) investigated. 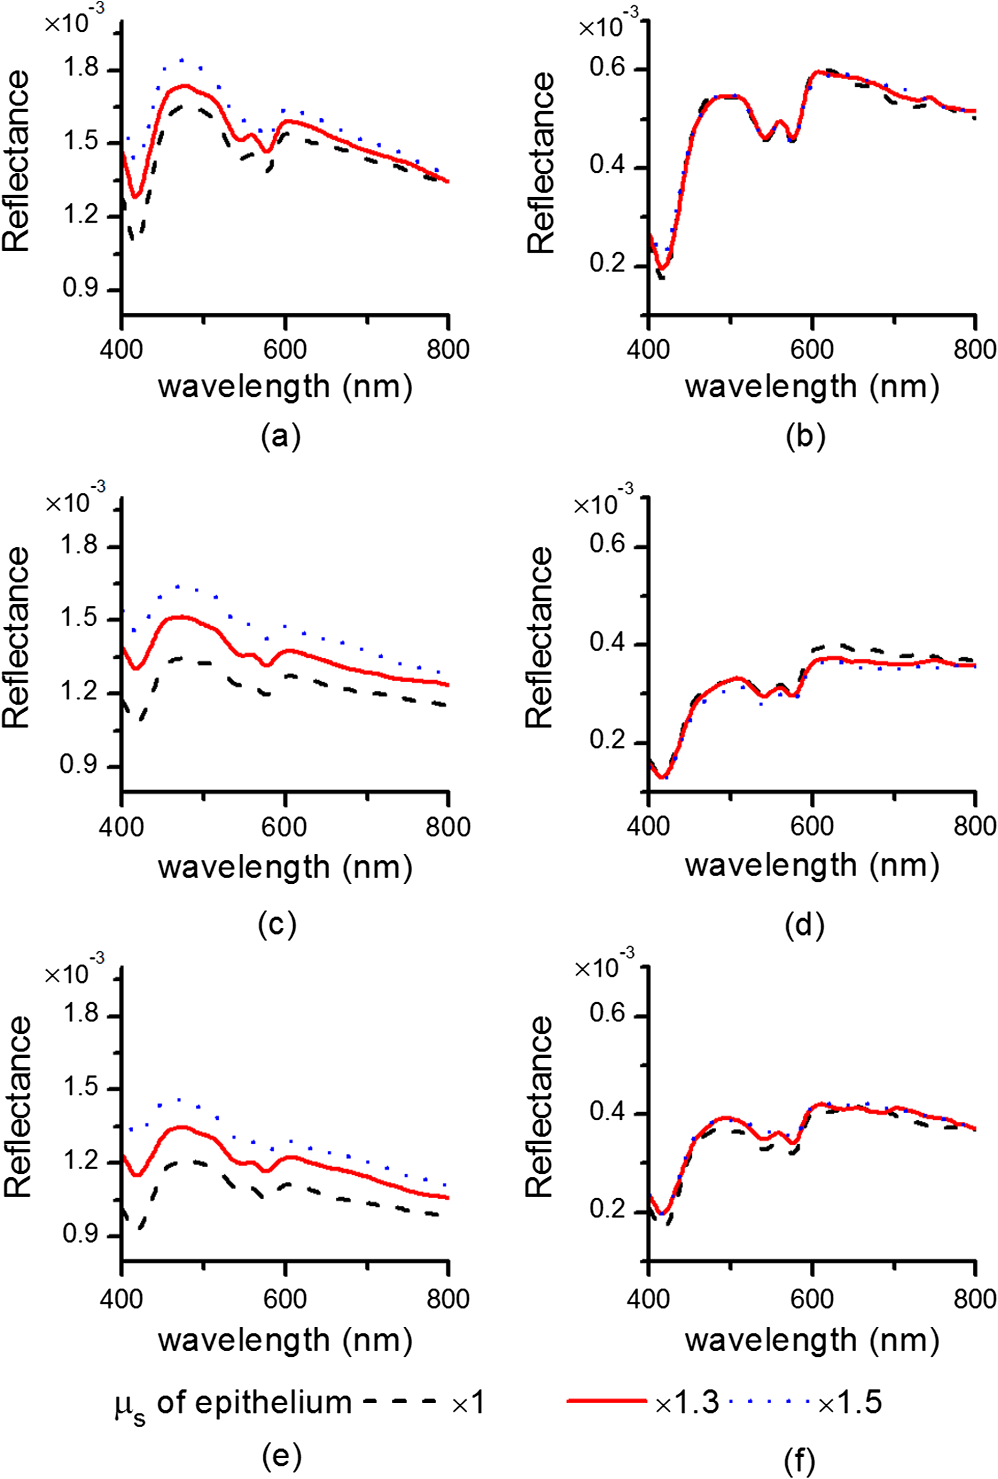 To compare the signal intensity detected by the oblique fibers with that detected by the perpendicular fibers, we calculated the area under each reflectance spectrum detected by the three fiber configurations from the normal oral mucosa model. The areas obtained from the oblique fibers were then normalized to the areas obtained from the perpendicular fiber at the same SDS to get a relative intensity. The oblique fibers along the -axis showed relative intensities of 0.85 at SDS1 and 0.67 at SDS3. The oblique fibers along the -axis showed relative intensities of 0.74 at SDS1 and 0.71 at SDS3. Although the full spectrum results provide a comprehensive description of the influence of changing tissue optical properties, analysis of the changes in reflectance at a few wavelengths is sufficient to give a concise summary of a fiber’s sensitivity and facilitate quantitative comparison between different fiber configurations. Three wavelengths including 414, 480, and 700 nm were selected to cover the range of absorption and scattering coefficients within the wavelength range of interest. The first one, 414 nm, has the highest absorption coefficient due to oxygenated hemoglobin in the stroma. The latter two wavelengths have relatively low hemoglobin absorption, one with relatively high scattering (480 nm) and the other with relatively low scattering (700 nm). Figure 4 shows of the three fiber configurations caused by changes of epithelial scattering coefficient , changes of stromal absorption coefficient , and changes of stromal scattering coefficient , over the range between and 100%. The slope of each curve in Fig. 4 represents the sensitivity of the corresponding fiber to the optical coefficient varied at the specified wavelength. Results of changing epithelial scattering coefficients are shown in Fig. 4(a)–4(e). Since the sensitivity to the epithelial scattering is higher with a shorter SDS, the results for SDS1 are shown in Fig. 4(a)–(c) and revealed that the oblique fibers have much higher than the perpendicular fiber at wavelengths of 480 and 700 nm but not at the hemoglobin absorption peak wavelength of 414 nm. Comparing the optical properties between 414 and 480 nm wavelengths shows that the scattering coefficients of both layers only change by about 13% from 414 nm to wavelength 480 nm, and the stromal absorption coefficient changes by 95% over the same wavelength range. Therefore, the high values detected by the fibers at the wavelength of 414 nm were suspected to be caused by strong hemoglobin absorption in the stroma in addition to increased epithelial scattering. The effect of coupled influence of absorption and scattering on is illustrated and discussed in Sec. 3.3. Significant values obtained with SDS2 and SDS3 were only present at the hemoglobin absorption peak wavelength of 414 nm and the data are shown in Fig. 4(d) and 4(e). The oblique fibers arranged along the -axis demonstrated values similar to those of the perpendicular fibers and higher than those of the oblique fibers arranged along the -axis. For other combinations of SDS and wavelength the values were within 20% and in response to values over the range between and 100%. Fig. 4Comparison of the percent change in reflectance () of the three fiber-probe configurations shown in Fig. 1(b)–1(d) in response to (a)–(e) changes of epithelial scattering coefficient , (f)–(h) changes of stromal absorption coefficient , and (i)–(k) changes of stromal scattering coefficient . 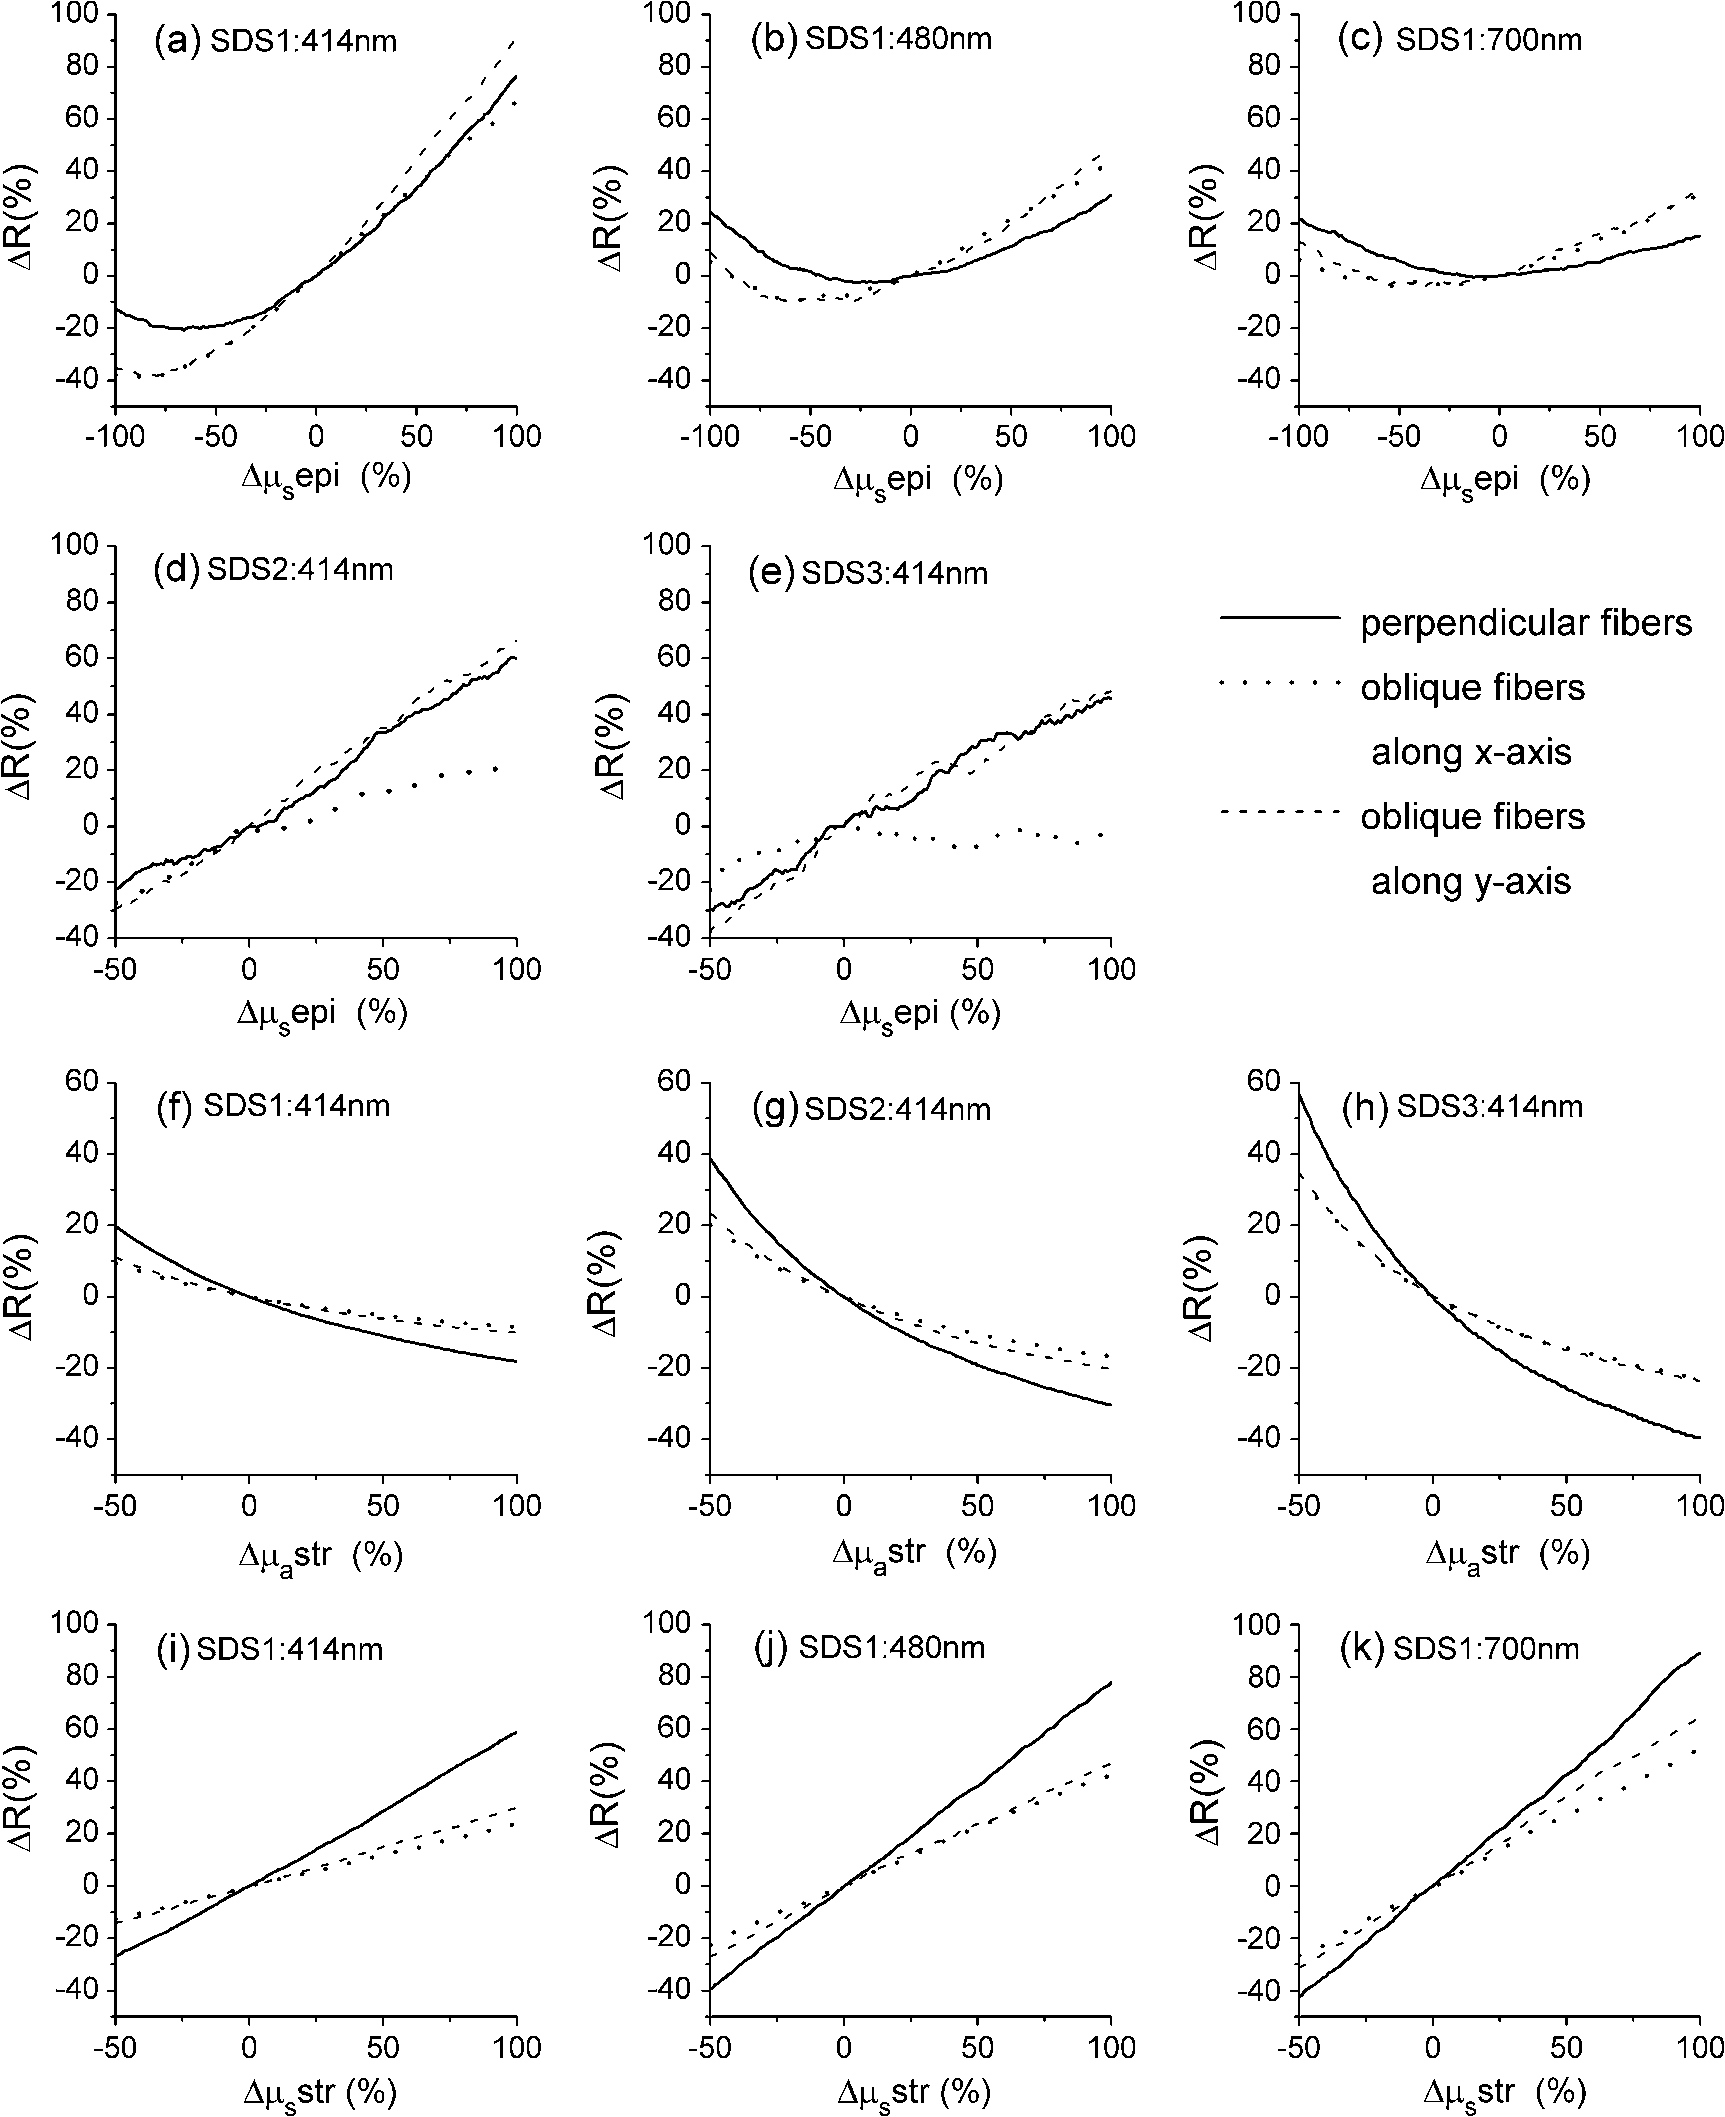 The values resulting from changes of the stromal absorption coefficient at 414 nm are shown in Fig. 4(f)–4(h). The results from other wavelengths showed similar trend but lower magnitudes than the results from 414 nm (data not shown). As seen in Fig. 4(f)–4(h) there is a clear trend of higher sensitivity to stromal absorption with an increased SDS. This is expected because the major source of absorption is hemoglobin in the stromal layer and increasing the SDS generally increases the probing depth. It can be seen that the two oblique fiber configurations show lower sensitivity to stromal absorption than the perpendicular fibers. The results of due to are only presented for SDS1 at the three selected wavelengths, as shown in Fig. 4(i)–4(k). The versus curves for SDS2 were very similar to those shown in Fig. 4(i)–4(k) and the results for SDS3 were about 30% to 50% lower than those shown. Both oblique fibers showed lower sensitivity to the stromal than the perpendicular fibers. 3.3.Coupled Influence of Scattering and Absorption on Sensitivity to Epithelial ScatteringTo investigate the suspected influence of strong hemoglobin absorption on as shown in Fig. 4(a), 4(d), and 4(e), we compared the sensitivity of the three fiber configurations to epithelial scattering by varying and keeping the other optical properties the same. Let be the percent change in epithelial scattering coefficient. Figure 5 shows versus within the range between 0 and for SDS1 of the three fiber configurations. Positive correlations between and are seen in the results of all three fiber configurations. The values obtained without hemoglobin absorption (i.e., ) could be used to represent the sensitivity of the fibers to epithelial scattering alone. It can be seen from Fig. 5 that the sensitivities of the oblique fibers at SDS1 to epithelial scattering were much higher than that of the perpendicular fiber at SDS1. The influence of hemoglobin absorption can be estimated by the difference in between and . The of the perpendicular fiber was reduced by 84% when was changed from to . The fraction of reduction in was 58% and 52% for the fiber along the -axis and the fiber along the -axis, respectively. Therefore, influence of hemoglobin absorption on is higher with the perpendicular fiber than with the oblique fibers at SDS1. At longer SDSs (SDS2 and SDS3) the perpendicular fibers and the oblique fibers along the -axis showed higher correlation between and than the oblique fibers along the -axis, indicating stronger influences of hemoglobin absorption on (data not shown). This result agrees with the high values obtained with these two fiber configurations at SDS2 and SDS3, as shown in Fig. 4(d) and 4(e). Combining the results shown in Fig. 4(d) and 4(e) with the finding of a strong influence of hemoglobin absorption on , it is suggested that the oblique fibers along the -axis are more sensitive to hemoglobin absorption than the oblique fibers along the -axis. 3.4.Quantification of Optical Properties Using the sMC-Based Inverse ProcessWe quantified , and epithelial thickness of the two-layered normal oral mucosa model by the sMC-based inverse process to provide the most rigorous test of the sensitivity of different fiber configurations to epithelial and stromal optical properties. Various parameters of the fiber probes including fiber NA and rotation angle were first tested to find out the optimum condition for extracting the optical properties from the normal oral mucosa model, and the results are summarized in Table 2. Accuracy of extracted of both tissue layers and of the epithelium was quantified by the root mean squared percentage error (RMSPE) calculated over the 51 wavelengths used in the inverse process. The RMSPEs of extracted stromal were calculated over a wavelength range of 400 to 600 nm to exclude wavelengths above 600 nm where hemoglobin absorption coefficient is negligible.44 Initially the rotation angle was set to 40 deg. For both fiber NAs of 0.4 and 0.6, the oblique fibers arranged along the -axis [Fig. 1(c)] resulted in much lower RMSPEs in extracted epithelial than the perpendicular fibers [Fig. 1(b)]. The RMSPEs in extracted stromal and obtained with the oblique fibers were slightly higher than those with the perpendicular fibers due to a lower sensitivity to the stromal optical properties. When the fiber NA was reduced from 0.6 to 0.4, the average RMSPEs in extracted epithelial with both the oblique fibers along the -axis and the perpendicular fibers increased significantly while the RMSPEs in extracted stromal properties remained similar. To further improve the accuracy of extracting epithelial by the oblique fibers with , we increased the rotation angle to 46 deg, which is the maximum rotation angle allowed without total internal reflection of incident photons at the fiber/tissue interface. The NA of 0.4 was chosen to match the NA of a fiber bundle currently used to construct an experimental instrument for the proposed method. The RMSPE in extracted epithelial indeed improved from to , however, at the expense of increased RMSPE in extracted stromal from to . As suggested by the results shown in Fig. 4(d) and 4(e), we examined the performance of combining the oblique fibers along the -axis [Fig. 1(c)] and the oblique fibers along the -axis [Fig. 1(d)]. Compared with using only the oblique fibers along the -axis, using combined oblique fibers improved the RMSPE in extracted stromal to in the case of fiber and . Surprisingly, the RMSPE in extracted epithelial was also significantly improved from to . Table 2Accuracy of the sMC-based inverse process to quantify optical properties of the normal oral mucosa model under various fiber conditions. Root mean squared percentage error (RMSPE) of the extracted optical coefficients of the epithelium and the stroma and absolute percentage error of the extracted epithelial thickness are shown. The means and standard deviations were calculated over the results of five sets of input data with different 5% random Gaussian noise.
To test the performance of the proposed method on tissues with various optical properties, we chose a fiber NA of 0.4 and a rotation angle in the combined oblique fiber configuration based on the results shown in Table 2. The same fiber NA of 0.4 was used for the perpendicular fiber configuration for comparison. We performed two sets of tests in which either epithelial thickness or was varied to generate the input data while the rest of the parameters were the same as those described in Sec. 2.2. In the first set of tests the thickness of the epithelial layer was varied to be 200, 400, or 500 μm to cover the typical range of thickness of stratified squamous epithelium. The thickness of the epithelium has been found to be not correlated with cervical dysplasia.17 In the second set of tests, was varied to be 0.5, 2, and . DRS-based in vivo studies have reported values of in the range of 1 to for normal oral mucosa40 and values of 0.6 and for normal tissue and high-grade dysplasia of the cervix, respectively.13 Table 3 compares the accuracy of extracted , and epithelial thickness by the perpendicular fiber configuration and the oblique fiber configuration combining detection fibers along the -axis and -axis. In both tests on varied epithelial thickness and , the combined oblique fibers showed lower errors in all the optical properties. In particular, the RMSPEs of extracted epithelial using the oblique fibers were at least ten times smaller than those using the perpendicular fibers. In the case of perpendicular fibers, the RMSREs of extracted epithelial and epithelial thickness decreased with an increasing epithelial thickness, which is expected and agrees with theoretical prediction of a prior study.29 As shown in Table 3 the combined oblique fiber configuration achieved consistently lower errors than the perpendicular fiber configuration over the ranges of epithelial thickness and tested, indicating excellent performance of the proposed fiber configuration on quantification of the epithelial thickness and optical properties of two-layered normal oral mucosa model. On average, the RMSPE of extracted epithelial was 1.5% using the combined oblique fiber configuration, compared to 32% using the perpendicular fiber configuration. Table 3Accuracy of the sMC-based inverse process to quantify optical properties of the normal oral mucosa model using fiber NA=0.4 and rotation angle β=46 deg in the oblique fiber configuration. Root mean squared percentage error (RMSPE) of the extracted optical coefficients of the epithelium and the stroma and absolute percentage error of the extracted epithelial thickness are shown for various epithelial thicknesses and hemoglobin concentrations. The means and standard deviations were calculated over the results of five sets of input data with different 5% random Gaussian noise. 4.Discussion and ConclusionsThe significant reduction in RMSPE of extracted epithelial using the proposed fiber configuration is a direct proof that the proposed oblique fiber configuration has higher sensitivity to epithelial scattering than the conventional perpendicular fiber configuration. Evidence of enhanced sensitivity with the oblique fibers can be seen in higher of SDS1 fibers at wavelengths of 480 and 700 nm, as shown in Fig. 4(b) and 4(c). Interestingly, the versus curves are parabola-like, i.e., first decreases and then increases as is varied from to 100%. Fig. 4(c) shows that the minimum of the versus curve for the perpendicular SDS1 fiber at 700 nm wavelength is near the point which corresponds to the epithelial scattering coefficient of the normal oral mucosa model at 700 nm. At a shorter wavelength of 480 nm the versus curve shifts slightly leftward. The values of the perpendicular SDS1 fiber at 480 nm and 700 nm are relatively low since change smoothly around the minima of the versus curves. From Fig. 4(b) and 4(c) it can be seen that the minima of the curves for the oblique fibers are located around point on the abscissa and the values are significantly enhanced around the point. To investigate possible mechanism of the enhanced sensitivity, we need to understand the origin of the parabola-shaped versus curves. An intuitive explanation is as follows. When scattering and absorption of a top epithelial layer are weak, the epithelial layer is essentially transparent and the highly scattering stromal layer acts as a diffuse reflector. As epithelial scattering gets higher, both the incident photons and the photons originally detected by a detection fiber diverge more quickly in the epithelium, expanding the photon distribution more widely and shifting the photon distribution toward the tissue surface. As a result, the strength of reflectance detected by the detection fiber is reduced. When epithelial scattering keeps increasing, eventually the gain in detected photons that have been scattered in the epithelium outweighs the loss in detected photons that are remitted from the stroma. Wang et al. reported a similar trend of decreased reflectance with an increase in epithelial scattering in a perpendicular fiber configuration.19 To get an insight into the effect of fiber geometry on photon distribution in tissue, two-dimensional fluence rates for photons detected by SDS1 fibers at 414 nm are shown in Fig. 6. The oblique fibers effectively tilted the photon distribution and increased the contribution of the epithelial layer to detected reflectance as compared to the perpendicular fiber. Distributions of the fluence rate along the depth for photons detected by the three SDS1 fibers are shown in Fig. 7. For each fiber configuration average fluence rates were calculated in grids with a dimension of and the depth-dependent fluence rate was normalized to the sum of the fluence rates from all depths to facilitate comparison of the contribution of different depths. Both oblique fibers showed higher contribution to detected reflectance from the epithelial region than the perpendicular fiber. The oblique fiber along the -axis showed slightly higher contribution from the region beneath the epithelium/stroma interface than the oblique fiber along the -axis. Since the oblique fibers facilitate the detection of photons with shallower penetration depth, relatively lower epithelial scattering is needed to achieve a net positive effect of on . The significant leftward shift of the versus curve by the oblique fibers can thus be correlated with higher sensitivity to epithelial scattering. Fig. 6Two dimensional fluence rate distributions of photons detected by the SDS1 fibers at 414 nm in (a) the perpendicular fibers configuration, (b) the oblique fibers along the -axis configuration, and (c)(d) the oblique fibers along the -axis configuration. The vertical dotted black lines in (d) indicate the range of from which the fluence rate shown in (c) was calculated. The horizontal red lines indicate the boundary between the epithelium and the stroma. 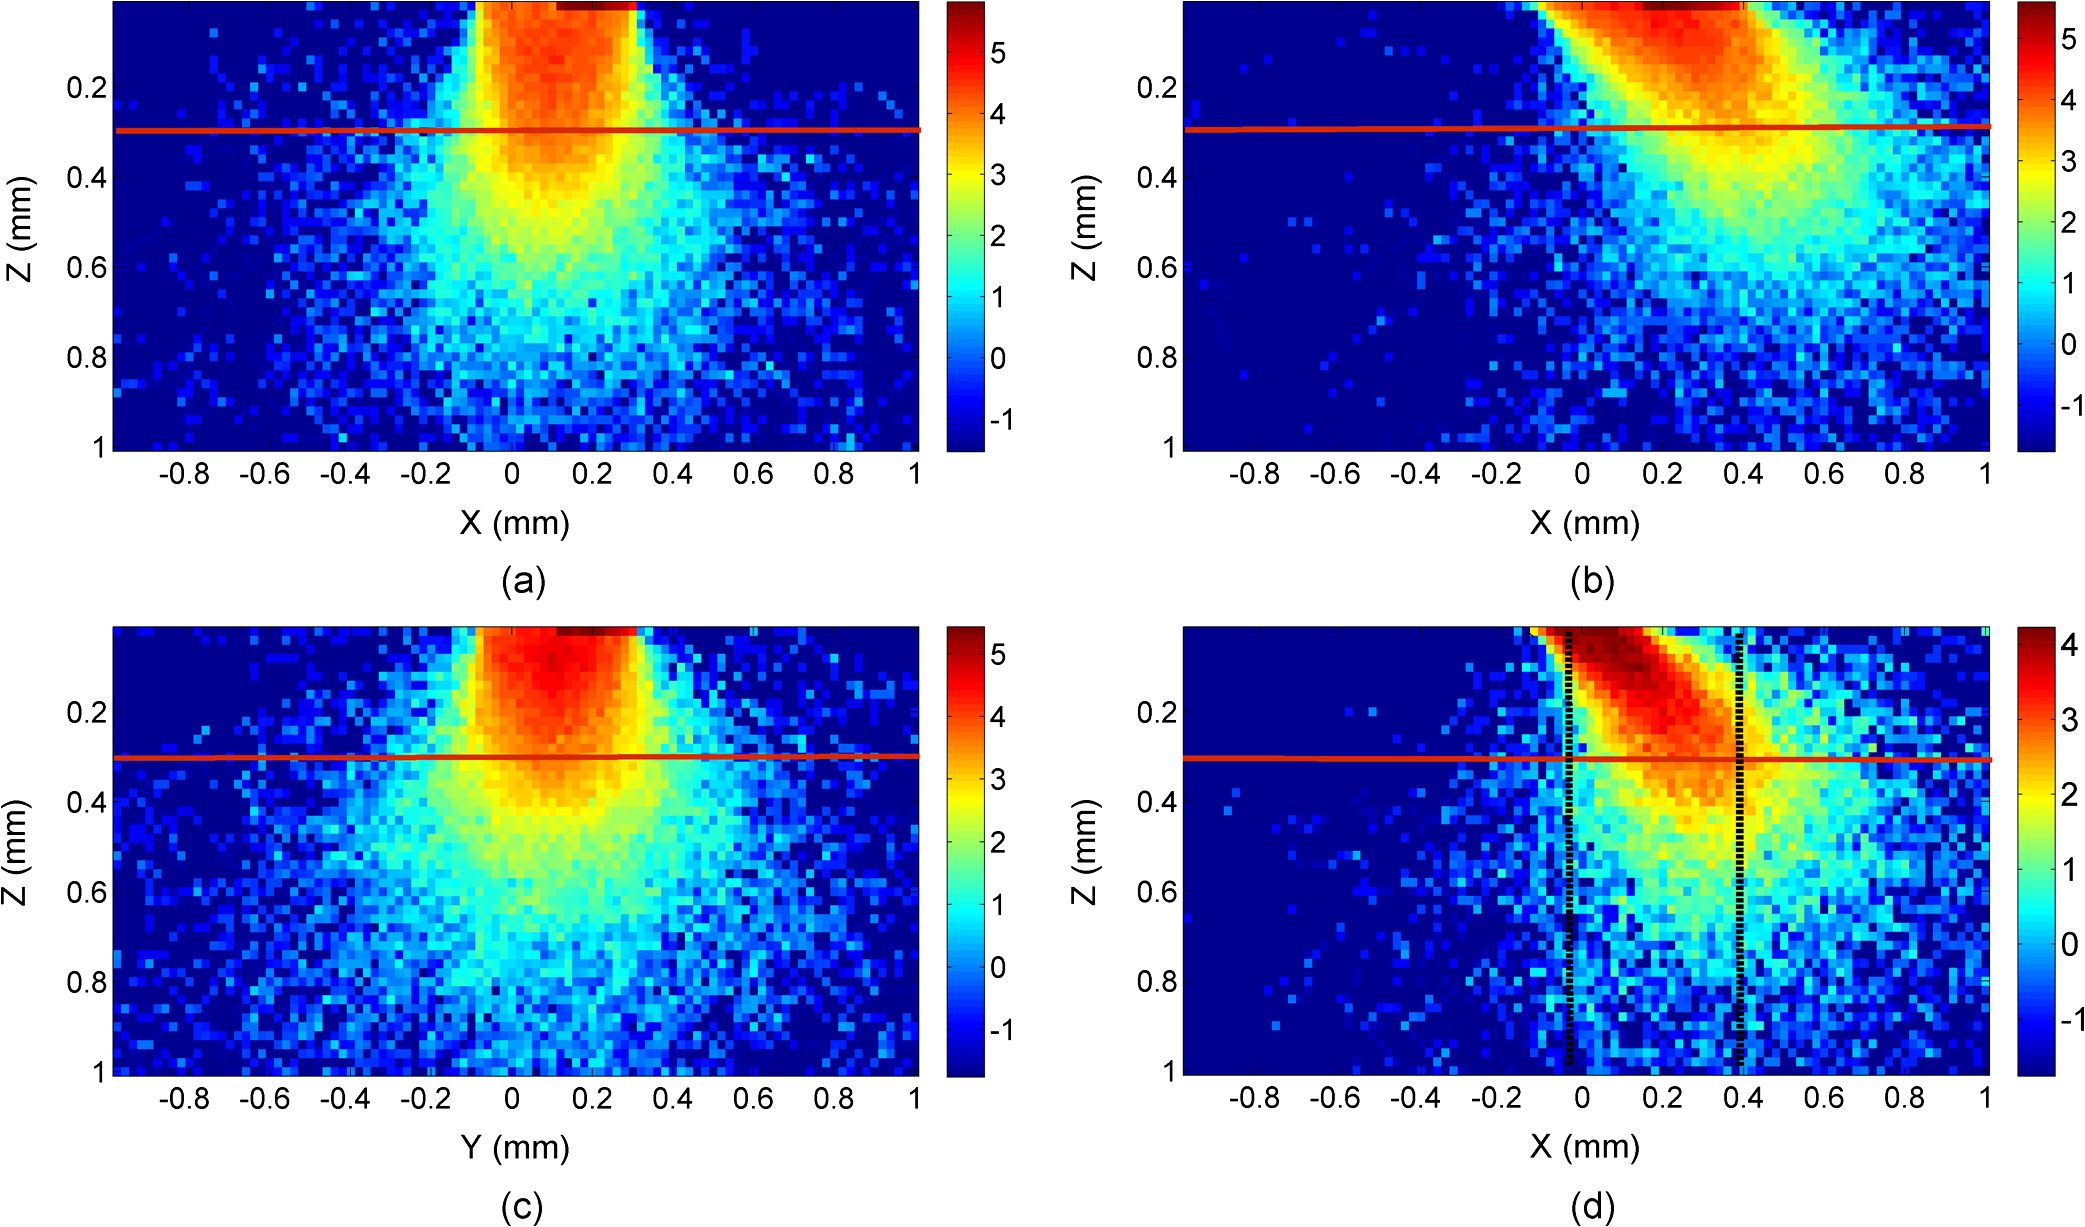 Fig. 7Fluence rate distribution of detected photons along the depth . The curves were normalized so that the area under each curve is one. The vertical dashed line labels the boundary between the epithelium and the stroma.  In addition to the higher of the oblique fibers at SDS1 and wavelengths of 480 and 700 nm as shown in Fig. 4(b) and 4(c), the of the oblique fibers at SDS1 and the wavelength of 414 nm may also contribute significantly to enhanced sensitivity of the oblique fibers to epithelial scattering, as suggested by results shown in Fig. 5. To decouple the strong influence of hemoglobin absorption on the apparent we purposely reduced from to . Reducing to may seem drastic, but the influence to spatial distribution of photon is small. This is because the scattering coefficient of the stroma is 15 times higher than the absorption coefficient at 414 nm, and removing hemoglobin only changes the total interaction coefficient of the stroma by 6%. Using the concept of the sMC method, one can predict that only photon path length in the stroma is extended by 7%, which would cause negligible effect on the number of photons detected. It is the weight of the detected photons that is majorly influenced by changing . Therefore, the values obtained without hemoglobin absorption provide a good approximation of the sensitivity to epithelial scattering alone. Taking the results of the sensitivity analysis together, it is observed that the sensitivity of the oblique fibers to epithelial scattering is higher at a shorter wavelength due to a higher epithelial scattering coefficient. To help understand the origin of the observed strong influence of hemoglobin absorption on detected reflectance intensity we plotted the average path length in the stroma against in Fig. 8. Data shown are for SDS1 fibers at 414 nm wavelength. Once again the concept of the sMC method can facilitate the explanation of the trend of decreasing stromal path length with an increased epithelial scattering coefficient. When the epithelial scattering coefficient is increased, the photon path length in the epithelium decreases. All photons that ever penetrate into the stroma experience a reduction in stromal path length, which results in a decrease of the average path length in the stroma as shown in Fig. 8. The detected reflectance intensity is then expected to increase. The opposite effect of decreased reflectance happens when the epithelial scattering coefficient is reduced. In sum, strong stromal absorption at 414 nm causes the curves to move upward when is positive and move downward when is negative. Simulation results shown in Fig. 4(a) agree with this prediction. In addition, results shown in Fig. 5 and described in Sec. 3.3 suggested that the apparent of the perpendicular fiber at SDS1 depends more heavily on hemoglobin absorption than those of the oblique fibers at SDS1. The higher dependence of the perpendicular fiber on hemoglobin absorption can be attributed to a higher fraction of photons distributed in the stroma as shown in Fig. 7. Figure 8 shows that the of the perpendicular fiber is much larger than those of the oblique fibers, strongly supporting the finding that obtained with the perpendicular SDS1 fiber shows much higher dependence on hemoglobin absorption than those obtained with the oblique SDS1 fibers. Fig. 8Dependence of the average stromal path length of detected photons on changes in epithelial scattering coefficient. Data were shown for photons detected by the SDS1 fibers in the three investigated fiber configurations at the wavelength of 414 nm. 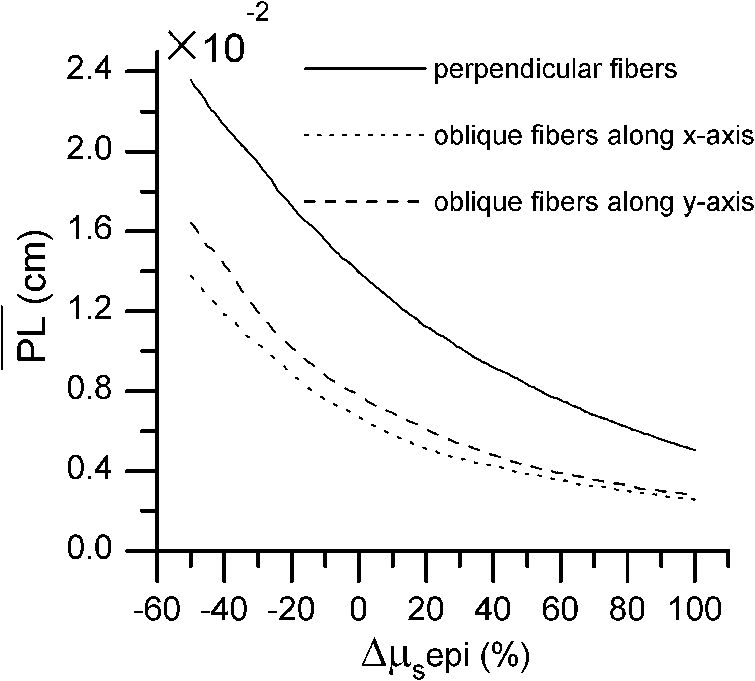 The above discussions on sensitivity are based on results from the normal oral mucosa model used in this study. Sensitivity of a fiber-optic probe configuration strongly depends on optical properties of the tissue under consideration. Further optimization of the probe design requires more experimental data on quantifying the optical properties of epithelium and stroma. Furthermore, because during development of dysplasia the optical properties of the epithelium and the stroma are expected to change concurrently, assessing the sensitivity of a fiber-optic probe by varying one optical coefficient at a time is insufficient to completely evaluate the ability of the probe to detect dysplastic changes in stratified squamous epithelium. For example, the progression of dysplasia is expected to increase epithelial scattering and reduce stromal scattering. While the oblique fibers with the shortest SDS demonstrated increased sensitivity to epithelial scattering and decreased sensitivity to stromal scattering compared with the perpendicular fibers, changes in the epithelial and stromal scattering coefficients have been shown to have opposing effects on measured reflectance intensity. A statistical approach has been proposed to analyze the influences of concurrent changes in optical properties on spatially resolved diffuse reflectance in a homogeneous tissue model.46 It is possible to adopt a similar statistical approach to a two-layered tissue model, provided that more quantitative information about the optical properties of the epithelium and the stroma is available. Several configurations of oblique fibers have been analyzed numerically19,20,23,47 and demonstrated experimentally31,48 to selectively detect epithelial scattering. The configuration shown in Fig. 1(a) or similar ones with only one fiber tilted is expected to have higher sensitivity to epithelium than the proposed fiber configuration because the overlap between the illumination and collection cones can be more confined to the epithelial layer. However, miniaturization of this type of probe for in vivo endoscopic measurements is difficult due to the limitation imposed by the long-term bending radius of the fibers.31 In addition, as demonstrated in our previous study using multiple detection locations enables collection of spatial distribution of reflectance and improves accuracy of quantifying optical properties of two-layered tissue. Adding more fibers to the probe increases complexity and cost of the probe. Wang et al. has evaluated both numerically and experimentally a modified oblique fiber configuration in which the illumination fiber is perpendicular to tissue surface and only the detection fiber is tilted.19,47,48 Application of this type of probe is also limited by the size of the probe. In addition to enhanced sensitivity, the reflectance intensity has been shown to be doubled by a detection fiber that is tilted by 40 deg and located at SDSs comparable to those used in the current study.19 On the other hand, the reflectance intensity detected by the proposed oblique fibers, shown in Sec. 3.2, is at least two-thirds of that detected by the perpendicular fibers. The relatively lower reflectance of the proposed probe can be compensated for by increasing the exposure time during data acquisition. This would not significantly affect the total data acquisition time since in vivo diffuse reflectance spectrum can be acquired within a fraction of a second using conventional perpendicular fibers. The major advantage of our proposed probe shown in Fig. 1(c) and 1(d) compared with probes based on the configuration shown in Fig. 1(a) is that it can be easily made by polishing imaging fiber bundles, which are commercially available with size compatible to endoscopes. The oblique orientation of the proposed probe with respect to tissue surface is well-suited for measuring the inner surface of the gastrointestinal tract, such as the esophagus, colon, and rectum. In these applications the proposed probe is inserted through the instrument channel of an endoscope and the distal end of the endoscope is tilted so that the end surface of the probe is in contact and level with the tissue surface. In addition to endoscopic applications, the proposed probe is expected to be able to access most locations of the oral mucosa. For measuring the ectocervix of the uterine, the proposed probe design may have difficulty miniaturizing because the probe body has to be tilted relative to the normal axis of the tissue surface. However, in this case miniaturization is not necessary since probes with a diameter larger than a centimeter have been used for spectroscopic measurements on the ectocervix. Since the same sMC code was used to generate the input data and served as the forward model in the iterative curve-fitting process, it is necessary to experimentally validate the performance of the proposed method on two-layered tissue phantoms, which is ongoing in our laboratory. We note that the accuracy of the proposed method to quantify optical properties of layered tissues highly depends on the accuracy of the assumed spectral dependence of the absorption and scattering coefficients. Further development of the proposed method requires acquisition of in vivo data to verify the suitability of these assumptions and provide guidance on modifications to the assumptions. Regardless of the accuracy of the assumptions, the smaller means and standard deviations of RMSPE in extracted epithelial is a direct proof that the sensitivity to epithelial scattering coefficient is improved by the proposed oblique fiber bundle probe. In conclusion, the results of this theoretical investigation suggest that the oblique fiber configurations shown in Fig. 1(c) and 1(d) are more sensitive to epithelial scattering and less sensitive to stromal scattering and absorption coefficients than the conventional perpendicular fiber configuration. Combining the oblique fibers along the -axis with those along the -axis has yielded the best performance in quantifying the absorption and scattering coefficients and thickness of the epithelium in a normal oral mucosa tissue model. Based on tests on tissue models with various epithelial thicknesses and hemoglobin concentrations, using the combined oblique fiber configuration improved the average RMSPE of extracted epithelial from 32% to 1.5%, as compared with using the conventional perpendicular fiber configuration. The errors in quantifying the other optical coefficients and the epithelial thickness were all below 10%. In comparison to tilted fibers shown in Fig. 1(a), the proposed oblique fiber bundle probe is easier to make and miniaturize, making it particularly suitable for endoscopic applications. Although the reflectance intensity measured with the proposed probe is expected to be several times lower than that measured with fibers similar to those shown in Fig. 1(a), the signal-to-noise ratio could be improved by increasing the exposure time. The sensitivity of the proposed probe to epithelial scattering is sufficiently high to allow accurate estimations of the epithelial thickness and scattering coefficient in tissue models with a wide range of optical properties. Our approach of using the proposed oblique fiber bundle probe and simultaneously analyzing the spatio-spectral reflectance information provides a viable option to improve noninvasive detection of dysplasia and early cancer in stratified squamous epithelium. AcknowledgmentsFinancial support from the National Science Council (grant #100-2628-E-002-011) in Taiwan is gratefully acknowledged. The authors also thank Dr. Dizem Arifler for her help with validating the scalable Monte Carlo code. ReferencesJ. Q. Brownet al.,
“Advances in quantitative UV-visible spectroscopy for clinical and pre-clinical application in cancer,”
Curr. Opin. Biotechnol., 20
(1), 119
–131
(2009). http://dx.doi.org/10.1016/j.copbio.2009.02.004 CUOBE3 0958-1669 Google Scholar
I. Georgakoudiet al.,
“Trimodal spectroscopy for the detection and characterization of cervical precancers in vivo,”
Am. J. Obstet. Gynecol., 186
(3), 374
–382
(2002). http://dx.doi.org/10.1067/mob.2002.121075 AJOGAH 0002-9378 Google Scholar
V. T. C. Changet al.,
“Visible light optical spectroscopy is sensitive to neovascularization in the dysplastic cervix,”
J. Biomed. Opt., 15
(5), 057006
(2010). http://dx.doi.org/10.1117/1.3495730 JBOPFO 1083-3668 Google Scholar
M. G. Mulleret al.,
“Spectroscopic detection and evaluation of morphologic and biochemical changes in early human oral carcinoma,”
Cancer, 97
(7), 1681
–1692
(2003). http://dx.doi.org/10.1002/(ISSN)1097-0142 60IXAH 0008-543X Google Scholar
S. McGeeet al.,
“Anatomy-based algorithms for detecting oral cancer using reflectance and fluorescence spectroscopy,”
Ann. Otol. Rhinol. Laryngol., 118
(11), 817
–826
(2009). AORHA2 0003-4894 Google Scholar
A. Amelinket al.,
“Non-invasive measurement of the microvascular properties of non-dysplastic and dysplastic oral leukoplakias by use of optical spectroscopy,”
Oral Oncol., 47
(12), 1165
–1170
(2011). http://dx.doi.org/10.1016/j.oraloncology.2011.08.014 EJCCER 1368-8375 Google Scholar
G. Zonioset al.,
“Diffuse reflectance spectroscopy of human adenomatous colon polyps in vivo,”
Appl. Opt., 38
(31), 6628
–6637
(1999). http://dx.doi.org/10.1364/AO.38.006628 APOPAI 0003-6935 Google Scholar
C. F. Zhuet al.,
“Diagnosis of breast cancer using fluorescence and diffuse reflectance spectroscopy: a Monte-Carlo-model-based approach,”
J. Biomed. Opt., 13
(3), 034015
(2008). http://dx.doi.org/10.1117/1.2931078 JBOPFO 1083-3668 Google Scholar
C. R. Weberet al.,
“Model-based analysis of reflectance and fluorescence spectra for in vivo detection of cervical dysplasia and cancer,”
J. Biomed. Opt., 13
(6), 064016
(2008). http://dx.doi.org/10.1117/1.3013307 JBOPFO 1083-3668 Google Scholar
T. Collieret al.,
“Sources of scattering in cervical tissue: determination of the scattering coefficient by confocal microscopy,”
Appl. Opt., 44
(11), 2072
–2081
(2005). http://dx.doi.org/10.1364/AO.44.002072 APOPAI 0003-6935 Google Scholar
R. Drezeket al.,
“Light scattering from cervical cells throughout neoplastic progression: influence of nuclear morphology, DNA content, and chromatin texture,”
J Biomed. Opt., 8
(1), 7
–16
(2003). http://dx.doi.org/10.1117/1.1528950 JBOPFO 1083-3668 Google Scholar
D. Arifleret al.,
“Light scattering from normal and dysplastic cervical cells at different epithelial depths: finite-difference time-domain modeling with a perfectly matched layer boundary condition,”
J. Biomed. Opt., 8
(3), 484
–494
(2003). http://dx.doi.org/10.1117/1.1578640 JBOPFO 1083-3668 Google Scholar
V. T. C. Changet al.,
“Quantitative physiology of the precancerous cervix in vivo through optical spectroscopy,”
Neoplasia, 11
(4), 325
–332
(2009). Google Scholar
D. Arifleret al.,
“Light scattering from collagen fiber networks: micro-optical properties of normal and neoplastic stroma,”
Biophys. J., 92
(9), 3260
–3274
(2007). http://dx.doi.org/10.1529/biophysj.106.089839 BIOJAU 0006-3495 Google Scholar
I. Pavlovaet al.,
“Microanatomical and biochemical origins of normal and precancerous cervical autofluorescence using laser-scanning fluorescence confocal microscopy,”
Photochem. Photobiol., 77
(5), 550
–555
(2003). http://dx.doi.org/10.1562/0031-8655(2003)077<0550:MABOON>2.0.CO;2 PHCBAP 0031-8655 Google Scholar
I. Georgakoudiet al.,
“NAD(P)H and collagen as in vivo quantitative fluorescent biomarkers of epithelial precancerous changes,”
Cancer Res., 62
(3), 682
–687
(2002). CNREA8 0008-5472 Google Scholar
D. C. Walkeret al.,
“A study of the morphological parameters of cervical squamous epithelium,”
Physiol. Meas., 24
(1), 121
–135
(2003). http://dx.doi.org/10.1088/0967-3334/24/1/309 PMEAE3 0967-3334 Google Scholar
A. Amelinket al.,
“Non-invasive measurement of the morphology and physiology of oral mucosa by use of optical spectroscopy,”
Oral Oncol., 44
(1), 65
–71
(2008). http://dx.doi.org/10.1016/j.oraloncology.2006.12.011 EJCCER 1368-8375 Google Scholar
A. M. J. Wanget al.,
“Depth-sensitive reflectance measurements using obliquely oriented fiber probes,”
J. Biomed. Opt., 10
(4), 044017
(2005). http://dx.doi.org/10.1117/1.1989335 JBOPFO 1083-3668 Google Scholar
D. Arifleret al.,
“Reflectance spectroscopy for diagnosis of epithelial precancer: model-based analysis of fiber-optic probe designs to resolve spectral information from epithelium and stroma,”
Appl. Opt., 44
(20), 4291
–4305
(2005). http://dx.doi.org/10.1364/AO.44.004291 APOPAI 0003-6935 Google Scholar
G. M. PalmerN. Ramanujam,
“Monte-Carlo-based model for the extraction of intrinsic fluorescence from turbid media,”
J. Biomed. Opt., 13
(2), 024017
(2008). http://dx.doi.org/10.1117/1.2907161 JBOPFO 1083-3668 Google Scholar
I. Pavlovaet al.,
“Monte Carlo model to describe depth selective fluorescence spectra of epithelial tissue: applications for diagnosis of oral precancer,”
J. Biomed. Opt., 13
(6), 064012
(2008). http://dx.doi.org/10.1117/1.3006066 JBOPFO 1083-3668 Google Scholar
Q. LiuN. Ramanujam,
“Sequential estimation of optical properties of a two-layered epithelial tissue model from depth-resolved ultraviolet-visible diffuse reflectance spectra,”
Appl. Opt., 45
(19), 4776
–4790
(2006). http://dx.doi.org/10.1364/AO.45.004776 APOPAI 0003-6935 Google Scholar
Q. Z. Wanget al.,
“Broadband ultraviolet-visible optical property measurement in layered turbid media,”
Biomed. Opt. Express, 3
(6), 1226
–1240
(2012). http://dx.doi.org/10.1364/BOE.3.001226 BOEICL 2156-7085 Google Scholar
D. YudovskyL. Pilon,
“Rapid and accurate estimation of blood saturation, melanin content, and epidermis thickness from spectral diffuse reflectance,”
Appl. Opt., 49
(10), 1707
–1719
(2010). http://dx.doi.org/10.1364/AO.49.001707 APOPAI 0003-6935 Google Scholar
D. YudovskyA. J. Durkin,
“Spatial frequency domain spectroscopy of two layer media,”
J. Biomed. Opt., 16
(10), 107005
(2011). http://dx.doi.org/10.1117/1.3640814 JBOPFO 1083-3668 Google Scholar
S. K. Changet al.,
“Analytical model to describe fluorescence spectra of normal and preneoplastic epithelial tissue: comparison with Monte Carlo simulations and clinical measurements,”
J. Biomed. Opt., 9
(3), 511
–522
(2004). http://dx.doi.org/10.1117/1.1695559 JBOPFO 1083-3668 Google Scholar
T. H. Phamet al.,
“Quantifying the properties of two-layer turbid media with frequency-domain diffuse reflectance,”
Appl. Opt., 39
(25), 4733
–4745
(2000). http://dx.doi.org/10.1364/AO.39.004733 APOPAI 0003-6935 Google Scholar
Q. Z. WangK. ShastriT. J. Pfefer,
“Experimental and theoretical evaluation of a fiber-optic approach for optical property measurement in layered epithelial tissue,”
Appl. Opt., 49
(28), 5309
–5320
(2010). http://dx.doi.org/10.1364/AO.49.005309 APOPAI 0003-6935 Google Scholar
T. Y. Tsenget al.,
“Quantification of the optical properties of two-layered turbid media by simultaneously analyzing the spectral and spatial information of steady-state diffuse reflectance spectroscopy,”
Biomed. Opt. Express, 2
(4), 901
–914
(2011). http://dx.doi.org/10.1364/BOE.2.000901 BOEICL 2156-7085 Google Scholar
L. Niemanet al.,
“Optical sectioning using a fiber probe with an angled illumination-collection geometry: evaluation in engineered tissue phantoms,”
Appl. Opt., 43
(6), 1308
–1319
(2004). http://dx.doi.org/10.1364/AO.43.001308 APOPAI 0003-6935 Google Scholar
M. C. Skalaet al.,
“Investigation of fiber-optic probe designs for optical spectroscopic diagnosis of epithelial pre-cancers,”
Lasers Surg. Med., 34
(1), 25
–38
(2004). http://dx.doi.org/10.1002/(ISSN)1096-9101 LSMEDI 0196-8092 Google Scholar
R. A. Schwarzet al.,
“Ball lens coupled fiber-optic probe for depth-resolved spectroscopy of epithelial tissue,”
Opt. Lett., 30
(10), 1159
–1161
(2005). http://dx.doi.org/10.1364/OL.30.001159 OPLEDP 0146-9592 Google Scholar
H. Y. Choiet al.,
“Microlensed dual-fiber probe for depth-resolved fluorescence measurements,”
Opt. Express, 19
(15), 14172
–14181
(2011). http://dx.doi.org/10.1364/OE.19.014172 OPEXFF 1094-4087 Google Scholar
L. T. NiemanM. JakovljevicK. Sokolov,
“Compact beveled fiber optic probe design for enhanced depth discrimination in epithelial tissues,”
Opt. Express, 17
(4), 2780
–2796
(2009). http://dx.doi.org/10.1364/OE.17.002780 OPEXFF 1094-4087 Google Scholar
L. V. Wanget al.,
“Oblique-incidence reflectometry: one relative profile measurement of diffuse reflectance yields two optical parameters,”
Proc. SPIE, 2627 165
–175
(1995). http://dx.doi.org/10.1117/12.228887 PSISDG 0277-786X Google Scholar
R. ReifO. A’AmarI. J. Bigio,
“Analytical model of light reflectance for extraction of the optical properties in small volumes of turbid media,”
Appl. Opt., 46
(29), 7317
–7328
(2007). http://dx.doi.org/10.1364/AO.46.007317 APOPAI 0003-6935 Google Scholar
S. A. Prahl,
“Tabulated molar extinction coefficient for hemoglobin in water,”
(1999) http://omlc.ogi.edu/spectra/hemoglobin/summary.html Google Scholar
J. R. Mourantet al.,
“Mechanisms of light scattering from biological cells relevant to noninvasive optical-tissue diagnostics,”
Appl. Opt., 37
(16), 3586
–3593
(1998). http://dx.doi.org/10.1364/AO.37.003586 APOPAI 0003-6935 Google Scholar
S. McGeeet al.,
“Model-based spectroscopic analysis of the oral cavity: impact of anatomy,”
J. Biomed. Opt., 13
(6), 064034
(2008). http://dx.doi.org/10.1117/1.2992139 JBOPFO 1083-3668 Google Scholar
R. Graaffet al.,
“Condensed Monte-Carlo simulations for the description of light transport,”
Appl. Opt., 32
(4), 426
–434
(1993). http://dx.doi.org/10.1364/AO.32.000426 APOPAI 0003-6935 Google Scholar
Q. LiuN. Ramanujam,
“Scaling method for fast Monte Carlo simulation of diffuse reflectance spectra from multilayered turbid media,”
J. Opt. Soc. Am. A-Opt. Image Sci. Vis., 24
(4), 1011
–1025
(2007). http://dx.doi.org/10.1364/JOSAA.24.001011 JOAOD6 0740-3232 Google Scholar
Q. Z. Wanget al.,
“Measurement of internal tissue optical properties at ultraviolet and visible wavelengths: development and implementation of a fiberoptic-based system,”
Opt. Express, 16
(12), 8685
–8703
(2008). http://dx.doi.org/10.1364/OE.16.008685 OPEXFF 1094-4087 Google Scholar
G. M. PalmerN. Ramanujam,
“Monte Carlo-based inverse model for calculating tissue optical properties. Part I: theory and validation on synthetic phantoms,”
Appl. Opt., 45
(5), 1062
–1071
(2006). http://dx.doi.org/10.1364/AO.45.001062 APOPAI 0003-6935 Google Scholar
L. H. WangS. L. JacquesL. Q. Zheng,
“MCML - Monte-Carlo modeling of light transport in multilayered tissues,”
Comput. Meth. Programs Biomed., 47
(2), 131
–146
(1995). http://dx.doi.org/10.1016/0169-2607(95)01640-F CMPBEK 0169-2607 Google Scholar
D. Arifler,
“Sensitivity of spatially resolved reflectance signals to coincident variations in tissue optical properties,”
Appl. Opt., 49
(22), 4310
–4320
(2010). http://dx.doi.org/10.1364/AO.49.004310 APOPAI 0003-6935 Google Scholar
A. WangV. NammalavarR. Drezek,
“Targeting spectral signatures of progressively dysplastic stratified epithelia using angularly variable fiber geometry in reflectance Monte Carlo simulations,”
J. Biomed. Opt., 12
(4), 044012
(2007). http://dx.doi.org/10.1117/1.2769328 JBOPFO 1083-3668 Google Scholar
A. WangV. NammalavarR. Drezek,
“Experimental evaluation of angularly variable fiber geometry for targeting depth-resolved reflectance from layered epithelial tissue phantoms,”
J. Biomed. Opt., 12
(4), 044011
(2007). http://dx.doi.org/10.1117/1.2769331 JBOPFO 1083-3668 Google Scholar
|
||||||||||||||||||||||||||||||||||||||||||||||||||||||||||||||||||||||||