|
|
|
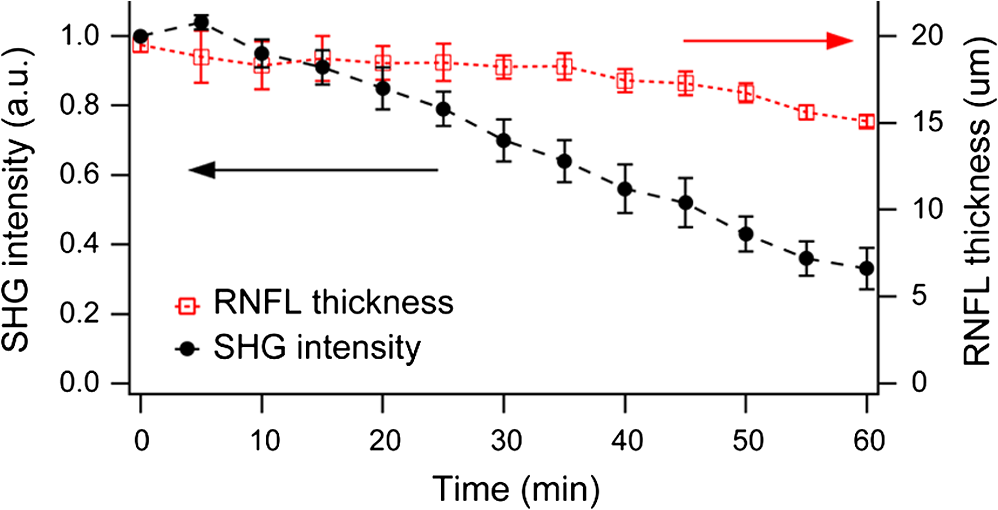
Glaucoma, the second leading cause of blindness worldwide,1 is a neurodegenerative disorder where the axons and cell bodies of the retinal ganglion cells (RGC) are lost. Early detection of the disease is crucial for the prevention of visual loss, but current clinical detection by a functional change in peripheral vision does not occur until approximately 40% of optic nerve axons are irreversibly affected.2 Several optical methods, including scanning laser polarimetry (SLP) and optical coherence tomography (OCT), have been developed for objective diagnosis of glaucoma. The thickness of the retinal nerve fiber layer (RNFL) can be measured either by SLP from phase retardation of a linearly polarized laser light,3 or by OCT, which achieves micrometer axial resolutions via coherence-gating of backscattering from the tissue.4 OCT has been also demonstrated to identify other anatomical characteristics of glaucoma, such as cupping of the optic nerve.5 The thickness and birefringence information of the RNFL can be simultaneously acquired by polarization-sensitive OCT.6,7 Microtubules (MTs) are the primary species in the RGC axons causing reflectance8 and birefringence9,10 of the RNFL, while other organelles, such as neurofilaments and membranes, have relatively smaller contributions.10 It has been hypothesized that MTs in the RNFL may be altered in the progression of glaucoma before significant thinning of the tissue, thereby enabling earlier detection of the disease.9 Balaratnasingam et al. showed that axonal transport in the prelaminar region and tubulin staining are affected by an extended period of intraocular pressure (IOP) elevation.11,12 Fortune et al. showed that the changes in RNFL birefringence (presumably occurring because of changes in microtubules) precede the thinning of RNFL after unilateral optic nerve transection13 or intravitreal injection of colchicine.14 Here we describe the use of a new optical radiation, namely second-harmonic generation (SHG), to study the effect of axonal MTs on the morphology of RNFL. MTs in the axons give rise to strong SHG emission because of the noncentrosymmetric molecular structure as well as uniformly polarized supramolecular organization. Previously, we showed that microtubular SHG (MT-SHG) can be exploited to visualize the retinal nerve fibers, without using exogenous stains or genetic engineering, and the three-dimensional (3-D) structure was quantified using a bias-free algorithm.15 Here, we demonstrate the use of MT-SHG to show that the disruptions in the architecture of MTs do not cause immediate thinning of the RNFL. The 3-D structure of RNFL can be imaged by SHG microscopy (SHGM), and it is also possible to infer the structural integrity of MTs simultaneously from the SHG signal, because the efficiency of the SHG process depends on the organization of the MT network. The procedure for SHGM imaging of fresh ex vivo retina is described in the following. The excitation for SHGM was 100-fs pulses from a Ti:Sapphire laser at 785-nm wavelength with 80-MHz repetition rate. A Pockels cell was employed to attenuate the laser beam and also to rapidly switch it off during the galvanometer’s return travel. The laser beam was focused with a water immersion objective lens (Olympus XLUMPlanFL ) on an upright microscope. The theoretical full width at half maximum of the squared excitation intensity is 0.28 and 1.1 μm in the transverse and axial dimension, respectively. The average power was approximately 50 mW at the sample. SHG was acquired in the forward detection path, which consists of a high-NA objective lens (Olympus UApo340 ), bandpass filters, and a PMT detector (Hamamatsu). The retinal flat mounts from adult female Sprague-Dawley rats were prepared as follows and approved by Hunter College Institutional Animal Care and Use Committee. Briefly, animals were euthanized and the eyes enucleated. A circumferential incision was made around the limbus, and the cornea, lens, and vitreous humor were removed and radial cuts made in the eye cup. The retina was separated from the retinal pigment epithelium and sclera and transferred to buffered Ames’ Medium bubbled with 95% and 5% at 34°C and pH 7.4. The sample was transferred to a perfusion chamber with a transparent bottom within 15 min after euthanasia. The retina was placed on a microscope stage with the RNFL side up. In order to investigate the relationship between the morphology of the retinal nerve fiber bundle and the MT network, we performed time-lapse SHGM. We induced dissociation of MTs in the RNFL using a chemical agent that hinders polymerization of the MTs (nocodazole, Sigma-Aldrich). Initially the fresh retina received only Ames’ Medium, then perfusion was switched at time zero to the second medium containing 25-µM nocodazole and 0.4% dimethyl sulfoxide (DMSO, Sigma-Aldrich). Figure 1 shows the retinal nerve fibers as imaged by SHGM. The mosaic in Fig. 1(a), constructed using Fiji (a version of ImageJ with stitching plugins), consists of a total of 38 transverse images summed over a stack of z-sections in depth ranges covering the whole RNFL. The location of the imaged region is indicated in Fig. 1(b). SHGM imaging reveals typical anatomy of the retinal nerve fiber bundles, verifying the axonal origin of SHG. We also observed that MT-SHG is relatively stronger in the RNFL than other regions in the central nervous system, suggesting that the density of MTs is high in the RNFL. The SHG power from uniaxially distributed SHG-active dipoles is given by where is in units of photons/s, is the density of MT, is the hyperpolarizability of the molecule, and is the excitation intensity in units of photons/s/area.16 The number density of MTs, as previously measured by electron microscopy, is as high as in the retina of toad,17 compared to about 10 to in the sensory axons of cat18 and lizard.19 The dendritic fields of individual RGCs are nearly invisible by SHGM, presumably because the density of MTs is substantially lower in the dendrites than in the axons20 and also because the MTs are not uniformly polarized in the dendrites.21Fig. 1The RNFL of a rat visualized by SHGM. Scale bar, 200 μm. Low magnification image of retinal flat mount in (b) shows the position of the imaged area.  We demonstrate the feasibility of using SHGM to visualize the 3-D structure of the RNFL with high resolutions. Figure 2 illustrates a volumetric rendering of rat retina (), reconstructed from a -stack of simultaneously acquired images of SHG and two-photon excited intrinsic fluorescence. The high specificity of MT-SHG to the nerve bundles make them clearly distinguished from other retinal layers, allowing the size to be precisely determined in an objective manner.15 Axonal SHG was used to study the effect of axonal MT degeneration on the RNFL morphology. Time-lapse SHGM was performed on retinal flat mounts during continuous treatment with nocodazole, and a region of interest in the RNFL was repeatedly imaged every 5 min. Figure 3 depicts the result analyzed from 40 optical sections in a depth range of 60 μm containing the whole RNFL. The thickness map of the RNFL before nocodazole treatment in Fig. 3(a) shows the distribution in the RNFL thickness with maximum around 30 μm. We examined the SHG images to see if the RNFL thickness changed over time. Figure 3(b) shows an axial section at several time points, where the brightness of grayscale images is adjusted to normalize the contrast. It appears that the cross-section is relatively unaltered, although the SHG intensity decreases over time. For more direct comparison, the margins of the retinal nerve fiber bundles were identified by image segmentation and then superposed in Fig. 3(c). The overall shape of the RNFL remains intact, at least in the short term, even when MTs are depolymerized. Fig. 3Time-lapse SHGM of the RNFL during continuous treatment with nocodazole. (a) Thickness of the RNFL at . (b) Axial cross section corresponding to the dashed line in (a). From top to bottom, at 0, 20, 40, and 60 min in treatment, respectively. The length of axis labels is 30 μm. (c) Superposed margins of the retinal nerve fibers.  We further validate the conclusion, i.e., that the compromised MT network does not cause measurable deformation of the RNFL, by quantitatively analyzing the nocodazole-induced dynamic changes. A set of time-lapse SHGM imaging was conducted (), and then the RNFL thickness and the integrity of MT architecture were compared. The RNFL thickness was estimated by a bias-free procedure as described previously.15 We selected a small region of interest of in the RNFL with an initial thickness of approximately 20 μm, and the amount of intact MTs in the region can be deduced from the average SHG intensity. The background SHG intensity, taken from a gap between the retinal nerve fibers, was subtracted from the average SHG intensity. Figure 4 displays the time course of the normalized SHG intensity and the thickness of RNFL. While the disruptions in the MT network cause the strength of MT-SHG to weaken, the RNFL thickness remains relatively conserved in the same period. The result is consistent with the previous findings.13,14 Unlike the previous studies, where the birefringence and thickness of the RNFL were separately measured by two different modalities, we determined both properties in a single SHGM imaging. It is noted in Fig. 4 that the RNFL thickness exhibits gradual reduction after . This stems from the limitations of the quantification algorithm and does not necessarily imply actual thinning of the RNFL. Because the quantification procedure involves image-based automatic thresholding, it tends to underestimate the RNFL thickness for low-contrast images. The magnitude of errors is negligible when the signal-to-background ratio is larger than 2. The RNFL thickness can be accurately measured at even lower MT concentrations by improving the sensitivity of SHG detection, for example, via photon-counting. In conclusion, we have demonstrated the utility of MT-SHG for studying the dynamics of the RNFL involving morphological alterations and/or MT degradation. Using SHGM imaging, we confirmed that disintegration of axonal MTs does not result in immediate shrinking of the RNFL. MT-SHG is well-suited to study the dynamics of MTs. Because the intensity of SHG is highly sensitive to the regularity of the MT assembly, MT-SHG provides a means to probe the structural integrity of the labile cytoskeleton element across the RNFL. MT-SHG may thus facilitate sensitive detection of early glaucomatous changes before the onset of RNFL thinning. Moreover, the high spatiotemporal resolution of SHGM is ideal to visualize the molecular pathogenesis. ReferencesH. A. QuigleyA. T. Broman,
“The number of people with glaucoma worldwide in 2010 and 2020,”
Br. J. Opthalmol., 90
(3), 262
–267
(2006). http://dx.doi.org/10.1136/bjo.2005.081224 BJOPAL 0007-1161 Google Scholar
H. A. QuigleyE. M. AddicksW. R. Green,
“Optic-nerve damage in human glaucoma. 3. Quantitative correlation of nerve-fiber loss and visual-field defect in glaucoma, ischemic neuropathy, papilledema, and toxic neuropathy,”
Arch. Ophthalmol., 100
(1), 135
–146
(1982). http://dx.doi.org/10.1001/archopht.1982.01030030137016 AROPAW 0003-9950 Google Scholar
R. N. WeinrebS. ShakibaL. Zangwill,
“Scanning laser polarimetry to measure the nerve-fiber layer of normal and glaucomatous eyes,”
Am. J. Ophthalmol., 119
(5), 627
–636
(1995). AJOPAA 0002-9394 Google Scholar
D. Huanget al.,
“Optical coherence tomography,”
Science, 254
(5035), 1178
–1181
(1991). http://dx.doi.org/10.1126/science.1957169 SCIEAS 0036-8075 Google Scholar
J. S. Schumanet al.,
“Quantification of nerve-fiber layer thickness in normal and glaucomatous eyes using optical coherence tomography—a pilot-study,”
Arch. Ophthalmol., 113
(5), 586
–596
(1995). http://dx.doi.org/10.1001/archopht.1995.01100050054031 AROPAW 0003-9950 Google Scholar
J. F. de Boeret al.,
“Polarization effects in optical coherence tomography of various biological tissues,”
IEEE J. Sel. Top. Quantum Electron., 5
(4), 1200
–1204
(1999). http://dx.doi.org/10.1109/2944.796347 IJSQEN 1077-260X Google Scholar
B. Censeet al.,
“Thickness and birefringence of healthy retinal nerve fiber layer tissue measured with polarization-sensitive optical coherence tomography,”
Invest. Ophthalmol. Visual Sci., 45
(8), 2606
–2612
(2004). http://dx.doi.org/10.1167/iovs.03-1160 IOVSDA 0146-0404 Google Scholar
X. R. HuangR. W. KnightonL. N. Cavuoto,
“Microtubule contribution to the reflectance of the retinal nerve fiber layer,”
Invest. Ophthalmol. Visual Sci., 47
(12), 5363
–5367
(2006). http://dx.doi.org/10.1167/iovs.06-0451 IOVSDA 0146-0404 Google Scholar
X. R. HuangR. W. Knighton,
“Microtubules contribute to the birefringence of the retinal nerve fiber layer,”
Invest. Ophthalmol. Visual Sci., 46
(12), 4588
–4593
(2005). http://dx.doi.org/10.1167/iovs.05-0532 IOVSDA 0146-0404 Google Scholar
G. M. Pococket al.,
“The relationship between retinal ganglion cell axon constituents and retinal nerve fiber layer birefringence in the primate,”
Invest. Ophthalmol. Visual Sci., 50
(11), 5238
–5246
(2009). http://dx.doi.org/10.1167/iovs.08-3263 IOVSDA 0146-0404 Google Scholar
C. Balaratnasingamet al.,
“Axonal transport and cytoskeletal changes in the laminar regions after elevated intraocular pressure,”
Invest. Ophthalmol. Visual Sci., 48
(8), 3632
–3644
(2007). http://dx.doi.org/10.1167/iovs.06-1002 IOVSDA 0146-0404 Google Scholar
C. Balaratnasingam,
“Time-dependent effects of elevated intraocular pressure on optic nerve head axonal transport and cytoskeleton proteins,”
Invest. Ophthalmol. Visual Sci., 49
(3), 986
–999
(2008). http://dx.doi.org/10.1167/iovs.07-1090 IOVSDA 0146-0404 Google Scholar
B. FortuneG. A. CullC. F. Burgoyne,
“Relative course of retinal nerve fiber layer birefringence and thickness and retinal function changes after optic nerve transection,”
Invest. Ophthalmol. Visual Sci., 49
(10), 4444
–4452
(2008). http://dx.doi.org/10.1167/iovs.08-2255 IOVSDA 0146-0404 Google Scholar
B. Fortuneet al.,
“Intravitreal colchicine causes decreased RNFL birefringence without altering RNFL thickness,”
Invest. Ophthalmol. Visual Sci., 49
(1), 255
–261
(2008). http://dx.doi.org/10.1167/iovs.07-0872 IOVSDA 0146-0404 Google Scholar
H. LimJ. Danias,
“Label-free morphometry of retinal nerve fiber bundles by second-harmonic-generation microscopy,”
Opt. Lett., 37
(12), 2316
–2318
(2012). http://dx.doi.org/10.1364/OL.37.002316 OPLEDP 0146-9592 Google Scholar
L. MoreauxO. SandreJ. Mertz,
“Membrane imaging by second-harmonic generation microscopy,”
J. Opt. Soc. Am. B, 17
(10), 1685
–1694
(2000). http://dx.doi.org/10.1364/JOSAB.17.001685 JOBPDE 0740-3224 Google Scholar
R. W. KnightonX. R. HuangQ. Y. Zhou,
“Microtubule contribution to the reflectance of the retinal nerve fiber layer,”
Invest. Ophthalmol. Visual Sci., 39
(1), 189
–193
(1998). http://dx.doi.org/10.1167/iovs.06-0451 IOVSDA 0146-0404 Google Scholar
R. FadicJ. VergaraJ. Alvarez,
“Microtubules and caliber of central and peripheral processes of sensory axons,”
J. Comp. Neurol., 236
(2), 258
–264
(1985). http://dx.doi.org/10.1002/(ISSN)1096-9861 JCNEAM 0021-9967 Google Scholar
E. Panneseet al.,
“A comparison of the density of microtubules in the central and peripheral axonal branches of the pseudounipolar neurons of lizard spinal ganglia,”
Anat. Rec., 208
(4), 595
–605
(1984). http://dx.doi.org/10.1002/ar.1092080415 ANREAK 0003-276X Google Scholar
J. Chenet al.,
“Projection domains of MAP2 and tau determine spacings between microtubules in dendrites and axons,”
Nature, 360
(6405), 674
–676
(1992). http://dx.doi.org/10.1038/360674a0 NATUAS 0028-0836 Google Scholar
P. W. Baaset al.,
“Polarity orientation of microtubules in hippocampal neurons—Uniformity in the axon and nonuniformity in the dendrite,”
Proc. Nat. Acad. Sci. U. S. A., 85
(21), 8335
–8339
(1988). http://dx.doi.org/10.1073/pnas.85.21.8335 PNASA6 0027-8424 Google Scholar
|