
|
|
|
Optoacoustic tomography (OAT), also referred to as photoacoustic tomography, is a noninvasive imaging modality offering the unique capacity of mapping optical absorption in deep scattering tissues.1 Thereby, high-resolution visualization of spectrally distinct functional and molecular biomarkers and contrast agents can be done with OAT by using illumination at multiple optical wavelengths.2,3 In common optoacoustic implementations, short-pulsed illumination is used, in which case the reconstruction procedure consists of calculating the initial pressure (proportional to the absorbed optical energy) from the pressure variations measured at several positions around the imaged object. For simplicity, a uniform medium with no acoustic mismatch is usually assumed, so that the accuracy of the tomographic reconstructions may deteriorate in case the acoustic impedance varies within the sample. In general, biological tissues are characterized by nonconstant density and speed of sound while different wave propagation effects take place depending upon the degree of acoustic heterogeneity. Slight variations of speed of sound result in time-shift of the acoustic signals without steering the propagating wavefront.4–6 On the other hand, additional acoustic phenomena, such as reflections or scattering, take place in the interface of media with strong acoustic mismatch, which may cause strong artefacts in the tomographic reconstructions.7,8 Acoustic attenuation may also play a role in the quality of the reconstructions when imaging at high ultrasonic frequencies.9,10 A procedure for correction of image artefacts due to acoustic reflections or scattering has been recently introduced.7 It is based on weighting the detected optoacoustic signals with the probability that they are not affected by reflected or scattered waves. In this way, the reconstruction is done preferably with the signals that more likely correspond to an acoustic wave propagating directly from the excitation point to the detector. Indeed, the accuracy of estimating such probability depends significantly upon the available information on the distribution of acoustic scatterers inside the imaged volume. It has been shown that if an area , containing the optical absorbers, and an area inside , containing the acoustic scatterers, are a priori known, the statistical correction procedure attains significantly better results as compared to the case in which random assumptions are made regarding the location of acoustic scatterers.8 Thereby, it is important being able to estimate an area containing the strong acoustic scatterers of the object in order to improve the optoacoustic tomographic reconstructions. This issue is addressed in this article. The probability that a scattered wave with unit amplitude (in arbitrary units) is measured at the th detector at instant can be expressed as:8 where is a constant that depends on the characteristics of the scatterers and is the instant at which a wave generated at (inside ) and scattered at (inside ) arrives at the th detector. The probability that the signal captured at the th detector at instant corresponds to a direct (uninterrupted) propagation is given by Ref. 7: where being the probability that the signal captured at the th detector at instant is distorted due to acoustic scattering. As the distortion in the signal is produced when the amplitude of the scattered wave is above the noise level, we consider that is proportional to [Eq. (1)] and can be estimated via:8where is a weighting parameter that depends on the internal object’s features to be determined heuristically. corresponds to the histogram yielded by means of the Monte Carlo method by randomly generating pairs of points in and , respectively.If the area is not known, the acoustic scatterers can be assumed to be located randomly within , so that can approximately be expressed as:7 where is again a weighting parameter and is the part of covered by a circle of a radius centred at the th detector.The optical absorption at a given point can then be reconstructed by means of the weighted back-projection algorithm via:7 where is the pressure measured at the th detector, located at , at instant .The distribution of acoustic properties within the imaged object can be estimated using ultrasonic techniques. However, optoacoustically generated waves can also be used to address this challenge. For instance, a strong optical absorber can be introduced into the OAT setup in order to simultaneously generate speed of sound and optoacoustic tomograms,11 so that the information retrieved on the speed of sound distribution can be used to improve the tomographic optoacoustic reconstructions. In this paper, we describe a method to estimate the distribution of acoustic scatterers within a sample by introducing a strong optical absorber in the OAT setup, so that the signals captured by the ultrasonic transducer are first used to reconstruct the distribution of acoustic scatterers and subsequently this information is used to perform a better optoacoustic reconstruction. Experimental validation of the proposed method was done using the setup depicted in Fig. 1. A cylindrically focused ultrasonic transducer with a central frequency of 3.5 MHz and a focal length of 38.1 mm was used to collect the optoacoustic signals generated with 6-ns duration illumination pulses at 605 nm for a set of angular positions (projections) of the imaged object. The captured time-resolved optoacoustic signals were averaged 64 times and band-pass filtered with cutoff frequencies of 0.1 and 5 MHz. The object was rotated over 360 deg with angular steps of 2 deg using high-speed rotation stage. A black hair with an approximate diameter of 80 μm was introduced as an optical absorber in between the imaging sample and the transducer, which can be considered as a point acoustic source for the frequency range of the transducer employed. The output beam was split into two parts and directed through a linear light diffuser from two opposite sides to attain ring-type uniform illumination on the surface of the object and simultaneously illuminate the hair in the imaging plane. The hair is positioned in a way that the optoacoustic waves generated by it and scattered within the sample are all detected later than all the directly propagating signals originating from the imaged object. This allows for efficient separation in time between the two types of signals. Neverthelss, the scattered hair signals can still be affected by indirect signals, originating at the object and scattered elsewhere, although their contribution can be neglected due to much lower amplitude. Figure 2 shows a typical signal corresponding to the phantom described below. In this case, one can clearly differentiate the directly propagating signal generated by the hair (P1), the waves generated in the imaged object (P2), and the scattered hair signal (P3). Fig. 1Layout of the experimental setup used to measure the distribution of acoustic scatterers. An optical point absorber (a black hair in our case) is introduced in between the ultrasonic transducer and the imaged object. 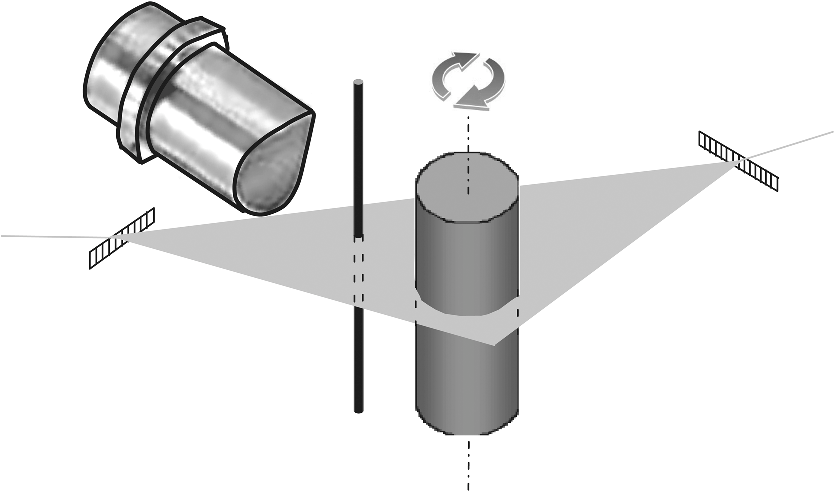 Fig. 2Optoacoustic signal captured by the transducer, corresponding to the phantom experiment described in Fig. 1. The parts of the signals corresponding to different waves can be differentiated: directly propagating signal generated by the hair (P1), waves generated in the imaged object (P2), and the scattered hair signal (P3).  In order to reconstruct an image representing the distribution of acoustic scatterers, we followed a heuristic approach based on a modification of the back-projection algorithm of Eq. (5). The usual algorithm implies back-projecting the quantity directly onto the optoacoustic point sources in the image grid. In the modified reconstruction procedure suggested herein we back-project the same quantity onto the points where the optoacoustic signals generated by the hair have been scattered. Subsequently, the distribution of acoustic scatterers is estimated via where , i.e., the back-projection is done along an ellipse whose foci are located at the position of the detector and at the position of the optical absorber . stands for the acoustic pressure being windowed with a rectangular function so that only the part corresponding to the scattered hair signal is taken (P3 in Fig. 2). The negative sign in Eq. (6) is introduced to correct for the pressure inversion taking place for our phantom experiments due to reflection of the waves by a hollow cavity, as described in the following.For the validation experiment, a tissue-mimicking agar phantom was used. Black India ink and Intralipid were added to the agar solution, resulting in absorption and reduced scattering coefficients of and , respectively.7 Areas with higher optical absorption () and a hollow cylindrical cavity consisting of a straw filled with air were included in the phantom. Due to position of the hollow cavity, the artefacts due to acoustic scattering were mainly created around the central area of the phantom. The geometrical features of the phantom are shown in Fig. 3(a). The darker regions correspond to the higher optical absorption areas whereas the straw is indicated with a white area limited by a dashed circumference. Figure 3(b) shows the tomographic reconstruction obtained with the standard back-projection algorithm (no weighting). As expected, strong artefacts are present due to the scattering of the acoustic waves at the surface of the straw. However, the boundary of the phantom can still be distinguished, thus, the area containing all the optical absorbers and acoustic scatterers can be identified [area inside the dashed white circumference in Fig. 3(b)]. This information can subsequently be used to improve the tomographic reconstruction by using the weighted back-projection algorithm with given via Eq. (4). The resulting image in Fig. 3(c), obtained with , clearly shows reduction of the artefacts. However, some significant artefacts in the central region of the image still remain. The image showing the distribution of acoustic scatterers, obtained using Eq. (6), is presented in Fig. 3(d). The position of the points where scattering of the acoustic waves occurs (surface of the straw in the current case) can be readily estimated from this image. An area containing all the acoustic scatterers can be subsequently determined [an area inside the dashed white circumference in Fig. 3(d)], and this information can then be used for estimating using Eq. (3). Then, the tomographic reconstruction obtained with the weighted back-projection algorithm with is shown in Fig. 3(e). Clearly, most of the artefacts due to acoustic scattering are removed. Also, the surface of the straw is visible in Fig. 3(e), which allows verification of the correctness of the reconstructed acoustic scattering distribution. The values of in each case are determined heuristically so that the best possible image is obtained. Fig. 3Tomographic optoacoustic reconstructions of phantom with acoustically-scattering air cavity. (a) Geometrical description of the phantom. (b) Standard back-projection reconstruction. (c) Weighted back-projection reconstruction, considering the acoustic scattering occurs in the entire phantom. (d) Reconstruction of the acoustic scattering distribution. (e) Weighted back-projection reconstruction, for which the scattering distribution has been taken into account.  Overall, we have presented an adaptation of an optoacoustic tomographic system that allows determining the distribution of acoustic scatterers in the imaged volume, which can subsequently be used to improve quality of optoacoustic reconstructions by reducing artefacts due to acoustic scattering. According to the suggested method, a small strongly absorbing object (e.g., a black hair) is introduced in between the imaged object and the ultrasonic while a heuristical modification of the back-projection algorithm is used to reconstruct the distribution of acoustic scatterers. It has been demonstrated that optoacoustic tomographic reconstructions can be significantly improved if the distribution of acoustic scattering in the imaged volume is known and weighted for in the reconstruction procedure. In conclusion, the suggested methodology helps improving the tomographic optoacoustic images when strong acoustic scattering or reflections are present in the object, which in realistic imaging scenarios may arise from bones, lungs or other air cavities in living organisms. AcknowledgmentsDaniel Razansky acknowledges support from the German Research Foundation (DFG) Research Grant (RA 1848/1) and the ERC Starting Independent Researcher Grant. Vasilis Ntziachristos acknowledges support from the ERC Senior Investigator Award and the Medizin Technik BMBF award for excellence in medical innovation. ReferencesL. V. WangS. Hu,
“Photoacoustic tomography: in vivo imaging from organelles to organs,”
Science, 335
(6075), 1458
–1462
(2012). http://dx.doi.org/10.1126/science.1216210 SCIEAS 0036-8075 Google Scholar
X. Wanget al.,
“Non-invasive laser-induced photoacoustic tomography for structural and functional in vivo imaging of the brain,”
Nat. Biotechnol., 21
(7), 803
–806
(2003). http://dx.doi.org/10.1038/nbt839 NABIF9 1087-0156 Google Scholar
D. Razanskyet al.,
“Multispectral opto-acoustic tomography of deep-seated fluorescent proteins in vivo,”
Nat. Photonics, 3
(7), 412
–417
(2009). http://dx.doi.org/10.1038/nphoton.2009.98 1749-4885 Google Scholar
Y. XuL. V. Wang,
“Effects of acoustic heterogeneity in breast thermoacoustic tomography,”
IEEE Trans. Ultrason. Ferroelectr. Freq. Control, 50
(9), 1134
–1146
(2003). http://dx.doi.org/10.1109/TUFFC.2003.1235325 ITUCER 0885-3010 Google Scholar
X. L. Deán-BenV. NtziachristosD. Razansky,
“Acceleration of optoacoustic model-based reconstruction using angular image discretization,”
IEEE Trans. Med. Imag., 31
(5), 1154
–1162
(2012). http://dx.doi.org/10.1109/TMI.2012.2187460 ITMID4 0278-0062 Google Scholar
D. ModgilM. A. AnastasioP. J. L. Riviere,
“Image reconstruction in photoacoustic tomography with variable speed of sound using a higher-order geometrical acoustics approximation,”
J. Biomed. Opt., 15
(2), 021308
(2010). http://dx.doi.org/10.1117/1.3333550 JBOPFO 1083-3668 Google Scholar
X. L. Deán-Benet al.,
“Statistical approach for optoacoustic image reconstruction in the presence of strong acoustic heterogeneities,”
IEEE Trans. Med. Imag., 30
(2), 401
–408
(2011). http://dx.doi.org/10.1109/TMI.2010.2081683 ITMID4 0278-0062 Google Scholar
X. L. Deán-BenV. NtziachristosD. Razansky,
“Statistical optoacoustic image reconstruction using a-priori knowledge on the location of acoustic distortions,”
Appl. Phys. Lett., 98
(17), 171110
(2011). http://dx.doi.org/10.1063/1.3564905 APPLAB 0003-6951 Google Scholar
P. J. L. Riviere,
“Image reconstruction in optoacoustic tomography for dispersive acoustic media,”
Opt. Lett., 31
(6), 781
–783
(2006). http://dx.doi.org/10.1364/OL.31.000781 OPLEDP 0146-9592 Google Scholar
X. L. Deán-BenD. RazanskyV. Ntziachristos,
“The effects of acoustic attenuation in optoacoustic signals,”
Phys. Med. Biol., 56
(18), 6129
–6148
(2011). http://dx.doi.org/10.1088/0031-9155/56/18/021 PHMBA7 0031-9155 Google Scholar
S. Manoharet al.,
“Concomitant speed-of-sound tomography in photoacoustic imaging,”
Appl. Phys. Lett., 91
(13), 131911
(2007). http://dx.doi.org/10.1063/1.2789689 APPLAB 0003-6951 Google Scholar
|


