|
|
1.IntroductionOptical coherence tomography (OCT)1 is an interferometric imaging technique which can non-invasively obtain a tomographic image of a sample with micrometer resolution. In ophthalmology, OCT is widely used for retinal imaging. In clinical practice, there is a need for several measurement methods such as multiple detection of two-dimensional (2-D) imaging2 and three-dimensional (3-D) imaging,3 which take much measurement time. The imaging time, however, should be short enough in order to avoid motion artifacts or blinking of the eye. For these reasons, fast and highly sensitive OCTs have been developed.4 One of the first generation OCTs was a time domain (TD) system that swept a mechanical mirror1 to scan an area. In ophthalmology, 400 A-scans per second of OCT images can be obtained with commercial TD equipment. Later, a Fourier domain (FD) OCT was developed, which improved the scanning speed by more than ten-fold because there were no moving mechanical parts. There are two main types of FD OCT system: a spectral domain (SD) OCT5 and a swept source (SS) OCT.6,7 These systems have advantages of high sensitivity as well as fast imaging.8–10 The SD-OCT acquires an interferometric signal by using a spectrometer with a line sensor. The signal processing of the data from the line sensor includes background subtraction, resampling for -space, and Fourier transformation. With an experimental setup, 312.5 k A-scans per second was achieved.11 Currently, most of the commercial OCTs for retinal imaging are SD-OCT12 with 800–900 nm wavelength. On the other hand, the SS-OCT uses a SS laser and detects a signal by a photodiode instead of the line sensor while sweeping the wavelength. The detected signal is digitized, and then the similar processing is applied to this digital signal. The early SS-OCT has lower axial resolution than the SD-OCT because it commonly uses a laser with a wavelength longer than 1 μm. To date, several groups demonstrate the ability of better penetration and good resolution.13,14 Furthermore, a speed of more than 400 k A-scans per second has been achieved with the experimental SS-OCT setups.14,15 Thanks to the development of the sensors or the light sources, the OCT has progressed so much. Here, we are interested in the multi-beam OCT not only for high speed imaging but also functional imaging. Until now, a 4-beam TD-OCT system was reported.16 This used four parallel interferometers which can image a human tooth at four different depths of focus. The authors improved the lateral resolution and imaging depth, and the line rate was 8000 A-scans per second by using a rapid scanning optical delay. On the other hand, a dual beam Doppler SD-OCT was reported.17 The system used two beams with different incident angles and measured the absolute blood flow using two spectrometers and two reference optical paths. The maximum line rate was 28,000 A-scans per second, and a zebrafish larva was imaged. These two studies were not developed for a human eye; it is more difficult to measure the eyes because of safety issues and eye motion. Safety standards, such as International Electrotechnical Commission (IEC), International Organization for Standardization (ISO), and American National Standard Institute (ANSI) must be considered, as these safety standards limit the laser power per unit area on the fundus. A 2-beam Doppler SD-OCT for the human eye was reported,18 with a similar measurement principle to the previous work17 but different system configuration. The light beam was split into two polarized beams and focused on the same position at two different angles. The authors used two spectrometers but one reference optical path, and the line rate was 18 kHz. Other 2-beam Doppler schemes that focus two beams on neighboring positions were later reported.19,20 On the other hand, a dual spot SS-OCT with 1050 nm wavelength was reported.14 The authors used parallel interferometers in which the system could measure different areas on the fundus. This paper describes a three-beam SD-OCT system for high resolution retinal imaging by using a center wavelength of 840 nm. The laser safety, including laser power, number of beams, and an arrangement of the beams for the multi-beam OCT system, is precisely considered in Sec. 4.1. The three beams pass through three interferometers and focus on three different areas, and are detected by one spectrometer with a single line sensor. This configuration achieves more than 200,000 A-scans per second with good image quality even for diseased eyes. Different characteristics among the beams such as pixel resolution, roll-off characteristics, and sensitivity are adjusted by using post-processing. Images of a model eye, a healthy human eye, and a diseased eye are shown and evaluated. We discuss the differences in characteristics among the beams and the imaging results. 2.SystemThe three-beam SD-OCT is illustrated in Fig. 1. It consists of three independent optic-fiber Michelson interferometers which include reference, sample, and detection optical path, respectively. Three super luminescent diodes (SLD) are used, which have a bandwidth of 45 nm centered at an 840 nm wavelength. The beams are split by fiber optic couplers with coupling ratio. All fibers used in this system are single-mode fibers. The objective optics of the sample optical path and the spectrometer of the detection optical path are shared by the three beams. Fig. 1Illustration of the three-beam SD-OCT, BPF: band-pass filter, ND: neutral density filter, SW mirror: switching mirror, U: upper area, M: middle area, L: lower area.  Figure 2 shows a picture of the three interferometers and a collimator lens with a fiber array. The interferometers are attached to a fundus camera (Canon, Inc.). The sample optical path consists of polarization controllers, a fiber array, a collimation lens, an XY scanner, a lens 1, a lens 2, a focusing lens, and an objective lens. All lenses are in common usage for the three beams and custom designed. The focal lengths of the collimation lens, the lens 1, the lens 2, the focusing lens, and the objective lens are 14 mm, 45 mm, 30 mm, , and 35 mm, respectively. There is a switching mirror between the objective lens and the focusing lens. It separates the OCT beams mechanically from the light for the cornea alignment. Nine fibers are connected to the fiber array with 0.9 mm separation and three of them are used in this system for the upper (U), middle (M), and lower (L) area. The six remaining fibers in the fiber array are prepared for a probable future extension of this system but not currently in use. Each beam emitted from the fiber array is transferred to the form of parallel by the collimation lens. The collimation lens is a custom-designed telecentric type. The three beams are directed to the rotation center of the XY scanner and are scanned by it. An eye is positioned such that the pupil of the eye is aligned with the pivot point of the beams. The reflectivities at the surface of the collimation lens, the lens 1, the lens 2, the focusing lens, and the objective lens are less than 0.1% at around 840 nm wavelength in order to decrease the signal loss from the eye and ghosting from the optics. This system has three independent SLD power monitors and a scanner condition monitor which can detect suspending status of the scanner. Therefore, the system can block the radiating beams to the eye by using a mechanical shutter when in emergency or not in measurement. The reference optical path consists of three sets of polarization controllers, neutral density (ND) filters, dispersion compensation glasses, band-pass filters (BPF), dispersion compensation prisms, mirrors, and stages for moving the mirrors. The ND filters can adjust the power to a line sensor. The BPFs cut unnecessary wavelengths to eliminate crosstalk between the beams on the sensor. The transmittance of the BPF from 815 nm to 865 nm is at least 80% (mainly 95%) and outer range of BPF is cut off. The ND filters and mirrors are controlled independently by the computer. The body of the spectrometer is separated from the interferometers to avoid vibration during operation, which are connected by three optical fibers. The spectrometer detects the three beams emitted from the fibers on a fiber unit by using one line sensor, which consists of a collimation lens, a diffraction grating, a focusing lens, and a CMOS line sensor (Basler Inc. spL4096-140,000). The focal lengths of the focusing lens and the collimating lens are 147 mm and 100 mm, respectively. The orientation of the fiber ends on the fiber unit is adjusted so that the beams exit perpendicularly to the principal surface of the collimating lens. The three beams are diffracted by a single grating (, Wasatch Photonics, Inc.) and incident angles of the beams with respect to the transmission diffraction grating are different from each other. These different incident angles lead to different numbers of pixels of the illuminating areas on the line sensor and are related to the different diffraction efficiency. Table 1 shows the system performance. The transmittance is the measured value from the objective lens to the spectrometer. The differences among the values are due to the different coupling efficiency at the fiber array, the loss at the fiber connecters and the differences among the optical devices. The efficiency in the spectrometer is the calculated value of the optics by using Code V (Synopsys, Inc.). The difference is caused by the incident angle to the grating. As the results, the shot-noise limit sensitivity9 is calculated by using the following value: the sample powers 830 μW, the integration time 14.2 μs, and the center wavelength 840 nm. Table 1System performance.
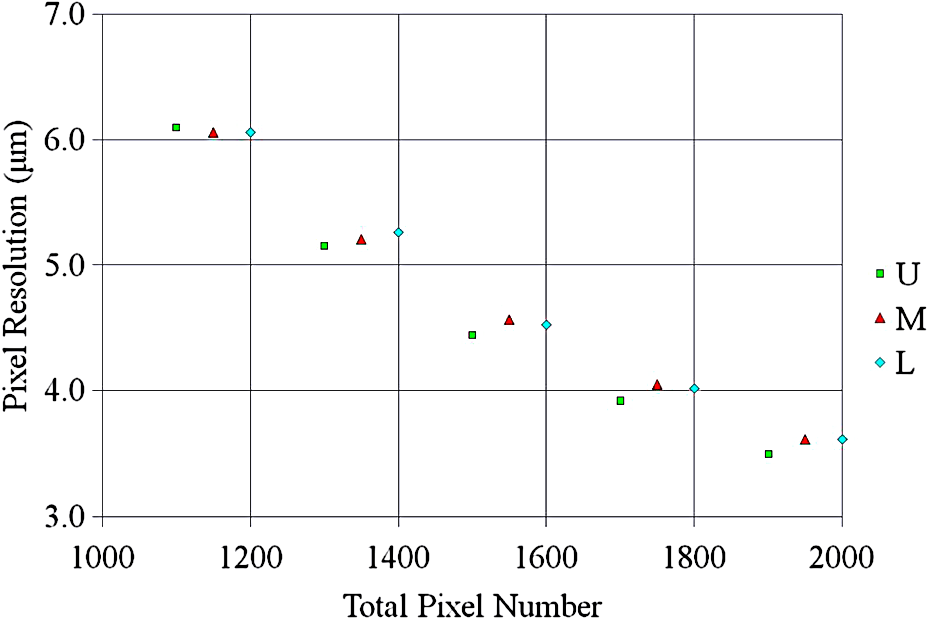
The total pixel number of the sensor is 4096, so more than 1000 pixels can be used for each beam. This is the minimum value because the number is related to the range of measurement depth: a larger number yields a deeper range of depth. For retinal imaging, a range of deeper than 2 mm is appropriate not only for the whole retinal imaging but also the alignment of the eye. The effective pixel number after Fourier transformation is half of the each beam. The line rate of the sensor is 70 kHz, giving a total line rate equivalent to 210 k A-scans per second in this system by using the three beams. The exposure time is 14.2 μs, hence it takes 14.2 ms for one B-scan image (1000 A-scans). However, the scanner needs time to return, therefore, the cycle time for one B-scan measurement is about 20 ms. This means that the required data transfer rate is about (). We use a high-end PC (Hewlett Packard, Inc., HP Z800 workstation, Windows 64-bit operating system), a high-speed frame grabber (Matrox, Inc., Matrox Solios), and a home-made controller for motor drivers. For this reason, shared usage of the line sensor as well as the frame grabber for the three beams avoids overhead time among the frame grabbers compared to using three frame grabbers. 3.System Evaluation3.1.SpectrumMeasurements of the reference lights are shown in Fig. 3. The light from the sample optical path is blocked by a cover of the objective lens. The vertical axis is the intensity measured by the line sensor and the horizontal axis is the pixel position. From 0 on the horizontal axis to 4096, the three beams are the upper, middle, and lower areas, respectively. The wavelength on the smaller pixel number side of those three areas is longer than on the larger pixel number side. These signals are adjusted by ND filters so as to be 70–80% of the maximum. The signal level between the neighboring beams is suppressed by the band-pass filter and reaches the noise level of the sensor. This means that there are no crosstalks between the beams. The different shapes of detected spectra are caused by the use of three independent light sources. The high-frequency component of each spectrum is fixed noise from the interferometer, most of which can be eliminated by signal processing. The widths of 1150 (U), 1200 (M), 1250 (L) pixels which exceed the noise level and correspond with the entire bandwidths of the light sources, are used from each beam for the signal processing. 3.2.Pixel ResolutionThe axial resolution of the OCT is determined by the bandwidth of the light source. We use the same three light sources, however, the areas extracted from the spectrometer are not exactly the same bandwidth. Therefore, those pixel resolutions should be adjusted for 3-D imaging. The bandwidth of the spectrometer in space is given by: where, and are the maximum wavelength and minimum wavelength respectively.The pixel resolution of the Fourier domain OCT is given by: The light source has a center wavelength of 840 nm and bandwidth of 45 nm. The axial resolution is calculated as 7.8 μm in air using this equation. Usually, the bandwidth of the light source is the full width at half-maximum, but this is not consistent with the detectable bandwidth of the spectrometer which is wider than the bandwidth of the light source. For this reason, the pixel resolution of the SD OCT is better than the axial resolution. Note that the pixel resolution can be changed by zero padding, which is equivalent to expanding the bandwidth of the spectrometer numerically. In our adjustment, zeros are added evenly to the longer and shorter wavelength sides. Figure 4 shows the results of the relationship between the pixel resolution and pixel number. The vertical axis is the numerical pixel resolution and the horizontal axis is the total pixel number after zero padding. The pixel resolution is measured by the moving distance of the mirror. The squares, triangles and diamonds show the upper, middle, and lower areas, respectively. The first three data of 1100, 1150, and 1200 are approximately 6.1 μm without zero padding. This means that the extracted spectrum has almost same bandwidth even though the pixel number is different. The other data are calculated by zero padding. Here we adjust the total pixel number to 1340, 1400, 1460 pixels for 5 μm pixel resolution. The image pixels are 500 in depth range therefore 2.5 mm is sufficient for retinal imaging. 3.3.Roll-Off CharacteristicsThe different pixel number and illumination area on the sensor, which means different spectral resolutions, leads to different roll-off characteristics. The pixel number is the sampling number, thus it is related to the period of the sinc function after Fourier transformation. The illumination area is related to the diffraction efficiency of the grating. The roll-off characteristics are shown in Fig. 5(a) upper, 5(b) middle, 5(c) lower, respectively. The vertical axis is relative intensity from zero delay, and the horizontal axis is the position of the mirrors. A retroreflector, which could adjust more easily than a mirror, was used so that the angle could be changed to reflect perpendicularly on the fundus position. Typical point spread functions were measured at several points by moving mirrors at the reference optical paths. Small peaks at the positions around 350 μm and 2400 μm are fixed noise inside the interferometers and can be eliminated by the background subtraction. The intensity drop of each beam at 2000 μm was , and , respectively, and the sensitivity at 1000 μm was 95 dB, 97 dB, and 94 dB, respectively. All of the sensitivities were 5 dB lower as compared to the Shot-Noise Limit Sensitivity in the Table 1, since they do not contain losses at the retroreflector, coupling efficiencies at the spectrometer input, and losses at the sensor. The performance of the middle area was better than those of the other areas. This tendency is consistent with our calculation using the model,21 which is partly due to the higher diffraction efficiency at the middle area. The sensitivity at middle area and the roll-off characteristic do not show a big difference from our single-beam SD-OCT in the experimental setup: this sensitivity is near to the upper limit to avoid coherence noise.22 The resolutions of the upper and lower beams are worse than that of the middle beam in this measurement because the polarization state changed23 due to the temperature change after the original adjustment. 4.Three-Dimensional Imaging4.1.Laser Safety ConsiderationsFigure 6 shows the scan area; (a) the relationship among the beams, and (b) the scan area of each beam. The formed angles between the upper and middle beam and ones between the middle and lower beam are 10.8 deg respectively, which is 188.5 mrad. The beam diameter of each beam at the pupil is 1 mm and these beams overlap at the same position theoretically. According to the IEC 60825-1,24 we must consider two conditions for the safety, the first is the “maximum angular subtense (Sec. 3.54)”,24 and the other is the “all other retinal limits (Sec. 9.3.3)”.24 Those formed angles exceed the “limiting angle of acceptance (100 mrad)”.24 This means that the overlapping effects of plural beams on the retina can be ignored. Therefore, these three beams are treated as a single beam. The most severe condition is a vertical scan ( direction) for the alignment shown with a dotted circle in Fig. 6(b). The “accessible emission limits (AEL)”24 to the eye is calculated from Table 5 in Ref. 24: “Accessible emission limits for class 1 laser products in the wavelength range between 400 nm and 1400 nm”.24 The duration time in Table 5 in Ref. 24 is 10 s by referring to Table 10 in Ref. 24, “Correction factors and breakpoints for use in AEL and MPE evaluations”,24 because the angular subtense in this system 1.2 mrad is smaller than 1.5 mrad. OCT beam is classified into the “Repetitively pulsed or modulated lasers 8.3(f)” and “For varying pulse widths or varying pulse durations 3(b),”24 since the beams are scanned on the retina. The AEL is determined by the duration of the total-on-time-pulse (TOTP). All individual pulse energies during 10 s are added as 4.2 s under a test mode (small area scans for model eye measurement) and then the AEL is calculated as 930 μW. In case of a normal mode (10 mm area scans for human eye measurement), the TOTP is less than 1 s. The maximum beam power of each beam to an eye is set to 830 μW, which is 10% lower than the AEL. The IEC 60825-1 only claims the eye safety at retina while the ISO 15004-225 is filed for corneal safety. The ISO 15004-2 classifies the ophthalmic instruments into two groups. According to the classification flowchart (Annex F),25 this system which uses certified components of reducing the emitted radiation below the emission limits is classified as the Group 1. The Group 1 limit values are based upon a 2 h exposure. OCT measurements take up to 10 min in general for one eye including the alignment between the eye and the instrument. We select the parameter from Table 2 in Ref. 25, “Group 1 limit values for continuous wave instruments,”25 to calculate the emission limits. This system with 840 nm wavelength is categorized into “weighted anterior segment visible and infrared radiation irradiance for convergent beam only (Sec. 5.4.1.5)”25 with wavelength between 380 nm and 1200 nm, since OCT system with 1 mm beam diameter at pupil is the “convergent beam” and no other lights such as the cornea alignment are overlapped due to the switching mirror. The power limit is calculated at . The total power of the three beams to the eye is 2.49 mW which is less than one-tenth of the limits. From these reasons, this clinical study is approved by Institutional Review Board. Informed consent was obtained from the volunteers for this clinical study. Note that the safety standards may vary depending on the country. The compatibility with other safety standards should be considered if the same or a similar system is utilized in the other country. These three beams are focused on fundus with 3.1 mm separation in the direction. The beam is scanned from the top-left corner to the bottom-right corner, while keeping these separations during raster scanning. Each beam scans an area of including an overlapped region of 20% to compensate for eye motion. Solid rectangle area is extracted for the imaging. The spot size of each beam is 20 μm on the fundus. The B-scan can be taken by 500, 1000, 2000 A-scans. In the case of measuring an area of , 250, 500, 1000 B-scan modes can be selected. A model eye is used for adjusting each area, in which the image is compensated for pixel resolution, roll-off characteristics, contrast, and mirror position. The procedure is first to adjust the pixel resolution, and second the mirror positions. Then the roll-off characteristics and contrast are adjusted to make the images of the overlapped area the same. The mirrors are positioned on the choroid side so that the system measures a region of interest such as fovea with high sensitivity even if the eye has a larger curvature. The total data quantity for 3-D imaging is about 600 MB for 250 B-scans (1000 A-scans) including the 20% overlapped area. At the maximum data size, it is about 5 GB for 1000 B-scans (2000 A-scans). However, hardware capacity is continually improving we expect the capacity issue will be solved in the near future. 4.2.Model Eye ImagingA model eye, which was a glass sphere with mainly cross patterns on the bottom, was used to evaluate this system. As its reflectivity was very high compared to a human eye, an ND filter was placed in front of it. The time taken to measure an area of was within 2 s. Each beam scans 96 times in an area of 3.8 mm wide and each B-scan has 1000 A-scans. The overlapped area was removed manually (the similar images are searched between the beams) and 250 B-scans were extracted in this case. Figure 7(a) is a depth integrated fundus view. The arrows C and D show the boundary of sub-scanfields. It is not easy to find the boundary without instruction. Figure 7(b) is a cross-sectional image at arrow A, and Fig. 7(c) is a tomographic image at arrow B. All OCT images in this paper are no-averaging data. Higher contrast around the center is due to specular reflection. Figure 7(d) and 7(e) are tomographic images at arrow C, for the upper and middle beams, respectively, showing no clear difference between the images. Figure 7(f) and 7(g) are tomographic images at arrow D, for the middle and lower beams, respectively. 4.3.Human Eye ImagingFigure 8 shows an OCT image of a volunteer’s eye. The measurement mode is the same: an area of within 2 s. In the case of a human eye, we believe that the appropriate measurement time is less than 2 s for one measurement without blinking. When the total number of imaging points is 250,000, high-density B-scan imaging () is better than equivalent () area scan. Since B-scan is used for diagnosis, the lower density of B-scans in direction could be used for a screening of disease if the system is used for clinical applications. The pixel resolution is 10 μm for (fast scan) and 40 μm for (slow scan) where calculated spot size of the each beam on the fundus is 20 μm in this case. Fig. 8Human volunteer eye, (a) depth integrated fundus view, (b) cross-sectional image at A, (c) tomographic image at B, (d) tomographic image of upper beam at C, (e) tomographic image of middle beam at C, (f) tomographic image of middle beam at D, (g) tomographic image of lower beam at D.  Figure 8(a) is a depth integrated fundus view without a motion correction. Arrows C and D are the boundary of sub-scanfields. Figure 8(b) is a cross-sectional image of the arrow A. We can see a gap at the boundary as well as fluctuation of layers. Figure 8(c) is a tomographic image at arrow B. It includes the macular and a part of the optical disk. We can see several layers such as the nerve fiber layer and retinal pigment epithelium. Figure 8(d) and 8(e) are tomographic images at arrow C: the upper and middle beams, respectively. The positions of blood vessels do not match. Figure 8(f) and 8(g) are tomographic images at arrow D: the middle and lower beams, respectively. The positions of blood vessels match each other better than in the images at arrow C. The contrast difference between sub-scanfields of the human eye is bigger than that of the model eye. One of the reasons for this is the difficulty of alignment. For the model eye, the optical axis can be adjusted perfectly, but it is difficult to adjust the human eye because of unstable fixing of not only the eye but also the head. Additionally, for the alignment, we use the function of the fundus camera which is not optimized for OCT measurement. When the axis of the beam moves from the center on the pupil plane during the measurement, optical properties are differ because of differences in the optical path as well as dispersion. In the other case, the pivot position of the beams shifts from the pupil, and the upper or lower beam is blocked by the iris especially far region from the center. The movement of an actual eye is more complicated such as rotation around the axis and combinations of thereof. 4.4.Diseased Eye ImagingThis clinical study was registered in the University Hospital Medical Information Network as UMIN000003232 in 22 Feb, 2010.26 We measured more than 200 health and diseased eyes. The diseased eyes included macular disease, glaucoma, diabetic retinopathy, and retinal vein occlusion. Figure 9 shows an OCT image of the epimacular membrane. The measurement mode is the same: an area of within 2 s. The overlapped area was removed manually and 248B-scans were extracted. Figure 9(a) is a depth integrated fundus view. During this measurement it has at least one big eye motion. Three yellow arrows indicate the results of the eye motion. This simultaneous motion artifact in three areas is one of the big disadvantages of the three-beam OCT. The contrast of the upper beam area is changed after the motion especially in the upper beam. This indicates that the part of the upper beam is blocked by the iris before the movement. Fig. 9Epimacular membrane, (a) depth integrated fundus view, (b) cross-sectional image at A, (c) tomographic image at B, (d) tomographic image of upper beam at C, (e) tomographic image of middle beam at C, (f) tomographic image of middle beam at D, (g) tomographic image of lower beam at D. 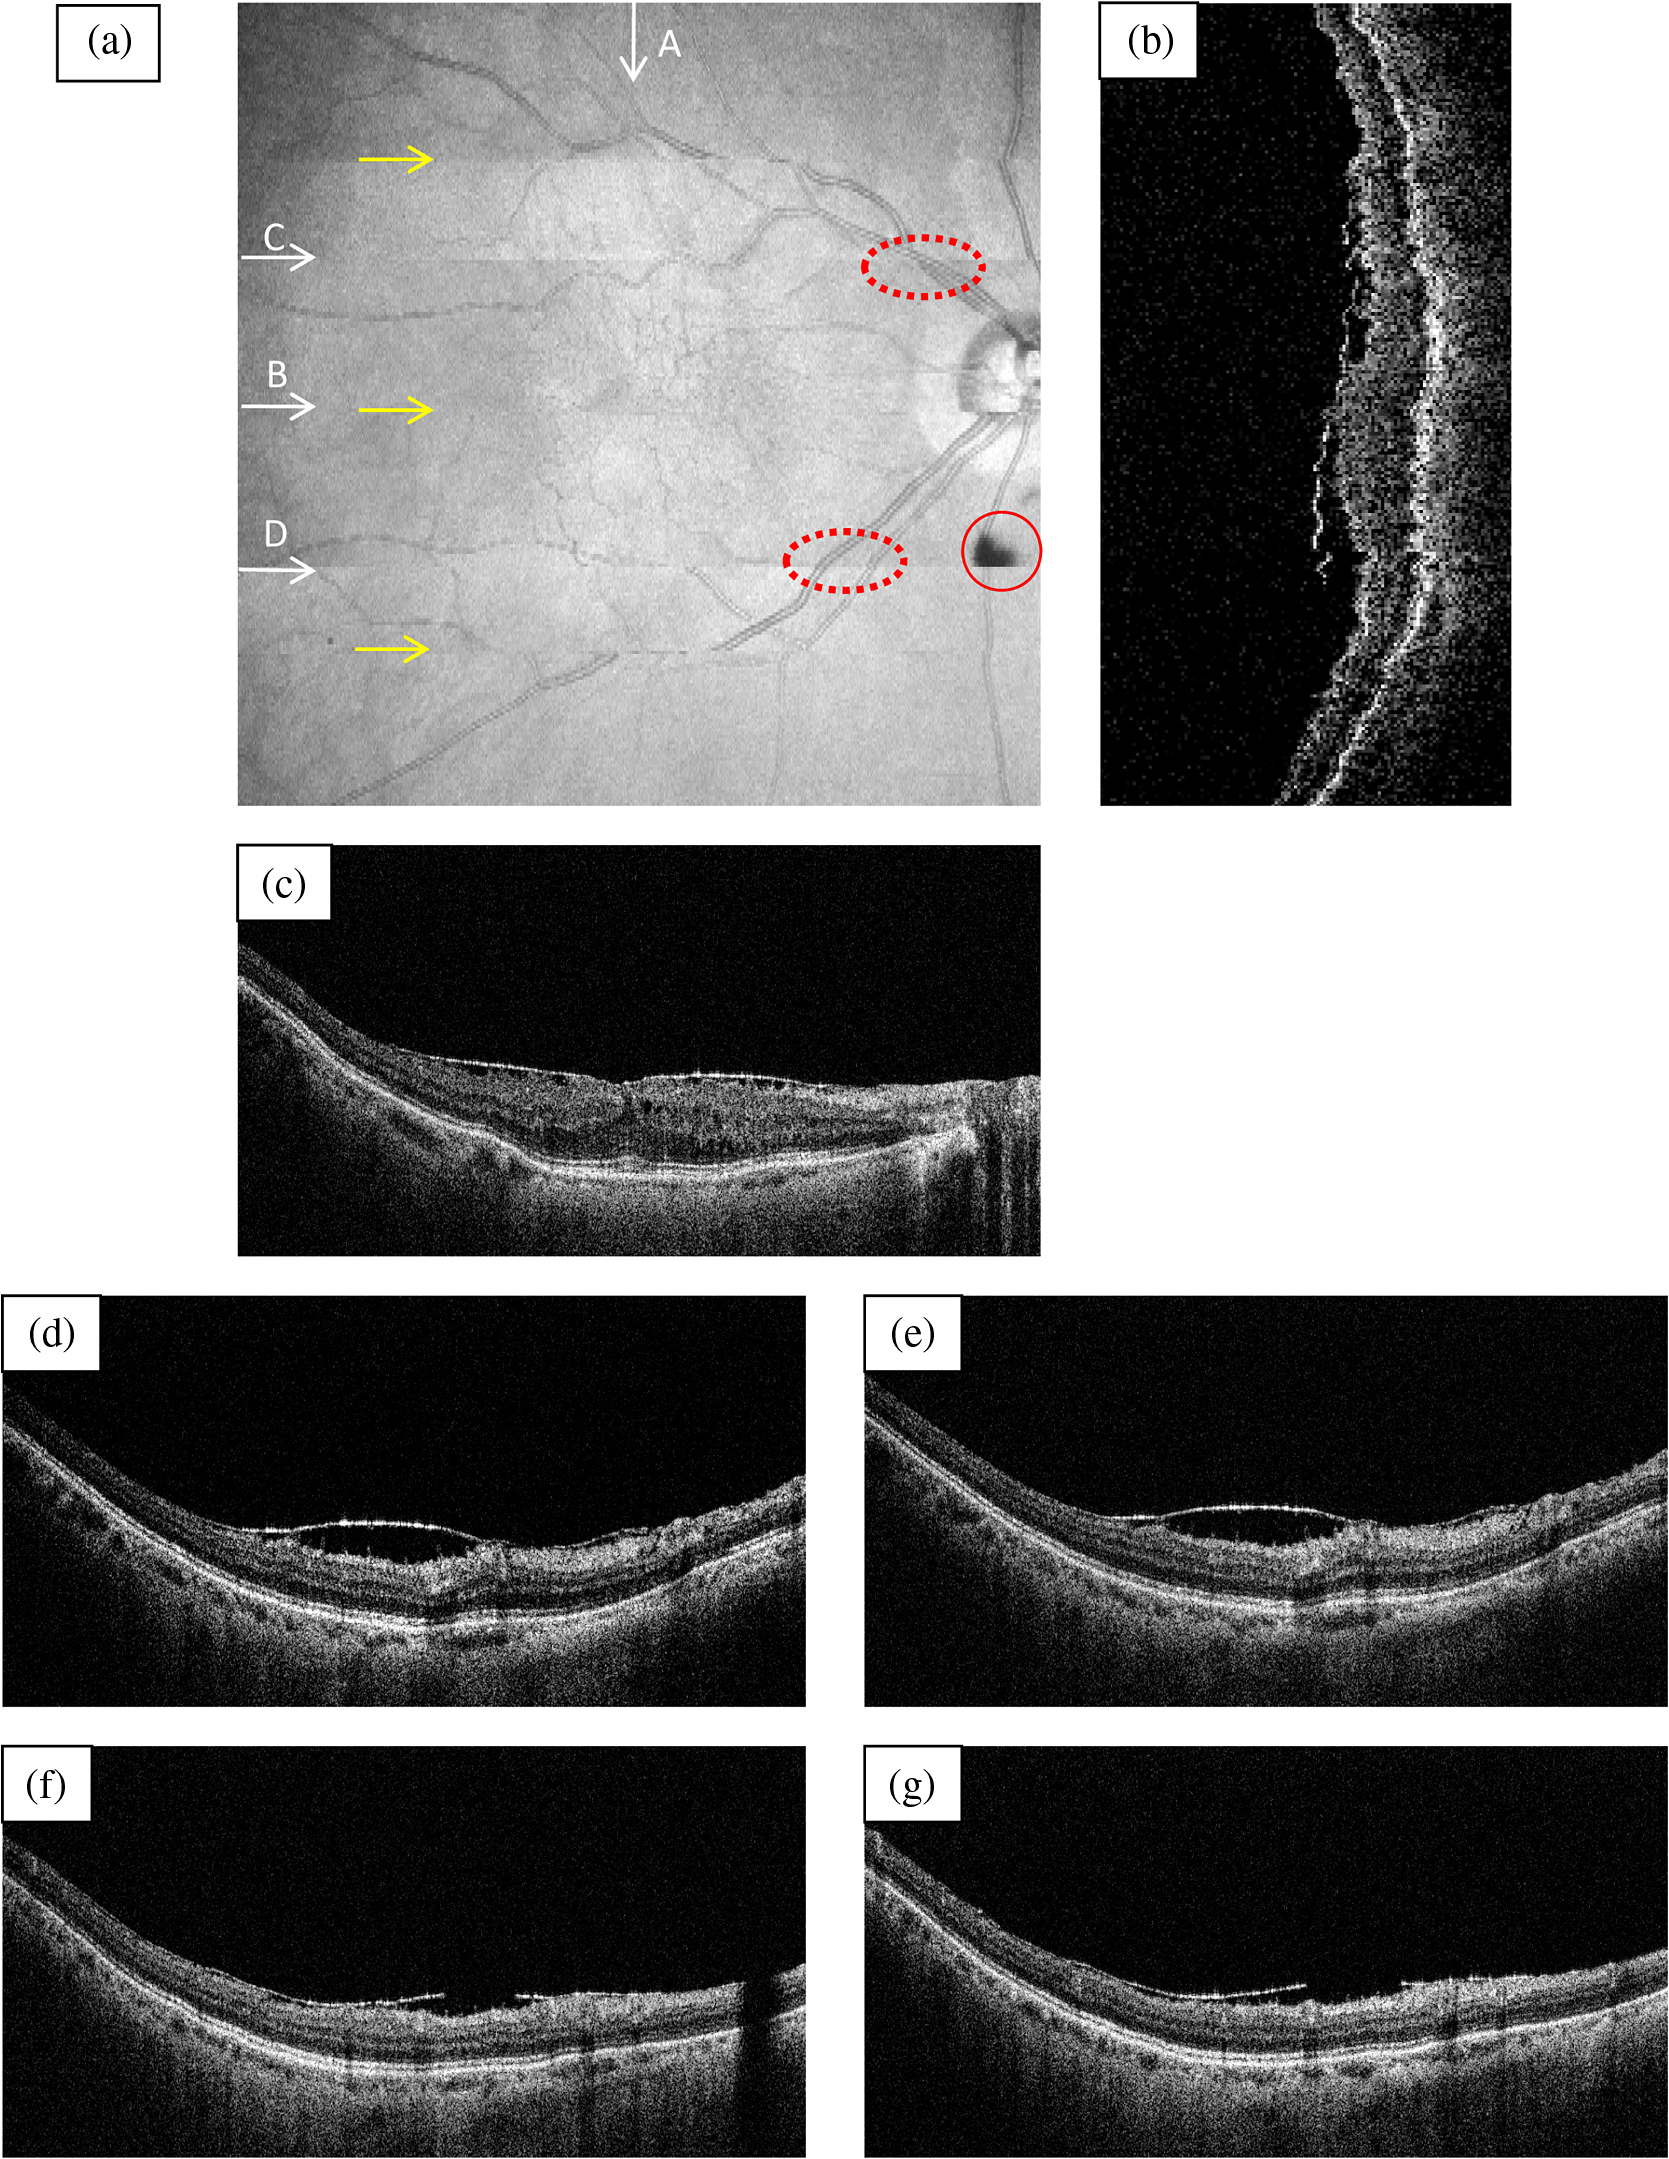 Figure 9(b) is a cross-sectional image of the arrow A. Each layer on the fundus is fluctuating due to the eye motion during the measurement. Figure 9(c) is a tomographic image at arrow B. It includes the macular and a part of the optical disk. The quality of the OCT image is sufficient for the diagnosis. Figure 9(d) and 9(e) are tomographic images at arrow C: the upper and middle beams, respectively. Figure 9(f) and 9(g) are tomographic images at arrow D: the middle and lower beams, respectively. The beams are blocked at red circle area by an obstacle. Although the blood vessels at the red doted circle area connect with each other, the blocked area has the discontinuity. The obstacle may be placed in front of the fundus. 5.Discussion and ConclusionThis paper discussed an OCT with multiple beams. It has potential not only for high-speed imaging of large areas but also for functional imaging such as Doppler measurement. In the three-beam system described in this paper, the imaging speed is almost three times faster than that of a single beam with same sensitivity, yet the device does not cost three times more thanks to shared usage of the line sensor and objective lens system. On the other hand, adjustment of the spectrometer becomes much more difficult due to detection of the three beams by one line sensor; additional signal processing is required to compensate for the differences in characteristics of the beams. Comparing light path between the three-beam OCT and a general single beam OCT, there are no differences from a cornea to a retina for all measurement areas. This means that the dispersion, deviation, and vignetting due to an eye are the same for both systems. Even if the manufacturing of the fiber array was not perfect such as the angle and the position among the beams, the difference was not big as shown in the model eye imaging. Therefore, the alignment in three-beam system such as the distance between the eye and the instrument is not critical comparing to the general single beam OCT in terms of the geometrical optics. But, we perfectly separate the alignment light and the OCT beam by the mechanical switching mirror. This causes time delay for the OCT measurement, which is the big disadvantage of the multi beam system. Currently the number of beams in this system is three due to a scanning pattern. The number could be increased with different scanning patterns and speeds. But the larger number of the beams the system has, the larger overlapping areas in order to compensate for the eye motion it requires. Moreover the adjustment becomes difficult in proportion to the beam number. Therefore, increasing the number from three is unrealistic in this system. Scanning the overlapping areas with different beams in a short time limits the amount of light to comply with the safety regulations. One method without overlapping area is full-field OCT which uses an area sensor instead of a line sensor.27 Although we expect there will be a number of challenges, this produces an en-face image of a certain depth at one time. The FF-OCT may be the ultimate goal of the multi beam OCT. Finally, we note that the high-speed imaging can reduce the effect of motion artifacts but cannot remove them. When an eye motion happens during measurement, each area has motion artifacts at the same time. A combination of tracking technique28 with the multi-beam OCT may overcome this problem and this can eliminate motion of the eye such as drift, but cannot remove the effect of fast motion such as micro saccade. Detecting such eye motion and performing the measurement again with a high-speed imaging technique is a practical approach. AcknowledgmentsThis study was partly supported by the project “Innovative Techno-Hub for Integrated Medical Bio-Imaging” of the Ministry of Education, Culture, Sports, Science and Technology, Japan. ReferencesD. Huanget al.,
“Optical coherence tomography,”
Science, 254
(5035), 1178
–1181
(1991). http://dx.doi.org/10.1126/science.1957169 SCIEAS 0036-8075 Google Scholar
B. Sanderet al.,
“Enhanced optical coherence tomography imaging by multiple scan averaging,”
Br. J. Ophthalmol., 89
(2), 207
–212
(2005). http://dx.doi.org/10.1136/bjo.2004.045989 BJOPAL 0007-1161 Google Scholar
N. A. Nassifet al.,
“In vivo high-resolution video-rate spectral domain optical coherence tomography of the human retina and optic nerve,”
Opt. Express, 12
(3), 367
–376
(2004). http://dx.doi.org/10.1364/OPEX.12.000367 OPEXFF 1094-4087 Google Scholar
M. Wojtkowski,
“High-speed optical coherence tomography: basics and applications,”
Appl. Optics, 49
(16), 30
–61
(2010). http://dx.doi.org/10.1364/AO.49.000D30 APOPAI 0003-6935 Google Scholar
A. F. Fercheret al.,
“Measurement of intraocular distances by backscattering spectral interferometry,”
Opt. Commun., 117
(1–2), 43
–48
(1995). http://dx.doi.org/10.1016/0030-4018(95)00119-S OPCOB8 0030-4018 Google Scholar
S. R. ChinnE. A. SwansonJ. G. Fujimoto,
“Optical coherence tomography using a frequency-tunable optical source,”
Opt. Lett., 22
(5), 340
–342
(1997). http://dx.doi.org/10.1364/OL.22.000340 OPLEDP 0146-9592 Google Scholar
F. Lexeret al.,
“Wavelength-tuning interferometry of intraocular distances,”
Appl. Opt., 36
(25), 6548
–6553
(1997). http://dx.doi.org/10.1364/AO.36.006548 APOPAI 0003-6935 Google Scholar
R. LeitgebC. K. HitzenbergerA. F. Fercher,
“Performance of Fourier domain vs. time domain optical coherence tomography,”
Opt. Express, 11
(8), 889
–894
(2003). http://dx.doi.org/10.1364/OE.11.000889 OPEXFF 1094-4087 Google Scholar
J. F. de Boeret al.,
“Improved signal-to-noise ratio in spectral-domain compared with time-domain optical coherence tomography,”
Opt. Lett., 28
(21), 2067
–2069
(2003). http://dx.doi.org/10.1364/OL.28.002067 OPLEDP 0146-9592 Google Scholar
M. A. Chomaet al.,
“Sensitivity advantage of swept source and Fourier domain optical coherence tomography,”
Opt. Express., 11
(18), 2183
–2189
(2003). http://dx.doi.org/10.1364/OE.11.002183 OPEXFF 1094-4087 Google Scholar
B. Potsaidet al.,
“Ultrahigh speed spectral/Fourier domain OCT ophthalmic imaging at 70,000 to 312,500 axial scans per second,”
Opt. Express., 16
(19), 15149
–15169
(2008). http://dx.doi.org/10.1364/OE.16.015149 OPEXFF 1094-4087 Google Scholar
D. F. KiernanW. F. MielerS. M. Hariprasad,
“Spectral-domain optical coherence tomography: a comparison of modern high-resolution retinal imaging systems,”
Am. J. Opthalmology, 149
(1), 18
–31
(2010). http://dx.doi.org/10.1016/j.ajo.2009.08.037 AJOPAA 0002-9394 Google Scholar
M. Yamanariet al.,
“Visualization of phase retardation of deep posterior eye by polarization-sensitive swept-source optical coherence tomography with 1-um probe,”
Opt. Express, 17
(15), 12385
–12396
(2009). http://dx.doi.org/10.1364/OE.17.012385 OPEXFF 1094-4087 Google Scholar
B. Potsaidet al.,
“Ultrahigh speed 1050 nm swept source/Fourier domain OCT retinal and anterior segment imaging at 100,000 to 400,000 axial scans per second,”
Opt. Express., 18
(19), 20029
–20048
(2010). http://dx.doi.org/10.1364/OE.18.020029 OPEXFF 1094-4087 Google Scholar
T. Kelinet al.,
“Megahertz OCT for ultrawide-field retinal imaging with a 1050 nm Fourier domain mode-locked laser,”
Opt. Express, 19
(4), 3044
–3062
(2011). http://dx.doi.org/10.1364/OE.19.003044 OPEXFF 1094-4087 Google Scholar
V. X. D. Yanget al.,
“Micromachined array tip for multifocus fiber-based optical coherence tomography,”
Opt. Lett., 29
(15), 1754
–1756
(2004). http://dx.doi.org/10.1364/OL.29.001754 OPLEDP 0146-9592 Google Scholar
N. V. Iftimiaet al.,
“Dual-beam Fourier domain optical Doppler tomography of zebrafish,”
Opt. Express, 16
(18), 13624
–13636
(2008). http://dx.doi.org/10.1364/OE.16.013624 OPEXFF 1094-4087 Google Scholar
R. M. Werkmeisteret al.,
“Bidirectional Doppler Fourier-domain optical coherence tomography for measurement of absolute flow velocities in human retinal vessels,”
Opt. Lett., 33
(24), 2967
–2969
(2008). http://dx.doi.org/10.1364/OL.33.002967 OPLEDP 0146-9592 Google Scholar
S. Zotteret al.,
“Visualization of microvasculature by dual-beam phase-resolved Doppler optical coherence tomography,”
Opt. Express, 19
(2), 1217
–1227
(2011). http://dx.doi.org/10.1364/OE.19.001217 OPEXFF 1094-4087 Google Scholar
S. Makitaet al.,
“Comprehensive in vivo micro-vascular imaging of the human eye by dual-beam-scan Doppler optical coherence angiography,”
Opt. Express, 19
(2), 1271
–1283
(2011). http://dx.doi.org/10.1364/OE.19.001271 OPEXFF 1094-4087 Google Scholar
Z. HuY. PanA. M. Rollins,
“Analytical model of spectrometer-based two-beam spectral interferometry,”
Appl. Opt., 46
(35), 8499
–8505
(2007). http://dx.doi.org/10.1364/AO.46.008499 APOPAI 0003-6935 Google Scholar
A. Szkulmowskaet al.,
“Coherent noise-free ophthalmic imaging by spectral optical coherence tomography,”
J. Phys. D:Appl. Phys., 38
(15), 2606
–2611
(2005). http://dx.doi.org/10.1088/0022-3727/38/15/011 APPYEK 1080-9198 Google Scholar
S. JiaoM. Ruggeri,
“Polarization effect on the depth resolution of optical coherence tomography,”
J. Biomed. Opt., 13
(6), 060503
(2008). http://dx.doi.org/10.1117/1.3037341 JBOPFO 1083-3668 Google Scholar
“Safety of laser products—part1: equipment classification and requirements,”
International Electrotechnical Commission (IEC), Geneva
(2007). Google Scholar
“Ophthalmic instruments—fundamental requirements and test methods—part 2: light hazard protection,”
International Standardization Organization (ISO), Geneva
(2007). Google Scholar
University hospital Medical Information Network, “UMIN Clinical Trials Registry (UMIN-CTR),”
http://www.umin.ac.jp/ctr/ Google Scholar
E. Beaurepaireet al.,
“Full-field optical coherence microscopy,”
Opt. Lett., 23
(4), 244
–246
(1998). http://dx.doi.org/10.1364/OL.23.000244 OPLEDP 0146-9592 Google Scholar
M. Pircheret al.,
“Simultaneous SLO/OCT imaging of the human retina with axial eye motion correction,”
Opt. Express, 15
(25), 16922
–16932
(2007). http://dx.doi.org/10.1364/OE.15.016922 OPEXFF 1094-4087 Google Scholar
|