

|
|
1.IntroductionDespite advances in surgical and nonsurgical treatment, the overall survival rate for patients diagnosed with head and neck tumors has not improved significantly with only 40% to 50% of these patients surviving five years.1 Challenges in the clinical management of these tumors include early and/or accurate diagnosis (based on information at morphologic, functional, and molecular levels), surgery (adequate delineation of surgical margins and organ preservation), and effective monitoring of the effect of neoadjuvant/adjuvant therapy.2,3 Adequate evaluation of tumor extent or assignment of tumor margins intra-operatively requires the rapid identification of histological changes typical of neoplasms of the epithelium.4 Moreover, in situ delineation of positive margins after tumor resection requires a fast assessment of molecular features at surgical margins. Steady-state fluorescence spectroscopy has demonstrated high sensitivity in oral carcinoma diagnosis.5 Also, time-resolved fluorescence spectroscopy (TRFS) has been shown to improve the specificity of fluorescence measurement by capitalizing on the additional dimension of fluorescence emission—the excited state lifetime.6 The TRFS measurements are minimally affected by factors that often confound fluorescence intensity analysis, including irregular tissue surfaces, non-uniform illumination, and endogenous absorbers such as blood in the operative field. Previous studies demonstrated the potential of TRFS to detect specific features associated with the chemical composition of normal or diseased tissue and to play an important role in intra-operative delineation of tumor surgical margins.7,8 However, autofluorescence techniques have limited penetration depth (), so diagnosis based on these techniques is based solely on alterations (metabolic and morphologic) of the intrinsic tissue fluorophore distribution on the tissue surface.8 No information regarding histopathological changes occurring deeper in the tumor and adjacent tissue is available with these techniques. High-resolution imaging techniques such as optical coherence tomography (OCT) have been shown to partially address this issue and show promise as an alternative optical method for clinical diagnosis of oral cancer.9,10 OCT is able to image microstructure at a subcellular level and can detail microanatomical changes in benign, premalignant, and malignant oral lesions. Nevertheless, OCT-based tissue interrogation is limited to a depth of 1.5 to 2 mm10 and is unlikely to detect invasion of the basement membrane or to interrogate tumor and adjacent invaded tissue deeper than 2 mm. This is an important limitation of OCT, because information on the morphology of the lesion below 2 mm is critical for accurate staging and predicting tumor behavior. It is well established that the depth of tumor invasion is one of the strongest predictors of the risk of a tumor spreading to the cervical lymph nodes.11,12 A tumor thickness of more than 4 mm has been associated with increased risk of cervical lymphatic metastasis. With tumor depth information, patients at lower risk for metastasis could be better identified and treated appropriately. Low-frequency ultrasound (US) imaging has been frequently used in clinical practice as a tool for the evaluation and differential diagnosis of head and neck disorders.13–15 Both external and intra-oral US probes (transducers with a frequency of 5 to 15 MHz) have been applied in the evaluation of tumor thickness; assessing lymph nodes for characteristics such as size, shape, homogeneity, and necrosis; and to identify lymph node metastases. While such low-frequency transducers provide a high penetration depth that enables evaluation of large volumes across head and neck tumors, they have limited spatial resolution. This renders traditional low-frequency ultrasound unable to detect early disruptions of sub-epithelial layers and invasion of the basement membrane, which are the hallmarks of an invasive carcinoma. The use of a high-frequency (above 40 MHz) single-element transducer described in this study has the potential to address these limitations. For example, an ultrasonic backscatter microscopy (UBM) with 45- to 75-MHz transducers can achieve a penetration depth of a few millimeters with a resolution of 25 to 50 μm.16 This study reports the evaluation of a bimodal tissue diagnosis technique that has the potential to noninvasively diagnose oral carcinoma. This technique integrates optical (fluorescence lifetime sensitive to molecular changes) and high-resolution ultrasonic (sensitive to morphological/structural changes) detection. The attributes derived from TRFS and UBM are expected to complement each other to better characterize and stage the tumor than either technique alone. UBM produces the contrast necessary for tumor detection by processing ultrasonic echoes generated by tissue layers or backscattered by tissue microstructures. In oral cancer, UBM images can be used for the detection and characterization of mucosal and sub-mucosal lesions and assess the extent of tumor invasion. The UBM can achieve microscopic resolution (less than 70 μm) of tissue components down to 5 mm below the surface.17,18 Thus, UBM has the potential to detect changes in tissue architecture associated with neoplastic transformation, such as epithelial hypertrophy; disorganization of dermis, epidermis, and connective tissue; and the subsequent destruction of basement membrane. However, ultrasound contrast of soft tissue, based on acoustic impedance, will not detect molecular changes associated with early or premalignant lesions. TRFS has the potential to complement UBM in providing increased sensitivity and specificity for the detection of functional and compositional changes occurring in oral lesions, including increased metabolic activity, and the presence of other neoplastic molecular markers. The TRFS-based technique utilizes tissue contrast created primarily by variation in tissue biochemical composition due to differential distribution of structural protein such as collagen, the reduced form of nicotinamide adenine dinucleotide (NADH), porphyrins, and other endogenous fluorophores within tissue.6,19 Moreover, TRFS and UBM components can be integrated into a compact, co-registered system through a customized transducer/optical fiber-based probe, as we have previously described.20 In this initial pilot study, we tested the performance of a bimodal diagnostic prototype system, combining TRFS and UBM techniques, in vivo using a well characterized oral carcinoma hamster model.17,21 The study was designed to demonstrate the bimodal system’s ability to provide co-registered complementary information allowing for the evaluation of benign, pre-malignant, early malignant, and later-stage oral lesions. This study focused on the qualitative characterization of oral lesions, the comparison of morphological and compositional properties, and illustrating the synergy of the combined TRFS-UBM system. 2.Materials and Methods2.1.Bimodal System ConfigurationThe schematic diagram of the combined TRFS-UBM system, including a hybrid tissue interrogation probe, is depicted in Fig. 1. This probe enabled the merging of optical and ultrasonic components via a customized 41-MHz focused ultrasonic transducer (Ultrasonic Transducer Resource Center, University of Southern California, 6-mm focal depth, 70% bandwidth, 3.75-mm aperture size) with a 1-mm channel in the center, where the optical fiber is inserted coaxially to serve as the light path. Synchronous TRFS-UBM system data acquisition was controlled and automated through a desktop workstation. The two main subsystems, TRFS and UBM, are described in the following sections. Fig. 1Schematic of the hybrid scanning-TRFS and UBM system. The combined system consists of four modules (from top to bottom): the laser source and computer control unit, the TRFS subsystem, the UBM subsystem, and the hybrid ultrasonic and spectroscopic probe.  2.1.1.TRFS subsystemTissue autofluorescence was induced by a pulsed nitrogen laser (MNL205-C, LTB Lasertechnik Berlin, 337 nm, 0.7 ns, 30 Hz), detected via a fast-gated multichannel plate photomultiplier tube (MCP-PMT) (R5916U-50, Hamamatsu, 180-ps rise time), and acquired and time-resolved by a digital oscilloscope (DPO 7254, Tektronix, 2.5-GHz bandwidth, ). The fluorescence light was induced and collected through a single optical fiber (Polymicro, silica, 600-μm core, NA 0.22) and spectrally resolved using two methods to enable either scanning-TRFS or point-TRFS. The first method, based on a new approach recently reported by our group,22,23 allowed for fast recording (few microseconds) of time-resolved fluorescence emission and spectral intensities at discrete spectral bands in linear scanning-TRFS mode. The core design of this system is the combination of a set of three dichroic and bandpass emission filters with optical fibers of different lengths, which enable the delivery of the fluorescence response pulses to the digitizer sequentially with time delays. For the current configuration, the fluorescence emission was acquired in three wavelength bands (center-frequency/bandwidth), each wavelength band serving as a channel sensitive to specific endogenous fluorophore within the hamster cheek pouch tissue. The corresponding emission channels and fluorophores are channel 1: , channel 2: , and channel 3: These bands correspond to collagen, NADH, and porphyrin emission, respectively.24,25 Linear tissue scanning was achieved via a precision XYZ stage (MX80L and MX80S, Parker-Daedal, 1-μm resolution). The acquisition time of each fluorescence signal was approximately 33 ms, which was limited by the excitation laser repetition rate of 30 Hz. The second method enabled point-TRFS measurements at discrete locations.20 This allows for the reconstruction of the sample’s entire fluorescence emission spectrum and decay characteristics. In addition, it provides a means for cross-validation of results obtained with the scanning-TRFS configuration. A monochromator (MicroHR, Horiba Jobin Yvon, 0 to 1500-nm scanning range, drive speed) was used to resolve the fluorescence emission within a broad spectral range (360 to 660-nm at 5-nm interval) within s. 2.1.2.UBM subsystemA high-voltage pulser (AVB2-TE-C, Avtech Electrosystems Ltd.) generating a wideband short pulse was used to drive the transducer. An expander (DEX-3, MATEC) was used to prevent the noise from the pulser from contaminating the signal receiver. A limiter (DL-1, MATEC) was used to protect the receiving circuit. Ultrasonic backscatter signals were detected by the transducer, amplified with a low noise amplifier (Miteq 1114, MITEQ) by 35 dB, and recorded by a digitizer (CompuScope 12400, Gage Applied Technologies) with a sampling rate of . Ultrasound images were formed by raster-scanning the single-element transducer using the XYZ stage over the area of interest. The UBM subsystem allowed images to be acquired with a spatial resolution of approximately 50 μm. 2.2.Animal ProtocolA hamster cheek pouch carcinogenesis model was used to test the performance of the TRFS-UBM system in vivo. Twenty male Syrian/golden hamsters (average ) were divided into two groups (14 treated and six for control). In this model, the carcinogen, 7,12-dimethylbenz(a)anthracene (DMBA, 0.5% in mineral oil), was painted on the right cheek pouch of the 14 treated animals three times per week. Repeated painting of the carcinogen resulted in the manifestation of various stages of carcinogenesis from early lesions to cancerous tumors. At the end of the fourteenth week of painting, tumors at different stages of pathology were imaged with the combined TRFS-UBM system. After the animals were anesthetized ( ketamine and xylazine), the cheek pouch was everted to expose the region of interest (ROI) with a customized brace and examined with the hybrid probe perpendicular to the tissue surface. A small Petri dish presenting an imaging window was filled with phosphate buffered saline (PBS) to serve as the acoustic coupling medium. The Petri dish was gently placed on top of the tissue and externally supported to limit application of pressure on tissue. The tissue was diagnosed by an otolaryngologist based on visual inspection to determine an ROI. The animal and tissue in the ROI were photographed before measurements. Tissue ink was used to mark the UBM scanning orientation for spatial correlation with histology. At the end of data collection, the animal was sacrificed, and tissue within the ROI was excised for pathological interpretation. The experiments were conducted in compliance with and under the approval of the University of California Institutional Animal Care and Use Committee. 2.3.Data AcquisitionUBM three-dimensional (3-D) scanning was performed over a region of . The dimensions of the UBM measurement steps were 0.02 mm in the lateral scanning direction () and 0.2 mm between scanning frames (). For the current setup, total imaging time was approximately 5 min. In order to compare the signal intensity from tissue at different depths, the sensitivity curve as a function of depth was acquired by measuring the pulse-echo signal from a metal reflector placed at different depths. These measurements were used to compensate for the intensity variation across the focal region of the ultrasound field. Upon completion of the UBM scan, scanning-TRFS (speed ) was performed along the center scanning line of the UBM imaging. Additional point-TRFS measurements of normal or diseased tissue were performed at the discretion of an otolaryngologist. Both scanning- and point-TRFS measurements enabled a set of fluorescence characteristics, including fluorescence lifetime and spectral intensities, to be retrieved. The interrogated sample volume for TRFS was defined by the optical fiber probe excitation-collection geometry. For scanning-TRFS, the pixel size was determined by laser repetition rate, pulse averaging number (i.e., six sequential pulses), and probe scanning speed. For scanning-TRFS measurements in the experiment, the distance between two consecutive measurements was 82 μm along the scanning direction. 2.4.Histological InterpretationTissues excised were collected and preserved in 10% buffered formalin. The specimens were embedded in paraffin and sectioned for hematoxylin and eosin (H&E) and trichrome staining for collagen content. Histologic sections were interpreted by a board certified anatomic pathologist, who was blind to the TRFS-UBM results. Hamster cheek pouch tissue showed lesions at different stages of carcinogensis with distinct histological features. 2.5.Data Processing and Co-Registration2.5.1.TRFS Data ProcessingThe intrinsic fluorescence impulse response was defined as for , where was the index for the th time sampling point with a sampling rate of 20 GHz. In this study, the function was expanded on to a set of discrete time Laguerre basis functions, for , as previously reported.26,27 The ith expansion coefficient was then estimated from the pulse fluorescence profile. The Laguerre functions formed a complete set of orthonormal bases and provided a unique expansion of decay profiles of arbitrary shape as shown in The average lifetime can be calculated based onThe fluorescence spectrum was reconstructed by numerical integration of the fluorescence decay profile for each wavelength acquired with the point-TRFS method. The ratio of spectral intensity values at distinct wavelength sub-bands was quantified to be an additional means for analyzing the scanning-TRFS measurements.2.5.2.UBM Data ProcessingUltrasound images were reconstructed by displaying the intensity of all scanning lines as a two-dimensional (2-D) image. DC offset was subtracted from the ultrasound radiofrequency (RF) signals, and a bandpass filter from 25 to 60 MHz was used for noise reduction. The Hilbert transform was applied to the filtered RF signals for envelope detection. The intensity data were then processed by a logarithmic compression to increase the displayed dynamic range. The processed data were displayed as a gray-scale B-mode ultrasound image. In the integrated probe, the co-registration of UBM and TRFS data was straightforward because of their static assembly and concentric geometry, allowing for a shared imaging axis. The cross-sectional UBM images with structural information were reconstructed and analyzed for each plane of interest and correlated with the spectroscopic signals. All UBM images were interpreted by a radiologist who specializes in ultrasound imaging. 3.ResultsThree tissue conditions were analyzed using the hybrid scanning-TRFS and UBM system for in vivo characterization of different stages of neoplastic transformation (control/normal: eight animals, early lesion: nine animals, invasive carcinoma: three animals) occurring in the hamster cheek pouch model. Representative features for each condition are depicted in Figs. 2 to 4, respectively. Fig. 2Healthy (normal) cheek pouch. Representative results from the bimodal measurement and correlation with histology. (a) Photo of the hamster cheek gently held by a plastic clamp with an open imaging window. (b) UBM image of the cross-section along line A as labeled in (a). (c) Additional UBM image along line B as labeled in (a) showing the layered structure of the tissue. (d) H&E staining and (e) trichrome staining from the same cross-section, including superficial layers labeled within the yellow box in (b) demonstrating the normal tissue from the hamster cheek pouch. (f) Raw fluorescence decay pulses from the three channels (390, 450, and 630 nm) acquired at location “1” labeled in (a) using the scanning-TRFS. The signals from the 390-nm and 450-nm channels originated mainly from collagen and NADH, respectively. (g) Variation of the fluorescence intensity ratio () acquired in these two channels as a function of line scanning-TRFS position along line A. (h) Variation of the fluorescence average lifetime in each channel as a function of line scanning-TRFS position. Both (g) and (h) are co-registered with the UBM image (b) showing the composition variation along different locations. Note that changes in signals with position were minimal, suggesting a similar tissue composition along the tissue line-scan. (i) and (j) depict point-TRFS data at location “1” labeled in (a), where (i) depicts the normalized fluorescence intensity spectrum (360 to 600 nm), and (j) depicts changes of average lifetime values as a function of emission wavelength. 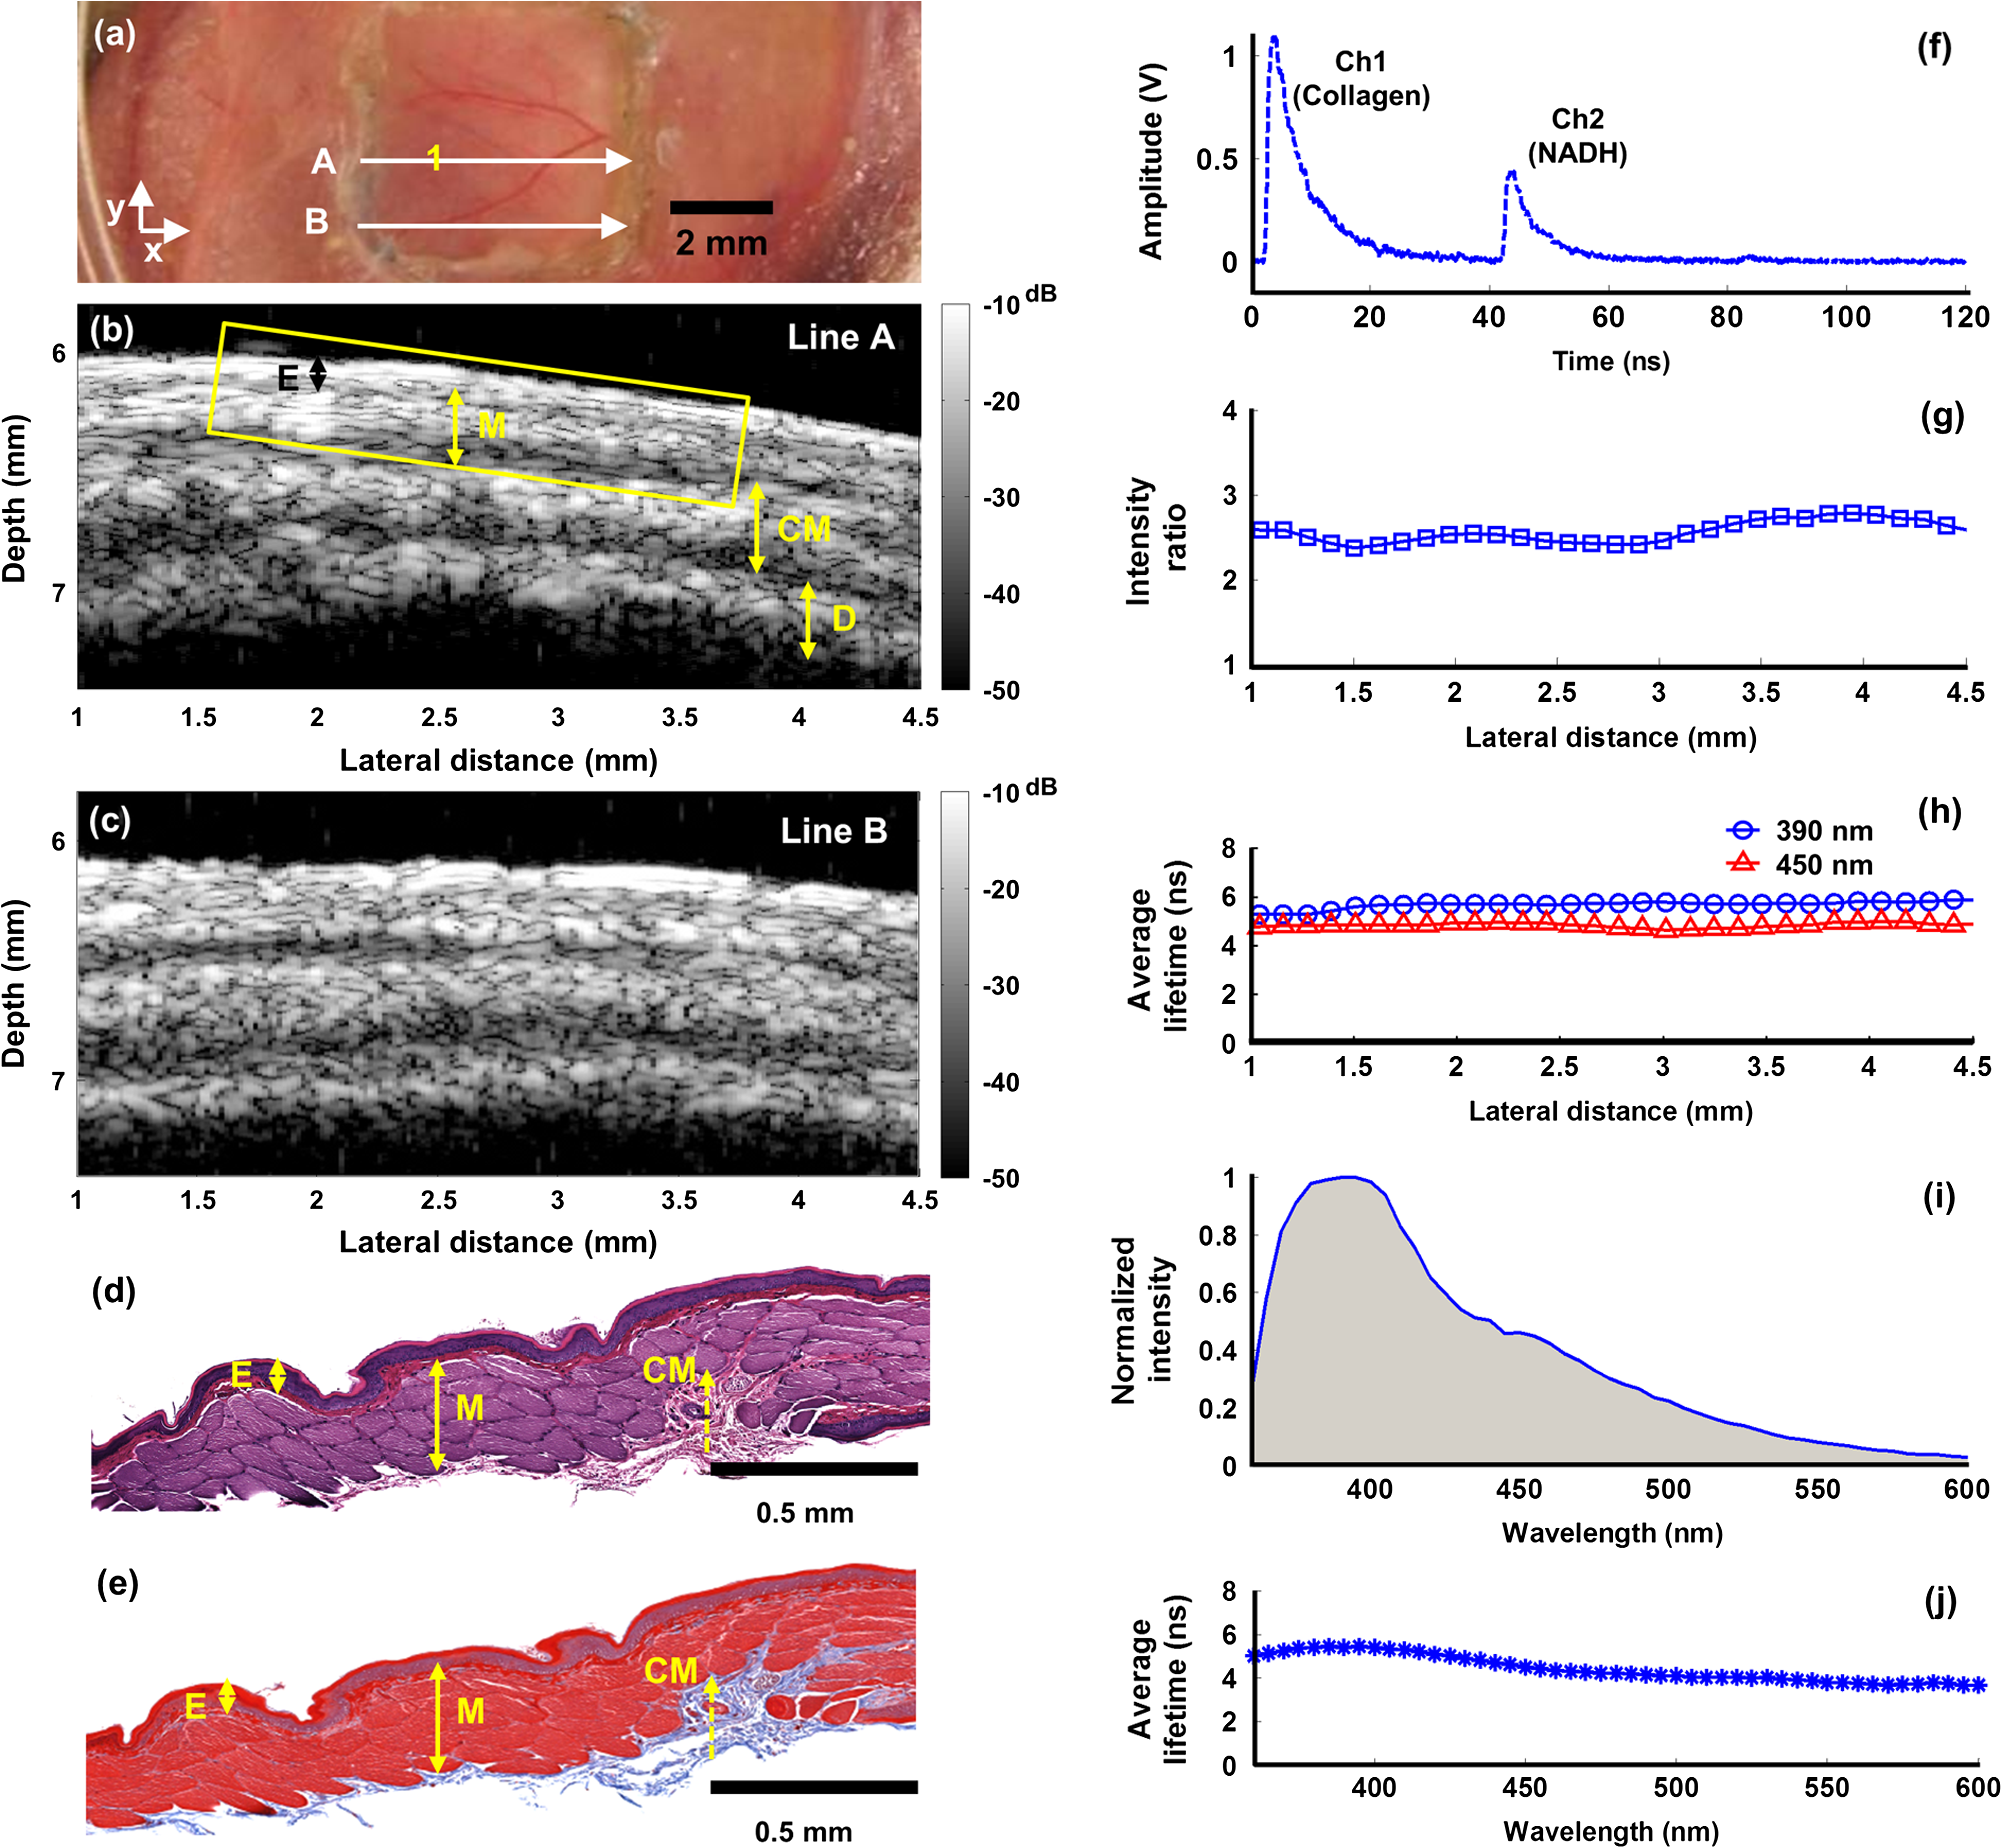 Fig. 3Early lesion and thickening of the epithelial tissue layers: Representative results from the bimodal measurement and correlation with histology. (a) Photo of the hamster cheek with early lesion held by a plastic clamp with an open imaging window. (b) H&E staining and (c) trichrome staining from the cross-section along line A labeled in (a) at superficial layers labeled within the yellow box in (d), which shows a UBM image of the same cross-section. These images demonstrate the early lesion from the hamster cheek pouch. (e) and (f) Additional UBM images along the lines B and C, respectively, as labeled in (a), showing the structural variation of the cancerous tissue. The UBM scale bar is labeled in (f). (g) Raw fluorescence decay pulses from the three channels (390, 450, and 630 nm) acquired at locations “1” (early lesion) and “2” (normal) as labeled in (a). The signals from the 390, 450, and 630-nm channels are expected to originate mainly from collagen, NADH, and porphyrin, respectively. (h) Variation of the fluorescence intensity ratio () acquired in these two channels as a function of line scanning-TRFS position (line A) indicative of the relative amount of the collagen versus NADH. (i) Variation of the fluorescence average lifetime in each channel as a function of line scanning-TRFS position. Both (h) and (i) are co-registered with the UBM image (d) showing the composition variation along different locations. (j) and (k) Point-TRFS data at locations “3” (normal) and “4” (early lesion) labeled in (a), where (j) depicts the corresponding normalized fluorescence spectra (360 to 600 nm), and (k) depicts changes of average lifetime values as a function of emission wavelength.  Fig. 4Invasive carcinoma: Representative results from the bimodal measurement and correlation with histology. (a) Photo of the hamster cheek with advanced lesion held by a plastic clamp with an open imaging window. (b) H&E staining and (c) trichrome staining from the cross-section along line A labeled in (a) at superficial layers labeled within the yellow box in (d), which shows a UBM image of the same cross-section. These images demonstrate the invasive carcinoma tissue from the hamster cheek pouch. (e) and (f) Additional UBM images along the lines B and C, respectively, as labeled in (a), showing the heterogeneous feature of the cancerous tissue. The UBM scale bar is labeled in (f). (g) Raw fluorescence decay pulses from the three channels (390, 450, and 630 nm) acquired at locations “1” (tumor) and “2” (normal) labeled in (a). The signals from the 390, 450, and 630-nm channels are expected to originate mainly from collagen, NADH, and porphyrin, respectively. (h) Variation of the fluorescence intensity ratios (, ) acquired in these channels as a function of line scanning-TRFS position (line A) indicative of the relative amount of the collagen versus NADH, and the porphyrin versus collagen, respectively. (i) Variation of the fluorescence average lifetime in each channel as a function of line scanning-TRFS position. Lifetime values at 630 nm were not calculated beyond 0.5 mm and 4 mm, since the signal level at this wavelength in these locations was too low to get reliable deconvolution results. Both (h) and (i) are co-registered with the UBM image (d) showing the composition variation along different locations. (j) and (k) Point-TRFS data at location “3” (tumor) labeled in (a), where (j) depicts the corresponding normalized fluorescence spectra (360 to 600 nm), and (k) depicts changes of average lifetime values as a function of emission wavelength.  3.1.Characterization of Normal Epithelial TissueFigure 2 depicts the combined UBM and scanning-TRFS co-registered data of a normal hamster cheek pouch. The photo in Fig. 2(a) shows the hamster cheek pouch exposed in an imaging window (where UBM 3-D data were acquired). Two representative UBM cross-sections are depicted in Fig. 2(b) and 2(c). The marked line A shows the line for scanning-TRFS measurement. This tissue was initially determined to be normal based on visual inspection by the otolaryngologist and was further validated through histological interpretation by the pathologist. The observations of the histological sections [Fig. 2(d) and 2(e)] of the normal hamster cheek pouch (showing partial layers due to the partial biopsy) were consistent with those described in Ref. 4. Tissue in the H&E section corresponds to the region within the yellow box in Fig. 2(b) and displays tissue layers that correspond to keratinized stratified squamous epithelium with a very thin basement membrane () separating the epithelium from loose connective tissue and skeletal buccal muscle fibers (), as well as a portion of the reticular dense connective tissue layer [Fig. 2(d)]. The trichrome staining section showed that the distribution of collagen fibers (stained as blue) was mainly located in the dense and reticular connective tissue and scattered in the muscular layer [Fig. 2(e)]. The UBM image [along line A in Fig. 2(a)], as read by a radiologist, showed four distinct tissue layers from top to bottom that correspond to keratinized epithelium with a basement membrane (E, thickness), loose fibrous connective tissue with a skeletal muscle layer (M, ), dense connective tissue and skeletal muscle (CM, ), and a dermis and epidermis layer (D, ) [see Fig. 2(b)]. Ultrasound contrast, based on echogenicity resulting from composition, density, and viscoelastic property of tissue, resolved distinct layers with a normal appearing organized architecture. The hyperechoic regions with stronger backscatter signals were observed for the epithelium, muscle layers, dense connective tissue, and dermis, where these tissue compositions showed greater echogenicity. The loose connective tissue (mainly consisting of fat), blood vessels and nerves appeared as hypoechoic areas with weaker signals between the layers in the UBM images. Since the thickness of each layer within the ROI could be evaluated from the UBM image, any hypertrophy or disruption of these tissue layers, occurring during malignant transformation, can be observed. The additional UBM image cross-section along line B in Fig. 2(a) shows similar layered features of the normal tissue [Fig. 2(c)] as those observed in Fig. 2(b). The fluorescence data acquired by the line scanning-TRFS subsystem [line A in Fig. 2(a)] from the normal cheek pouch tissue show emission in the wavelength bands of 390 and 450 nm [see Fig. 2(f)]. Emission in these two spectral bands upon ultraviolet light excitation is typically associated with the endogenous fluorescence from collagen fibers distributed in the cheek pouch and NADH in cells, respectively.24,28 The fluorescence intensity from the 390-nm wavelength band was found higher than that from the 450-nm band, as shown in Fig. 2(f), and the intensity ratio showed a value of for these two bands, which was nearly constant across the scanning line, as shown in Fig. 2(g). These results suggest the overall fluorescence emission in normal epithelial tissue has a greater contribution from collagen than from NADH. Although collagen and NADH have overlapped emission spectra, they have distinct fluorescence lifetimes: collagen has a longer lifetime28 (5 to 6 ns) than that of NADH24 (0.5 to 2 ns for free and bound form). A change in the average lifetime within the 450-nm spectral band would suggest a change in the ratio of collagen to NADH, which can be further validated by the change in the intensity ratio in the spectrum. The average lifetime [Fig. 2(h)] in the 390-nm wavelength band () was longer-lasting than the lifetime in the 450-nm band (). The small variations of the average lifetime and the intensity ratio as a function of the scanning position indicated that tissue composition was similar along the scanning line. This is consistent with the results of the co-registered UBM image [Fig. 2(b)] and histology [Fig. 2(d) and 2(e)]. In addition to scanning fluorescence data, point-TRFS measurement was acquired from the location “1.” This point measurement provided the full spectrum of intensity and average lifetime as a function of wavelength and allowed for cross-validation of fluorescence data obtained from discrete wavelength bands using the scanning-TRFS approach. The intensity spectrum [Fig. 2(i)] showed one major emission peak at 390 nm and a shoulder at around 450 nm. This is consistent with the intensity ratio of the scanning-TRFS data. The average lifetime trend over wavelength [Fig. 2(j)] showed at 390 nm and at 450 nm, which is also in agreement with the scanning-TRFS results at location “1.” 3.2.Characterization of an Early LesionA second case showed combined scanning-TRFS and UBM measurement of an early lesion of the hamster cheek pouch (Fig. 3). Prior to TRFS-UBM scanning, the tissue was visually examined by the otolaryngologist and characterized as early lesion (EL) surrounded by “normal” tissue (N) [Fig. 3(a)]. The presence of the early lesion was independently validated by histopathological results corresponding to the yellow box sketched in Fig. 3(d). Histological features related to early lesion were observed in H&E staining [Fig. 3(b)]: exophytic early lesion and submucosal inflammation as indicated by the presence of neutrophils. This low-grade lesion (as depicted in this particular cross-section) was characterized by an outgrowth of the epithelium with only modest damage to the underlying tissue architecture. The trichrome staining in Fig. 3(c) showed collagen fibers (blue) at a depth of more than 1 mm, which is deeper than the TRFS laser excitation penetration depth. Due to the difficulties in histological evaluation of tissue resulting from the partial biopsy, the normal region was primarily identified based on the otolaryngologist’s experience. In addition, we inferred the normal areas based on the intact layers visible in the UBM image that were similar to the histology of the healthy epithelial tissue [Fig. 2(d) and 2(e)]. While selecting the “normal” region this way may provide a good estimate for healthy epithelial regions, we recognize that such areas may be accompanied by very early neoplastic changes. The histopathological features depicted in Fig. 3(b) and 3(c) correspond to the UBM image cross-section along the marked scanning line A [Fig. 3(d)]. UBM allowed for the two delineated distinct regions [Fig. 3(d)]. The irregular lesion with a moderate level of backscatter magnitude ( above the epithelium, no intrusion was observed) and relatively intact epithelial layers underneath the lesion (EL). The surrounding normal region (N) with a layered structure and a notably thickened epithelial layer (). UBM images for two additional scanning lines B and C are depicted in Fig. 3(e) and 3(f), respectively. The UBM image along line B located 0.9 mm away from the cross-section of Fig. 3(d) shows a hypoechoic region and a damaged epithelial layer, which suggests a possible area of invasive carcinoma. A transitional region characterized by thickened epithelial layer between the tumor and surrounding normal area was observed [yellow line contour in Fig. 3(e)]. The UBM image along line C located 1.8 mm away from the cross-section in Fig. 3(d) suggests the presence of normal epithelium [Fig. 3(f)]. The structure variation of the lesion can be reconstructed by the 3-D UBM data. Scanning-TRFS data along line A in Fig. 3(a) demonstrate changes in the biochemical composition of the cheek pouch with location. Figure 3(g) depicts fluorescence decay traces from two distinct locations on line A: locations “1” (lesion region) and “2” (normal region). These two snapshots show that, for the normal region, the intensity in channel 1 (associated with collagen fluorescence) has a greater contribution to the overall emission when compared to channel 2 (associated with NADH fluorescence). Opposite trends were observed for the tumor region. Figure 3(h) depicted the changes in the intensity ratio of 390-nm versus 450-nm emission along the scanning line A. Moreover, these trends were correlated with the profile of the early lesion detected with UBM [Fig. 3(d)]. The changes in the intensity ratio for the two wavelength channels () along the line scan mirror the underlying structural changes observed with UBM [Fig. 3(h)]; a lower ratio value of was observed in the lesion region (from to 3.5 mm), with a gradual increase of the ratio value to in the normal area. This is similar to what was obtained for the control tissue [Fig. 2(g)]. The average lifetime at 390 and 450 nm showed a similar trend as the intensity ratio as a function of scanning position [Fig. 3(i)]. At 450 nm, the lifetime increased from 3.5 to 4.2 ns as the imaging probe moved from the early lesion to the normal tissue regions. At 390 nm, it was found that the lifetime decreased by 48% for the early lesion compared to the surrounding normal tissue. Compared to the 450-nm wavelength band, lifetime values showed the greatest contrast between the early lesion and normal tissue at the 390-nm band. Note that the average lifetime values obtained from the normal region are comparable to those obtained from the control normal tissue [Fig. 2(h)]. The spatial variation in biochemical composition of the lesion was demonstrated by comparing the fluorescence signals at two additional locations: “3” (associated with the normal region) and “4” (associated with the lesion region) using point-TRFS measurements [Fig. 3(j) and 3(k)]. These points were located along UBM scanning line C [Fig. 3(e)] and line B [Fig. 3(f)], respectively. The tissue fluorescence characteristics from the normal region showed a broad emission with a peak at [Fig. 3(j)]. The average lifetime values along the emission wavelength [Fig. 3(k)] followed similar trends as those obtained for normal endothelium in control tissue [Fig. 2(j)]. In contrast, the lesion presented a main emission peak at (average lifetime: ) and an additional fluorescence emission peak at (average lifetime: ). The longer-lasting emission at 630 nm suggests porphyrin fluorescence.25 This latter feature is of particular interest, because it is also located in a region of disrupted endothelial layer, as shown in the co-registered UBM image shown in Fig. 3(d). 3.3.Characterization of Invasive CarcinomaFigure 4 depicts combined scanning-TRFS and UBM features of an advanced (invasive) tumor. In this case, an ulcerated malignant-appearing lesion occupies a major part of the imaging window shown in Fig. 4(a). Features related to invasive carcinoma were validated by histopathological analysis, which correspond to the yellow box labeled in Fig. 4(d). Both the H&E and trichrome staining sections showed that the lesion was composed of irregular nests and sheets of squamous cells with a desmoplastic tissue response [Fig. 4(b) and 4(c)]. The cells had an increased nucleus size based on the cytoplasmic ratio and nuclear pleomorphism. Keratin pearls and foci of necrosis were present. The UBM image along the scanning line A showed destruction of the normal oral epithelial tissue architecture with disorganization of the layers otherwise seen in the normal cheek [Fig. 4(d)]. Mixed echogenicity appeared within the lesion, indicating high tissue structure variation. A hypoechoic region was visualized (see yellow box) as an area with low acoustic backscatter intensity, which is commonly found in cancerous tissue29 and perhaps suggestive of necrosis or disorganized tightly packed neoplastic cells. The destruction of the basement membrane underneath the tumor suggested an invasive carcinoma (IC). Two additional UBM images along the scanning lines B and C in Fig. 4(a) demonstrate the highly irregular properties of the cancerous tissue, where Fig. 4(e) shows another cross-section of the tumor, and Fig. 4(f) shows a relatively normal region at the margin of the tumor. The UBM image along line B located 0.8 mm away from the cross-section of Fig. 4(d) shows a hypoechoic region and highly damaged epithelial layer, suggesting an invasive carcinoma [Fig. 4(e)]. The UBM image along line C located 1.6 mm away from the cross-section of Fig. 4(d) suggests a normal layered epithelium [Fig. 4(f)]. The fluorescence decay traces from two distinct locations (“1.” showing the lesion region, and “2.” showing the normal region) on the scanning line A are shown in Fig. 4(g). These two snapshots also show that, for the normal region, the intensity in channel 1 (associated with collagen fluorescence) has a greater contribution to the overall emission when compared to channel 2 (associated with NADH fluorescence). Opposite trends were observed for the tumor region in these two channels. In addition, strong emission was observed in channel 3 (associated with porphyrin fluorescence).25,30 Figure 4(h), which depicts the changes in the intensity ratio of 630 versus 390-nm emission along the scanning line A, shows the ratio gradually increases to a maximum value of 1.7 and then decreases to nearly zero. The pattern of lifetime change correlates with the profile of the carcinoma geometry as detected with UBM. Within the region from 0.5 to 4 mm, the average lifetime [Fig. 4(i)] at 630 nm increased dramatically to . This suggests that porphyrin is the dominant lifetime component (8 to 12 ns).30 A point-TRFS measurement from location “3” of the invasive carcinoma was used to further validate the findings obtained from the scanning-TRFS data. Two predominant emission peaks at 450 and 630 nm were shown in the emission spectrum [Fig. 4(j)], and an increased average lifetime of was shown at 630 nm compared to at 450 nm [Fig. 4(k)], underscoring the presence of porphyrin with a long-lived fluorescence lifetime. 4.DiscussionThis study is the first to report on the complementary features provided by a bimodal system integrating optical and ultrasound channels for the characterization of oral carcinoma in vivo. The study demonstrates that the molecular changes at the tissue surface detected using a novel implementation of time-resolved fluorescence spectroscopy (scanning-TRFS) can be directly co-registered with the underlying structural/morphological changes visualized using a high-frequency ultrasound technique (UBM). 4.1.Complementary Features of Combined TRFS-UBM for Tumor CharacterizationThe bimodal scanning-TRFS and UBM measurements were obtained through an integrated system with a compact scanning probe that allows for the straightforward acquisition of co-registered data from scanned tissue in vivo. The current configuration allows for the direct co-registration of a two-dimensional UBM cross-sectional image acquired from a relatively large tissue area with a TRFS line-scan across this area. Data acquired along the cheek tissue surface provided a qualitative assessment of the distribution of distinct structural and compositional features of the tissue under investigation. The co-registered data demonstrate the ability of the bimodal system to provide complementary information for the characterization and differentiation of normal tissue, early precancerous lesions, and malignant tissue. The fluorescence features as measured by the ratios between collagen (390 nm), NADH (450 nm), and porphyrin (630 nm) are consistent with histologic tissue composition and reflect a strong correlation with the stages of tumor development. The decrease of the average lifetime at 390 nm and the decrease of the intensity ratio of suggest that, with advanced carcinogenesis, collagen contributes less than NADH to the entire fluorescence emission (see Figs. 2 to 4). These trends agree with previous studies of the oral carcinoma autofluorescence.5,7,8,31,32 These results were found to be consistent with anatomical and cellular changes in the epithelium tissue associated with disease progression. Increased epithelium thickness or disruption of the connective tissue results in less collagen, and increased cell proliferation leads to an increase in total NADH content. The fluorescence lifetime of protein-bound NADH () and its contribution relative to free-NADH () decreases significantly in both low- and high-grade epithelial precancers compared to normal epithelial tissue.33 While such NADH fractions have not been specifically studied in this work, analysis of the fluorescence decay dynamic (lifetimes) in the 460-nm wavelength band is expected to allow for further evaluation of the metabolic activity at distinct stages of the disease. Moreover, the region of invasive carcinoma was characterized by a distinctive florescence peak at the 630-nm wavelenght band with a long lasting emission of over 7 ns (Fig. 3 versus Fig. 4). These features were found only in advanced tumors and correspond to porphyrin fluorescence, as widely reported in Refs. 25 and 30. UBM was shown to compensate for the limited penetration depth of the TRFS measurements acquired from superficial buccal tissue () and to provide information about the morphologic changes from healthy tissue to early and invasive lesions. In the current animal model, the normal hamster cheek pouch tissue was as thin as 0.5 to 1 mm, while for some of the advanced tumor, the thickness of tissue was slighly more than 3 mm. The UBM component was shown to resolve tissue morphological features within this depth. However, the depth of tissue interrogation using transducers at 40 MHz can reach a higher penetration depth (), as previously reported.34 Progression of oral carcinoma is typically characterized by the transformation of clearly demarcated and organized tissue layers found in healthy tissue into tissue with a disorganized architecture, accompanied by a total loss of the layered structures characteristic of the cheek pouch tissue. These features were successfully detected by the high-resolution ultrasound images (Figs. 2 to 4). In this study, tumor characterization and feature extraction in the UBM analysis were achieved mainly by directly analyzing the backscatter contrast in the gray scale B-mode images. However, further analysis of the radio frequency ultrasonic data may allow for improved tissue composition characterization, which will be considered in our subsequent studies. Moreover, the UBM-resolved structural features helped in the understanding of the relationship between changes in fluorescent signal as a function of endothelial thickness and/or its composition over the progression of a tumor. In future studies, the UBM imaging speed can be improved by increasing the repetition rate of the transducer driving pulses (i.e., the repetition rate of backscatter signals), which is limited in this study by the maximum input power of the current transducer. This will increase scanning speed while maintaining an adequate pixel size. While the main limitation of this study has been the process of correlating the plethora of biochemical and structural features obtained using TRFS and UBM with tissue histopathology, current results confirm that this synergetic approach can lead to an improved differentiation of normal mucosa from early lesions and cancerous tissues, as evident from the cross-validation of the data obtained via each technique. This is likely to result in improved specificity for tissue diagnosis. 4.2.Scanning-TRFS for Dynamically Resolving the Biochemical Composition of TissueThe scanning-TRFS measurements allowed for continous measurements at different locations of the tissue, thus providing a detailed understanding of the variation in the tissue composition from the tumor region to surrounding normal tissue. It also provided simultaneous evaluation of fluorescence emission characteristics in four spectral bands. These bands can be selected based on prior understanding of tissue biomolecular features in relationship with the stage of the disease (e.g., collagen, NADH, and porphyrin emission). In addition to studying the time-resolved fluorescence features in multiple spectral bands, we also evaluated the fluorescence intensity values and intensity ratios of normal and tumor tissue in this study. The latter analysis showed that fluorescence features retrieved from the spectral domain are in agreement with those reported in earlier studies of oral carcinoma.5,31 However, since spectral intensities can be affected by factors such as changes in blood amount/absorption due to tissue perfusion or oxygen saturation, spectral intensities alone are not robust enough for in vivo tissue characterization. Moreover, this technique is not limited to one line-scanning as it was applied in this study. It can be readily extended to 2-D TRFS scanning that allows for reconstruction of a fluorescence lifetime image (FLIM) and subsequent mapping of the molecular makeup of the tissue surface over the three-dimensional tissue structure obtained using UBM. We recently demonstrated this approach in ex vivo tissue specimens.18 Overall, the multispectral scanning-TRFS system used in this study enables three modes of operation. It can be used for point-measurement, where the probe is held over tissue to quickly “survey” various locations within the ROI; one-dimensional (line) scanning across a tissue surface, as demonstrated in this study; or 2-D scanning of an entire surface (FLIM imaging), as noted above. Scanning-TRFS data can benefit from the synergy with UBM measurements. For example, ultrasound data can be used to continuously measure changes in fiberoptic probe-to-tissue distance. Given the irregular geometry of tumor surfaces, this information can be used to correct variations in data due to changes in working distance, enabling accurate co-registration of optical and ultrasound features of the tissue surface. In addition, the UBM component can play a role in guiding TRFS measurements. UBM images can be used first to identify specific areas of interest in scanned tissue. TRFS measurements can then be conducted in predefined smaller areas where evaluation of molecular changes is most relevant (e.g., shoulders or margins of the tumor). 5.ConclusionPathological transformations associated with oral carcinoma and other head and neck cancers involve both molecular and morphological/structural changes of the affected tissues. Our results successfully demonstrate that an integrated scanning-TRFS and UBM system is capable of acquiring synergistic data for in vivo simultaneous characterization of such changes. The TRFS technique as applied here allowed for fast recording of fluorescence decay in multiple spectral bands simultaneously that in turn enabled acquisition of TRFS data in scanning-mode. This feature is particularly important because it can be easily co-registered with UBM imaging, which employs a high-frequency single-element ultrasound transducer to scan and reconstruct an image of tissue microstructure. Further optimization of this bimodal system (e.g., increased speed of TRFS data acquisition through the use of high-repetition rate lasers, the development of feedback loops between UBM-TRFS subsystems, and advanced modes for data acquisition control) is anticipated not only to produce near real-time complementary data for the accurate diagnosis of oral carcinoma, but also to incorporate operational modes where UBM can be used to guide TRFS measurements or perform FLIM imaging. The fluorescence lifetime information is anticipated to play an important role in the evaluation of the earlier stages of the diseases and the tumor extent, while the high-resolution ultrasonic data are expected to provide information on the thickening of the endothelium, the level of tissue disorganization, and the destruction of the basement membrane, which is an indicator of tumor invasion. The latter feature is particularly important because it cannot be detected through other clinically used techniques such as OCT (penetration depth ) or clinical ultrasound (resolution typically ). Overall, the bimodal approach described in this study has the potential to assist the intra-operative assignment of surgical margins on the tissue surface (based on both scanning-TRFS and high-resolution UBM) and deep in tissue (based primarily on UBM). AcknowledgmentsThis pilot work was supported by NIH Grants R21-RR025818 and R01-HL67377. The authors acknowledge Dr. K. Kirk Shung, Dr. Jonathan Cannata, and Hao-Chung Yang for providing the ultrasound transducer used in this study. We also thank Dr. Brain Poirier for histological instruction, Dr. Daniel Elson and Dr. Yinghua Sun for insightful discussions about the system design and algorithmic techniques, and Dr. Jennifer Phipps for help with data processing software. ReferencesC. R. LeemansB. J. BraakhuisR. H. Brakenhoff,
“The molecular biology of head and neck cancer,”
Nat. Rev. Cancer, 11
(1), 9
–22
(2011). http://dx.doi.org/10.1038/nrc2982 NRCAC4 1474-175X Google Scholar
L. Calabreseet al.,
“Future challenges in head and neck cancer: from the bench to the bedside?,”
Crit. Rev. Oncol. Hematol.,
(2011). Google Scholar
T. Upileet al.,
“The uncertainty of the surgical margin in the treatment of head and neck cancer,”
Oral Oncol., 43
(4), 321
–326
(2007). http://dx.doi.org/10.1016/j.oraloncology.2006.08.002 EJCCER 1368-8375 Google Scholar
P. Wilder-Smithet al.,
“In vivo optical coherence tomography for the diagnosis of oral malignancy,”
Lasers Surg. Med., 35
(4), 269
–275
(2004). http://dx.doi.org/10.1002/(ISSN)1096-9101 LSMEDI 0196-8092 Google Scholar
D. L. Heintzelmanet al.,
“Optimal excitation wavelengths for in vivo detection of oral neoplasia using fluorescence spectroscopy,”
Photochem. Photobiol., 72
(1), 103
–113
(2000). http://dx.doi.org/10.1562/0031-8655(2000)072<0103:OEWFIV>2.0.CO;2 PHCBAP 0031-8655 Google Scholar
L. Marcu,
“Fluorescence lifetime techniques in medical applications,”
Annals of Biomedical Engineering, 40
(2), 304
–331
(2012). http://dx.doi.org/10.1007/s10439-011-0495-y ABMECF 0090-6964 Google Scholar
D. G. Farwellet al.,
“Time-resolved fluorescence spectroscopy as a diagnostic technique of oral carcinoma: validation in the hamster buccal pouch model,”
Arch. Otolaryngol. Head Neck Surg., 136
(2), 126
–133
(2010). http://dx.doi.org/10.1001/archoto.2009.216 AONSEJ 0886-4470 Google Scholar
J. D. Meieret al.,
“Time-resolved laser-induced fluorescence spectroscopy as a diagnostic instrument in head and neck carcinoma,”
Otolaryngol. Head Neck Surg., 142
(6), 838
–844
(2010). http://dx.doi.org/10.1016/j.otohns.2010.02.005 OHNSDL 0194-5998 Google Scholar
M. DeCoroP. Wilder-Smith,
“Potential of optical coherence tomography for early diagnosis of oral malignancies,”
Expert Rev. Anticancer Ther., 10
(3), 321
–329
(2010). http://dx.doi.org/10.1586/era.09.191 ERATBJ 1473-7140 Google Scholar
E. S. Mathenyet al.,
“Optical coherence tomography of malignancy in hamster cheek pouches,”
J. Biomed. Opt., 9
(5), 978
–981
(2004). http://dx.doi.org/10.1117/1.1783897 JBOPFO 1083-3668 Google Scholar
R. P. Mortonet al.,
“Tumor thickness in early tongue cancer,”
Arch. Otolaryngol. Head Neck Surg., 120
(7), 717
–720
(1994). http://dx.doi.org/10.1001/archotol.1994.01880310023005 AONSEJ 0886-4470 Google Scholar
S. V. Kaneet al.,
“Depth of invasion is the most significant histological predictor of subclinical cervical lymph node metastasis in early squamous carcinomas of the oral cavity,”
Eur. J. Surg. Oncol., 32
(7), 795
–803
(2006). Google Scholar
W. L. Lodderet al.,
“Tumour thickness in oral cancer using an intra-oral ultrasound probe,”
Eur. Radiol., 21
(1), 98
–106
(2011). http://dx.doi.org/10.1007/s00330-010-1891-7 EURAE3 1432-1084 Google Scholar
A. P. YuenA. C. HoB. Y. Wong,
“Ultrasonographic screening for occult thyroid cancer,”
Head Neck, 33
(4), 453
–457
(2011). http://dx.doi.org/10.1002/hed.v33.4 HEANEE 1097-0347 Google Scholar
H. J. Welkoborsky,
“Ultrasound usage in the head and neck surgeon’s office,”
Curr. Opin. Otolaryngol. Head Neck Surg., 17
(2), 116
–121
(2009). http://dx.doi.org/10.1097/MOO.0b013e3283297042 1068-9508 Google Scholar
L. Sunet al.,
“In vivo cardiac imaging of adult zebrafish using high frequency ultrasound (45–75 MHz),”
Ultrasound Med. Biol., 34
(1), 31
–39
(2008). http://dx.doi.org/10.1016/j.ultrasmedbio.2007.07.002 USMBA3 0301-5629 Google Scholar
J. J. Salley,
“Experimental carcinogenesis in the cheek pouch of the Syrian hamster,”
J. Dent. Res., 33
(2), 253
–262
(1954). http://dx.doi.org/10.1177/00220345540330021201 JDREAF 0022-0345 Google Scholar
Y. Sunet al.,
“Multimodal characterization of compositional, structural and functional features of human atherosclerotic plaques,”
Biomed. Opt. Express, 2
(8), 2288
–2298
(2011). http://dx.doi.org/10.1364/BOE.2.002288 BOEICL 2156-7085 Google Scholar
R. Richards-KortumE. Sevick-Muraca,
“Quantitative optical spectroscopy for tissue diagnosis,”
Annu. Rev. Phys. Chem., 47
(1), 555
–606
(1996). http://dx.doi.org/10.1146/annurev.physchem.47.1.555 ARPLAP 0066-426X Google Scholar
Y. Sunet al.,
“Development of a dual-modal tissue diagnostic system combining time-resolved fluorescence spectroscopy and ultrasonic backscatter microscopy,”
Rev. Sci. Instrum., 80
(6), 065104
(2009). http://dx.doi.org/10.1063/1.3142478 RSINAK 0034-6748 Google Scholar
G. Shklar,
“Experimental oral pathology in the Syrian hamster,”
Prog. Exp. Tumor Res., 16 518
–538
(1972). PEXTAR 0079-6263 Google Scholar
Y. Sunet al.,
“Simultaneous time- and wavelength-resolved fluorescence spectroscopy for near real-time tissue diagnosis,”
Opt. Lett., 33
(6), 630
–632
(2008). http://dx.doi.org/10.1364/OL.33.000630 OPLEDP 0146-9592 Google Scholar
Y. Sunet al.,
“Dynamic tissue analysis using time- and wavelength-resolved fluorescence spectroscopy for atherosclerosis diagnosis,”
Opt. Express, 19
(5), 3890
–3901
(2011). http://dx.doi.org/10.1364/OE.19.003890 OPEXFF 1094-4087 Google Scholar
D. ChorvatA. Chorvatova,
“Multi-wavelength fluorescence lifetime spectroscopy: a new approach to the study of endogenous fluorescence in living cells and tissues,”
Laser Physics Letters, 6
(3), 175
–193
(2009). http://dx.doi.org/10.1002/lapl.v6:3 1612-2011 Google Scholar
M. InagumaK. Hashimoto,
“Porphyrin-like fluorescence in oral cancer: In vivo fluorescence spectral characterization of lesions by use of a near-ultraviolet excited autofluorescence diagnosis system and separation of fluorescent extracts by capillary electrophoresis,”
Cancer, 86
(11), 2201
–2211
(1999). http://dx.doi.org/10.1002/(ISSN)1097-0142 0008-543X Google Scholar
J. Liuet al.,
“A novel method for fast and robust estimation of fluorescence decay dynamics using constrained least-squares deconvolution with Laguerre expansion,”
Phys. Med. Biol., 57
(4), 843
–865
(2012). http://dx.doi.org/10.1088/0031-9155/57/4/843 PHMBA7 0031-9155 Google Scholar
J. A. Joet al.,
“Fast model-free deconvolution of fluorescence decay for analysis of biological systems,”
J. Biomed. Opt., 9
(4), 743
–752
(2004). http://dx.doi.org/10.1117/1.1752919 JBOPFO 1083-3668 Google Scholar
A. Zukauskaset al.,
“Characterization of biological materials by frequency-domain fluorescence lifetime measurements using ultraviolet light-emitting diodes,”
Opt. Mater., 30
(5), 800
–805
(2008). http://dx.doi.org/10.1016/j.optmat.2007.02.042 OMATET 0925-3467 Google Scholar
L. I. Petrellaet al.,
“Study of cutaneous cell carcinomas ex vivo using ultrasound biomicroscopic images,”
Skin Res. Technol., 16
(4), 422
–427
(2010). http://dx.doi.org/10.1111/srt.2010.16.issue-4 0909-752X Google Scholar
H. M. Chenet al.,
“Time-resolved autofluorescence spectroscopy for classifying normal and premalignant oral tissues,”
Lasers Surg. Med., 37
(1), 37
–45
(2005). http://dx.doi.org/10.1002/(ISSN)1096-9101 LSMEDI 0196-8092 Google Scholar
S. Y. Parket al.,
“Multispectral digital microscopy for in vivo monitoring of oral neoplasia in the hamster cheek pouch model of carcinogenesis,”
Opt. Express, 13
(3), 749
–762
(2005). http://dx.doi.org/10.1364/OPEX.13.000749 OPEXFF 1094-4087 Google Scholar
Y. Sunet al.,
“Fluorescence lifetime imaging microscopy: in vivo application to diagnosis of oral carcinoma,”
Opt. Lett., 34
(13), 2081
–2083
(2009). http://dx.doi.org/10.1364/OL.34.002081 OPLEDP 0146-9592 Google Scholar
M. C. Skalaet al.,
“In vivo multiphoton fluorescence lifetime imaging of protein-bound and free nicotinamide adenine dinucleotide in normal and precancerous epithelia,”
J. Biomed. Opt., 12
(2), 024014
(2007). http://dx.doi.org/10.1117/1.2717503 JBOPFO 1083-3668 Google Scholar
S. Srinivasanet al.,
“Noninvasive, in utero imaging of mouse embryonic heart development with 40-MHz echocardiography,”
Circulation, 98
(9), 912
–918
(1998). http://dx.doi.org/10.1161/01.CIR.98.9.912 CIRCAZ 0009-7322 Google Scholar
|


