
|
|
1.IntroductionFetal long bones consist of (pre)articular cartilage, growth plate cartilage, and bone tissue. Together, they regulate longitudinal bone growth and long bone development. (Pre)articular cartilage, also referred to as the proximal resting zone, will eventually become articular cartilage and is located several cell layers below the joint surface. Fetal long bones differ from postnatal long bones in that they do not possess a secondary center of ossification. Moreover, their growth plates are much thicker and the chondrocytes are more compactly located.1 In general, the growth plate can be subdivided into four distinct zones: the resting zone, the proliferative zone, the prehypertrophic zone, and the hypertrophic zone. Resting zone chondrocytes are small, uniform and compactly positioned and are characterized by low rates of proliferation and synthesis of proteoglycans and collagen type IIB.2,3 In the proliferative zone, the chondrocytes have an increased proliferation rate that results in the formation of longitudinal columns. In addition, this zone has increased collagen type II and XI synthesis.1 Following this zone is the prehypertrophic zone, where chondrocytes lose their ability to proliferate and gradually increase in size due to swelling. In the hypertrophic zone, a cascade of events is triggered including ECM mineralization, angiogenesis, and apoptosis of chondrocytes.1 Current knowledge regarding the composition of the different zones is mainly based on histology,4 immunohistochemistry,5 in situ hybridization,6,7 and electron microscopy.8 However, these methods do not yield direct information on the molecular composition of the investigated samples. Therefore, elucidating the molecular compositions of the different cartilage zones can result in a deeper understanding of the changes underlying terminal differentiation of chondrocytes, which drives the development of long bones. Raman spectroscopy is an analytical technique able to measure the molecular composition by providing a spectrum that contains information regarding all the chemical bonds present within the sample. As opposed to histology and immunohistochemistry, which only provides information regarding the presence of specific compounds, Raman spectroscopy creates a “fingerprint” representing the entire molecular composition of the sample. Raman spectroscopy is based on the inelastic light scattering effect, in which one in a million photons is scattered with a different wavelength than the incident photons following interaction with the sample.9–12 The wavelength shift is specific for the chemical bond where the photon is emitted. By detecting all the photons with a shifted wavelength, a Raman spectrum can be constructed. It has been demonstrated that a careful selection of suitable laser wavelength and laser intensity eliminates the possibility of cell damage.13,14 Since the first application of Raman spectroscopy on cells, this technique has been widely used for biological applications.15 In this study, different zones of human fetal femoral tissue were studied with Raman microspectroscopy. In order to be able to compare Raman results to histological data, all experiments were performed on cryosections. The aim of this study was to determine whether confocal Raman microspectroscopy is able to effectively discriminate between different cartilaginous zones of a developing diarthrodial joint and to identify the molecular differences between the (pre)articular cartilage and the different zones of the growth plate cartilage. Together, this knowledge contributes to our understanding on how to generate a specific type of cartilage for future tissue engineering and clinical purposes. 2.Experimental Section2.1.Sample PreparationBovine articular cartilage pieces were obtained from the femoral-patellar groove of a 10-week-old calf, fixed in 10% formalin for 10 min and washed in phosphate-buffered saline (PBS, Gibco). After consent and medical ethical committee permission for use of human fetal material had been obtained, fetal femurs were isolated from three human fetuses undergoing elective termination of pregnancy with 20 weeks of gestation. Femurs were snap-frozen in liquid nitrogen and stored at until processing. The samples were embedded in cryomatrix (Shandon Cryomatrix, Thermo Scientific), frozen to , sectioned at 20 µm thickness at using a cryomicrotome (Shandon Cryotome 77210160, Thermo Scientific), and placed on UV grade calcium fluoride () slides (Crystran Ltd.). Before Raman measurements, the cryosections of the human fetal femur were fixed in 10% formalin for 10 min and extensively washed with PBS and the cryosections of bovine articular cartilage were extensively washed with PBS. 2.2.HistologyThe embedded samples of the fetal femora were sectioned at 8 µm thickness using the cryomicrotome and stained with Safranin-O (Sigma) for visualization of sulfated glycosaminoglycans (sGAGs), hematoxylin and eosin (H&E, Sigma) for visualization of the nuclei and cytoplasm, and Alizarin Red S (Sigma) for visualization of calcification. 2.3.Confocal Raman MicrospectroscopyRaman measurements were performed using a home-built confocal Raman spectrometer as previously described.16–18 Briefly, a Krypton ion laser (Coherent, Innova 90K) with an emission wavelength of 647.1 nm was used as the excitation source. An air objective (Olympus UIS2, UPlanFLN, Olympus, 40x, 0.75 NA) was used to illuminate the sample as well as to collect the Raman-scattered photons in the epi-detection mode. The scattered light was filtered by a razor-edge filter (Semrock, Rochester) to suppress reflected laser light and Rayleigh-scattered light, and focused onto a pinhole of 15 µm diameter at the entrance of an imaging spectrograph/monochromator (HR460; Jobin-Yvon), which contains a blazed holographic grating with . The spectrograph disperses the Raman-scattered photons on an air-cooled electron-multiplying charge-coupled device (EMCCD, Newton DU-970N, Andor Technology). The system provided a spectral resolution of 1.85 to over the wavenumber range from to . The samples were scanned by using a scanning mirror system (SM, MG325D and G120D, General Scanning). Raman spectra were acquired in the so-called “spectral scanning mode” for: 1. washed cryosection with bovine articular cartilage, 2. unwashed cryosection without cartilage, and 3. washed cryosection without cartilage. In this measurement mode, a single full spectrum is obtained by raster scanning the laser beam with a laser power of 35 mW over an area of in 30 s. Raman images were acquired from cryosections of human fetal femurs by recording a full spectrum from each position of the laser beam guided by the displacement of the scanning mirror in the area of interest on the samples. These measurements were performed in an area of with an accumulation time of and an excitation power of 35 mW. The laser spot size used in this study was 310 nm. The area scans were made with 30 µm distance adjacent from each other, by using a Kleindiek substage LT6820 controlled by a Kleindiek NanoControl (Kleindiek Nanotechnik), in such a way that the total area of could be constructed from these initial scans. After data correction, the scans of of fetal femur samples resulted in 256 spectra each, which were subsequently combined into areas of consisting of 4096 spectra from each zone in the human fetal femur. Toluene, a Raman calibration standard with accurately known peak frequencies (521, 785, 1004, 1624, 2921, and ) was used for wavenumber calibration of the spectra. 2.4.Raman Data AnalysisPreprocessing of the data was performed as described in the literature (see Refs. 17, 19, and 20). Briefly, the spectra were preprocessed by: 1. removing cosmic ray events, 2. subtracting the camera-offset noise (dark current), and 3. calibrating the wavenumber axis. Cosmic rays, identified as nonspecific high intensity spikes in the acquired signal with an average width of 1 to 4 pixels and intensity much higher than the detected Raman signal, were removed from the signal using an estimation of the first derivative of the signal and setting a threshold accordingly.21 The well-known band-positions were used to relate wavenumbers to pixels. The frequency-dependent optical detection efficiency of the setup was corrected using a tungsten halogen light source (Avalight-HAL; Avantes BV) with a known emission spectrum. Also, the detector-induced etaloning effect was compensated by this procedure. Singular value decomposition (SVD) was applied to the hyperspectral data cubes (consisting of 4096 spectra) to reduce the uncorrelated noise resulting in the raw 3D data matrix after converting them to 2D matrix.22 The SVD-treated data were analyzed by multivariate data analysis procedures. In multivariate analysis, both principal component analysis (PCA) and hierarchical cluster analysis (HCA) were performed on the datasets resulting in cluster images and corresponding cluster averages. HCA made use of the scores obtained from the PCA to visualize the regions containing high spectral similarities. HCA is an unsupervised cluster analysis method, which resulted in separation of cell spectra from ECM spectra. Cell clusters and ECM clusters were arranged in separate databases and dendograms were made using Ward’s clustering method (HCA) based on Euclidean inter-point distances.23 Squared Euclidean distances as distance measure and Ward’s algorithm to separate Raman spectra into clusters were used. The influence of small variations in the baseline was minimized by preprocessing data with a first derivative Savitsky-Golay algorithm, which was implemented as a seven point smoothing and a quadratic polynomial fit.24,25 The data was further autoscaled to the mean of the spectra along the frequency axis.24,25 Additionally, PCA analysis was performed on the separated cell and ECM cluster averages. PCA is a mathematical reduction of the dimensionality of the measurement matrix into fewer variables (principal components) and describes the most significant variance between the data.25,26 All data manipulations were performed using routines written in MATLAB 7.4 (MathWorks). Ward’s clustering and PCA analysis on the separated cell and ECM cluster average spectra were performed using PLS toolbox (Eigenvectors Research Inc.) in MATLAB 7.8. 3.Results and DiscussionThe aim of this study was to determine whether confocal label-free Raman microspectroscopy is able to effectively discriminate between various tissues, particularly between (pre)articular cartilage and growth plate cartilage of human fetal femur. Detailed understanding of the molecular composition might prove essential in the quest to generate a specific type of cartilage and to identify molecular markers to distinguish between these two types of cartilage for future tissue engineering and clinical purposes. 3.1.HistologyIn order to demonstrate the healthy and unaffected nature of the fetal femur, we subjected 8 µm thick cryosections to histological analysis using Alizarin Red S, Safranin-O, and H&E staining. The results of the histological staining were demonstrated in Fig. 1. Alizarin Red S staining confirmed that (pre)articular cartilage, resting, and proliferative zone cartilage did not contain any detectable levels of calcification. As expected, the terminal areas of the hypertrophic zone showed mild levels of calcification. Moreover, the entire matrix of the endochondral bone was intensely stained for calcification. Safranin-O staining visualized sGAGs, one of the major components of the ECM. In the (pre)articular cartilage and resting zone of growth plate, abundant sGAG deposition was observed. Light microscopy confirmed that in the proliferative zone the ECM to cell ratio decreased. In the hypertrophic zone, the ratio of ECM to cell further decreased. In the endochondral bone, no detectable amounts of sGAGs were present. With the H&E staining, it was demonstrated that the cells in the (pre)articular cartilage and resting zone were very small and compactly located, while in the proliferative zone they were increased in size and the column-like structure of the cells were clearly visible. In the hypertrophic zone, the cells had greatly increased in size and only a small amount of ECM formation was observed. The endochondral bone appeared quite similar to the hypertrophic zone. The combined histological analysis demonstrated the healthy nature of the specimen and allowed for distinct localization of the various zones. Fig. 1Histological analysis of human fetal femurs: Alizarin Red S staining visualized calcification, Safranin O staining visualized sGAGs, and hematoxylin and eosin (H&E) staining visualized nuclei and cytoplasm. In the detailed images of the endochondral bone, the distal part of terminal hypertrophic zone can also be observed (the terminal hypertrophic zone part is labeled with a star and the endochondral bone part with two stars). The boundary between the terminal hypertrophic and endochondral bone part is irregular. The overview scans were made with a 4× objective and scale bars equal 200 µm. The detailed scans were made with a 20× objective and scale bars equal 100 µm. 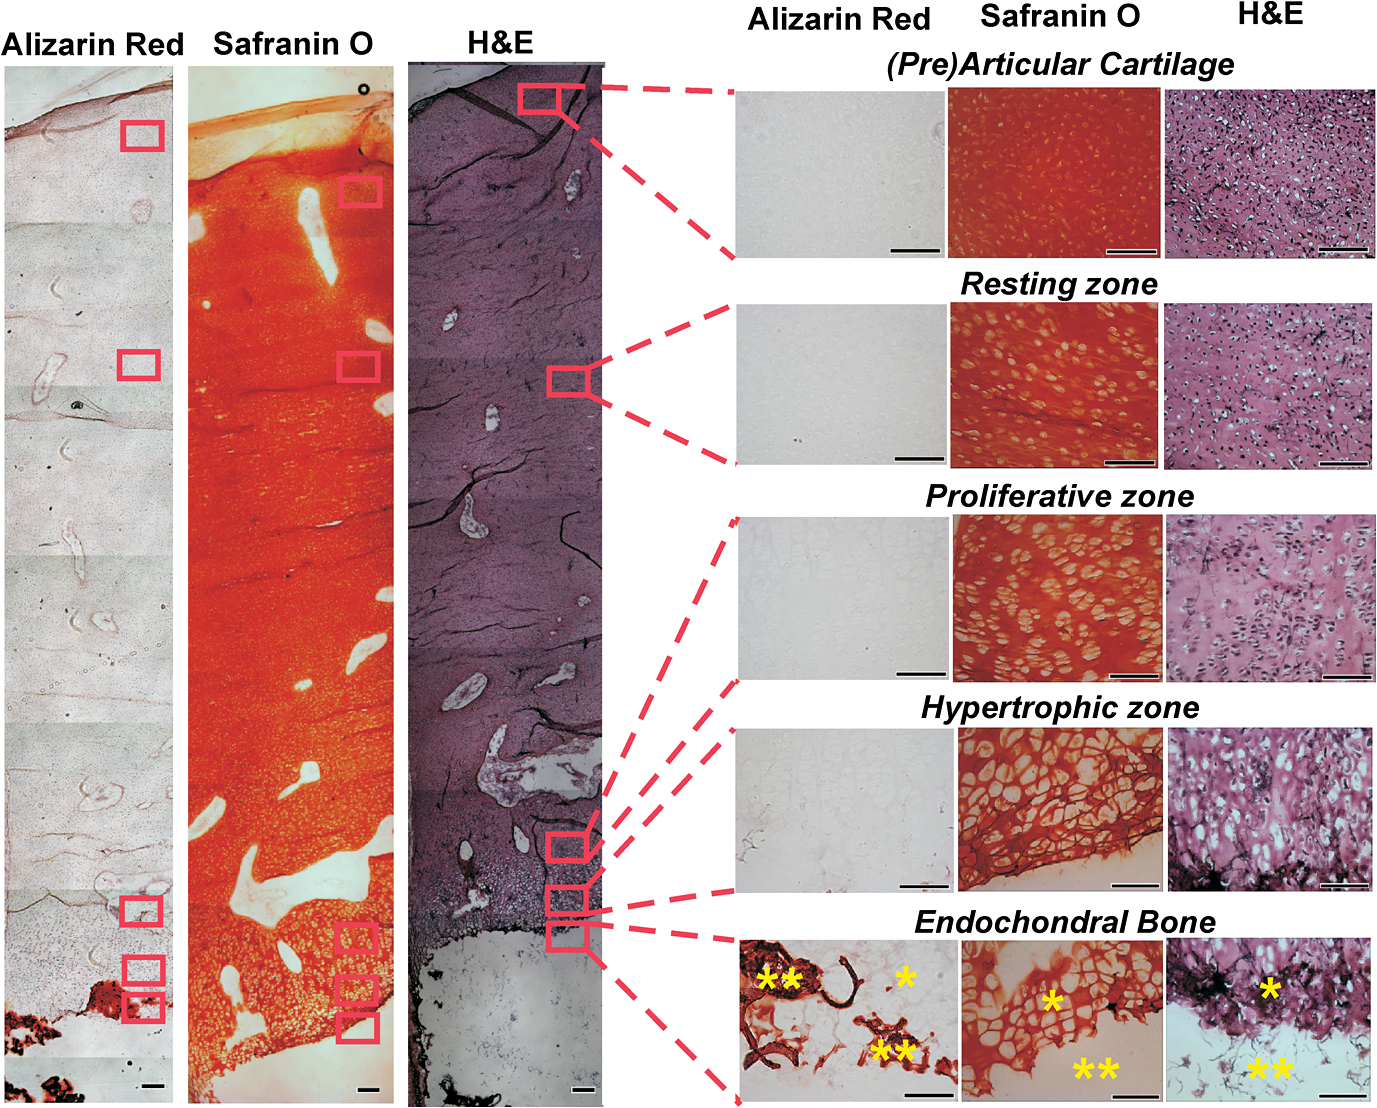 3.2.Confocal Raman MicrospectroscopyIt has previously been reported that the use of paraffin prohibits the acquisition of useful Raman measurements.27 In contrast, it has been shown that the use of cryomatrix, after washing the tissue cryosections with PBS, does not interfere with Raman measurements.28 Therefore, in this study, cryomatrix was used to embed tissue samples and cryosections were prepared for Raman measurements. In addition, slides were used as a substrate of the tissue sections for all the Raman measurement to avoid background signal. Compared with the Raman spectrum of washed cartilage section [Fig. 2(a)], both the spectra of the unwashed [Fig. 2(b)] and washed [Fig. 2(c)] cryomatrix (without cartilage) showed Raman bands in the same regions, except the Raman bands at 630 and . These peaks could be assigned to glycerol29 and poly(vinyl alcohol) (PVA),30 respectively, which are the major compounds of the cryomatrix. The lack of these two peaks in the Raman spectrum of washed cartilage section indicated cryomatrix did not interfere with the cartilage measurements. Fig. 2Raman spectra of cryosections with and without cartilage sample. (a) Washed cryosection with bovine articular cartilage, (b) unwashed cryosection without cartilage, and (c) washed cryosection without cartilage in the range of 500 to acquired in the so-called “spectral scanning mode.” The spectra were identically scaled and vertically displaced for clarity.  Raman spectroscopic studies of native cartilage have mainly focused on direct analysis of ECM components. Raman analysis has been performed for the analysis of collagen in the sclera, articular cartilage, and subchondral bone of wild-type and transgenic mice harboring structural truncations in the introduced collagen type II transgene.31 Moreover, Raman microspectroscopic mapping studies have already been carried out on human bronchial tissue.32 FTIR spectroscopy is usually a more common tool to study articular cartilage. For example, it has been demonstrated in literature that FTIR imaging can assess changes in composition and distribution of ECM components in human osteoarthritic cartilage.33 In this study, Raman measurements on human fetal femur samples were performed on the areas highlighted in Fig. 1 and on sections consecutive to the sections used for histological analysis. Bright field images (in the bright field mode of the Raman microscope) were obtained from (pre)articular cartilage, resting, proliferative, and hypertrophic zones of the growth plate and the endochondral bone from human fetal femora corresponded with the respective zones demonstrated with conventional histological analysis (Figs. 1 and 3). Raman scans representative of were made in the same zones as the observed ones in the depicted bright field images. Cluster images with the corresponding cluster averages were obtained from each area (Fig. 3). Hierarchical clustering separated Raman spectra of cells from Raman spectra of ECM. This was verified by comparing hierarchical cluster images with intensity-based Raman images for DNA/RNA bands at (Fig. 3). The intensity-based Raman images showed a high DNA/RNA concentration at the same locations as the purple clusters in the cluster images and could be shown as separate clusters in each hierarchical cluster image, which confirms that cells and ECM can be effectively separated based on their respective Raman spectra. Fig. 3Bright field images, cluster images with corresponding Raman cluster averages from cells and ECM, and Raman images from the (pre)articular cartilage, the resting, proliferative, and hypertrophic zone of the growth plate and the endochondral bone from the human fetal femur. Raman images were focused on the intensity of the DNA/RNA band at . The highest (red) intensity of this band can be observed within the cells in all the zones. Each cluster average spectrum is corresponding to the cluster with the same color in the cluster images (purple spectrum of the cluster averages is corresponding to the purple clusters in the cluster image). The purple clusters are corresponding to cell clusters and the black clusters to ECM clusters in all the zones of the fetal femur. In the endochondral bone, two clusters, the black and the red, are representing the ECM clusters, which can be explained by the heterogeneous character of the ECM in this region. In the hypertrophic zone, the red clusters were fluorescent background noise, therefore they were removed from the cluster averages and were not used for further data analysis. The truncated and separated cluster averages are also demonstrated in Fig. 4 (cells) and Fig. 5 (ECM) in more detail for further observation. Scale bars on the bright field images equal 20 µm.  For further data analysis, cluster averages corresponding to cells or ECM were combined in separate databases, thus creating one database specific for all cell cluster averages and one database specific for all ECM cluster averages of each zone. All cell cluster averages showed well-described bands corresponding to collagen,34 phenylalanine,35 chondroitin sulfate and proteoglycans (including aggrecan),36–38 lipids/proteins ( bending mode39 and amide I40,41), and DNA/RNA42,43 (Table 1). Table 1Assignments and wavelengths for Raman peaks.
Comparing the cell cluster averages with the ECM cluster averages, the most notable difference was the Raman peak of the DNA/RNA at , which was clearly visible in all the cell-spectra [Fig. 4(a)], while it was absent in all the ECM spectra (Fig. 5). This supported our assumption that the cells and ECM could be separated based on their Raman spectra for further analysis. Raman images from (pre)articular cartilage focused on the intensity of the DNA/RNA peak at was also demonstrated in Fig. 4(b). As expected, the highest intensity (red) of the DNA/RNA peak was observed inside the cells. Except for the DNA/RNA band and differences in band intensities, for example the more intense proteoglycan peaks in ECM spectra, also represented by the Raman images in Fig. 6, cell and ECM spectra had identical peaks. All the cluster averages from the cells showed relatively identical Raman peaks, except for the peak in the spectrum of the endochondral bone cell presented at [Fig. 4(a)]. As expected, this peak was undetectable in cell spectra from other zones, but appeared as a very intense peak in the spectra of endochondral bone ECM and as a less intense band in the hypertrophic zone ECM spectra (Fig. 5). This peak is representative for symmetric vibration, which is a marker for calcification of the ECM.44 As expected, these results indicate milder levels of mineralization in the hypertrophic zone ECM than in the endochondral bone ECM, which was also shown by Alizarin Red S staining in Fig. 1 and can be correlated with well-known biochemical differences between these zones of the fetal femur. Fig. 4Raman cluster averages of cells. (a) Average Raman spectra of cells from the (pre)articular cartilage, the resting, proliferative, and hypertrophic zone, and the endochondral bone in the region from 600 to . The spectra were vertically displaced for clarity. Truncated Raman spectra from the (pre)articular zone represented in the region from 1300 to . (b) Raman image from (pre)articular cartilage focused on the intensity of the DNA/RNA peak at .  Fig. 5Raman cluster averages of ECM. Average Raman spectra of ECM from the (pre)articular cartilage, the resting, proliferative, and hypertrophic zone, and the endochondral bone in the region from 600 to . The spectra were vertically displaced for clarity. Truncated Raman spectrum from the (pre)articular zone represented in the region from 1300 to .  Fig. 6Intensity based Raman images, focused on the Raman band corresponding to proteoglycans at , from the (pre)articular cartilage, the resting, proliferative, and hypertrophic zone of the growth plate, and the endochondral bone from the human fetal femur. The highest intensity was observed in the ECM in all the zones.  In addition, Ward’s clustering method (HCA) on cell and ECM cluster averages from all the three donors was used to create dendrograms (Fig. 7) of which representative examples of each individual donor can be seen in Figs. 8, 9, and 10. Raman mapping in combination with multivariate data analysis was previously shown to be successful for the analysis of porcine articular cartilage and used to distinguish between three major zones (superficial, middle, and deep zone) based on major ECM components like collagen and chondroitin-sulfate and noncollagenous proteins.37 Fig. 7HCA analysis by Ward’s clustering method of Raman average spectra from (a) cells and (b) ECM acquired from the measured zones of the human fetal femur. Each cluster shows grouping of spectral information based on the different zones of the human fetal femur: (pre)articular cartilage, the resting, proliferative, and hypertrophic zone, and the endochondral bone.  Fig. 8HCA analysis by Ward’s clustering method of Raman average spectra from cells and ECM acquired from the measured zones of the human fetal femur of Donor 1.  Fig. 9HCA analysis by Ward’s clustering method of Raman average spectra from cells and ECM acquired from the measured zones of the human fetal femur of Donor 2.  Fig. 10HCA analysis by Ward’s clustering method of Raman average spectra from cells and ECM acquired from the measured zones of the human fetal femur of Donor 3.  The dendrogram in Fig. 7(a) shows the clustering of Raman average spectra of the cells from the different zones of the human fetal femora. Before HCA, cell spectra from all three donors were averaged, and the smaller the variance-weighted distance between the cluster centers was, the more they resembled each other. Starting from the right side of the dendrogram, the first two clusters resulted in grouping of spectra corresponding to: 1. (pre)articular cartilage and resting zone cells, and 2. hypertrophic zone, proliferative zone, and endochondral bone cells. The first node separated the spectra corresponding to endochondral bone cells from the cluster of the hypertrophic zone and proliferative zone cells. Since cells in the hypertrophic zone and in the proliferative zone proliferate rapidly, one might expect these cells to have a different chemical composition than the (pre)articular cartilage and resting zone cells, which were in a relatively quiescent state.1 The differences between chondrocytes and bone cells would include the expression of different genes and therefore different RNAs and intracellular proteins. Some of the DNA and RNA Raman band positions are unique for certain nucleotides,41,45 and could therefore help to discriminate between different cell types. The second node separated the spectra corresponding to the (pre)articular cartilage from the resting zone cells. The third cluster involved all the spectra from the hypertrophic zone and proliferative zone cells. The dendrogram in Fig. 7(b) shows the clustering of the Raman average spectra of the ECM from the measured zones of the fetal femur. Before HCA, the ECM spectra from all three donors were averaged. As expected, endochondral bone ECM with calcium deposition resembled the least with ECM of all other cartilaginous zones. Moreover, proliferative zone ECM better resembled the hypertrophic zone ECM than the (pre)articular cartilage and resting zone ECM. After performing HCA, a more elaborate investigation explored the origin of the established dissimilarities in order to find Raman markers identifying molecular differences between the (pre)articular cartilage and growth plate cartilage. In order to find these markers, PCA was performed on the separated cell and ECM cluster average spectra. This method has already been applied for monitoring spectral differences in mRNA translation of embryonic stem cells during differentiation.25 This type of analysis allows the interpretation of similarities and differences between the clusters of the samples by analyzing the PCA scores and loadings.25 In Raman spectroscopy, the PCA loadings are combinations between Raman spectra of components of the sample that describe the biggest difference between spectra.25 By analyzing the cell-cluster averages by PCA [Fig. 11(a) and 11(b)] and utilizing mean-centering on all the spectra as preprocessing, the first principal component gave 72.44% of the variance and described the difference between the (pre)articular cartilage cells and cells from the zones of the growth plate. (Pre)articular cartilage cells were characterized by high positive values of PC1 scores (endochondral bone cells had low positive values), while cells from the resting, proliferative, and hypertrophic zones had negative scores [Fig. 11(a)]. The PC1 loading spectrum resembled the spectrum of intracellular proteins and lipids with characteristic peaks for collagen at , phenylalanine at , bending mode (lipids/proteins) at , and amide I (lipids/proteins) at [Fig. 11(b)]. The spectrum of the PC1 loading showed that main differences between the (pre)articular cartilage cells and cells from the zones of the growth plate originate from differences in intracellular protein levels. By analyzing the ECM-cluster averages by PCA [Fig. 11(c) and 11(d)], utilizing mean-centering on all the spectra as preprocessing, the first principal component gave 97.10% of the variance and described the difference between endochondral bone ECM and ECM from the rest of the zones of fetal femur. (Pre)articular cartilage, resting zone, and proliferative zone ECM was characterized by negative values of PC1 scores, while endochondral bone ECM had high positive scores [Fig. 11(c)]. The PC1 loading spectrum showed the strongest peak at , corresponding to phosphate in the ECM [Fig. 11(d)]. This result showed that the phosphate content of the endochondral bone ECM was the major contributor for biochemical differences between endochondral bone and the rest of the zones. The hypertrophic zone ECM was found to have low positive scores, indicating a mild level of phosphate production (onset of mineralization) in the ECM of this zone. These results are in contrast to what was recently described in a study on adult articular cartilage, in which the authors measured the collagen proline bands at 817 and to describe the distinction between the superficial and deep zones.38 However, in our study of fetal articular cartilage, we also included the endochondral zone, allowing for an elaboration of the differences within the hypertrophic zone. Fig. 11PCA analysis. (a) PC1 scores of cells from different zones of the fetal femur (1: (pre)articular cartilage cells, 2: resting zone cells, 3: proliferative zone cells, 4: hypertrophic zone cells, and 5: endochondral bone cells). (b) PC1 loading from PCA analysis of cell cluster averages. The PC1 loading spectrum resembled the spectra of intracellular proteins. (c) PC1 scores of ECM from different zones of the fetal femur [1: (pre)articular cartilage ECM, 2: resting zone ECM, 3: proliferative zone ECM, 4: hypertrophic zone ECM, and 5: endochondral bone ECM]. (d) PC1 loading from PCA analysis of ECM cluster averages. The PC1 loading spectrum showed the strongest peak at corresponding to phosphate.  4.ConclusionUnlike histology and immunohistochemistry, which only give information on the presence of specific compounds, Raman microspectroscopy provides a “fingerprint” representing the entire molecular composition of the zones in human fetal femur. We were able to distinguish bands specific for collagen, phosphate, phenylalanine, DNA/RNA, and amide I. Although unique single difference Raman markers could not be detected in the cartilaginous zones of the femora, the overall (dis)similarities between measured zones were effectively visualized using dendrograms created by Ward’s clustering method. Hierarchical clustering of spectra from different zones in the dendrograms could be related to well-known biochemical differences between cells and ECM from different zones. Furthermore, the main spectral differences could be also determined by analyzing the PCA scores and loadings obtained from the PCA analysis of separate cell and ECM cluster average spectra of the different zones. Therefore, these results show the possibility of label-free Raman microspectroscopy to distinguish between the various cartilage tissues in the human fetal femur cartilage. In addition, it shows its potential to study cartilaginous matrix formation for future tissue engineering and clinical purposes. In cartilage tissue engineering, the occurrence of hypertrophy in tissue-engineered constructs during in vitro generation of hyaline cartilage is a well-described problem. Identifying label-free Raman markers for hypertrophy and distinguishing between (pre)articular and growth plate (more specifically cartilage of the hypertrophic zone) cartilage by cluster analysis of Raman spectra from these zones could provide an excellent method for monitoring the quality of cartilage transplants. AcknowledgmentsThe authors gratefully acknowledge the support of the Dutch Program for Tissue Engineering (DPTE) through the Grant number TGT. 6737, the TeRM Smart Mix Program of the Netherlands Ministry of Economic Affairs, and the Netherlands Ministry of Education, Culture, and Science. ReferencesR. T. BallockR. J. O’Keefe,
“Current concepts review: the biology of the growth plate,”
J. Bone Joint Surg. Ser. A, 85
(4), 715
–726
(2003). Google Scholar
J. Melroseet al.,
“The use of Histochoice™® for histological examination of articular and growth plate cartilages, intervertebral disc and meniscus,”
Biotech. Histochem., 83
(1), 47
–53
(2008). http://dx.doi.org/10.1080/10520290801990414 BIHIEU 1052-0295 Google Scholar
B. F. EamesL. De la FuenteJ. A. Helms,
“Molecular ontogeny of the skeleton,”
Birth Defects Res. Part C, 69
(2), 93
–101
(2003). http://dx.doi.org/10.1002/(ISSN)1542-9768 1542-975X Google Scholar
V. Abadet al.,
“The role of the resting zone in growth plate chondrogenesis,”
Endocrinol., 143
(5), 1851
–1857
(2002). http://dx.doi.org/10.1210/en.143.5.1851 ENDOAO 0013-7227 Google Scholar
E. Mauet al.,
“PTHrP regulates growth plate chondrocyte differentiation and proliferation in a Gli3 dependent manner utilizing hedgehog ligand dependent and independent mechanisms,”
Dev. Biol., 305
(1), 28
–39
(2007). http://dx.doi.org/10.1016/j.ydbio.2007.01.031 DEBIAO 0012-1606 Google Scholar
M. SandbergE. Vuorio,
“Localization of types I, II, and III collagen mRNAs in developing human skeletal tissues by in situ hybridization,”
J. Cell Biol., 104
(4), 1077
–1084
(1987). http://dx.doi.org/10.1083/jcb.104.4.1077 JCLBA3 0021-9525 Google Scholar
T. H. Vuet al.,
“MMP-9/gelatinase B is a key regulator of growth plate angiogenesis and apoptosis of hypertrophic chondrocytes,”
Cell, 93
(3), 411
–422
(1998). http://dx.doi.org/10.1016/S0092-8674(00)81169-1 CELLB5 0092-8674 Google Scholar
F. Burdanet al.,
“Morphology and physiology of the epiphyseal growth plate,”
Folia Histochem. Cytobiol., 47
(1), 5
–16
(2009). http://dx.doi.org/10.2478/v10042-009-0007-1 FHCYEM 0239-8508 Google Scholar
N. B. ColthupL. H. DalyS. E. Wiberly, Introduction to Infrared and Raman Spectroscopy, Academic Press, New York
(1990). Google Scholar
P. HendraC. JonesG. Warnes, Fourier Transform Raman Spectroscopy, Ellis Horwood, Chichester
(1991). Google Scholar
B. Schrader, Infrared and Raman Spectroscopy: Methods and Applications, Verlag Chemie, Weinheim
(1995). Google Scholar
D. I. EllisR. Goodacre,
“Metabolic fingerprinting in disease diagnosis: biomedical applications of infrared and Raman spectroscopy,”
Analyst, 131
(8), 875
–885
(2006). http://dx.doi.org/10.1039/b602376m ANLYAG 0365-4885 Google Scholar
I. Notingheret al.,
“In situ characterisation of living cells by Raman spectroscopy,”
Spectrosc., 16
(2), 43
–51
(2002). http://dx.doi.org/10.1155/2002/408381 SPIJDZ 0712-4813 Google Scholar
G. J. Puppelset al.,
“Laser irradiation and Raman spectroscopy of single living cells and chromosomes: sample degradation occurs with 514.5 nm but not with 660 nm laser light,”
Exp. Cell Res., 195
(2), 361
–367
(1991). http://dx.doi.org/10.1016/0014-4827(91)90385-8 ECREAL 0014-4827 Google Scholar
G. J. Puppelset al.,
“Studying single living cells and chromosomes by confocal Raman microspectroscopy,”
Nature, 347
(6290), 301
–303
(1990). http://dx.doi.org/10.1038/347301a0 NATUAS 0028-0836 Google Scholar
H. J. Van ManenA. LenferinkC. Otto,
“Noninvasive imaging of protein metabolic labeling in single human cells using stable isotopes and Raman microscopy,”
Anal. Chem., 80
(24), 9576
–9582
(2008). http://dx.doi.org/10.1021/ac801841y ANCHAM 0003-2700 Google Scholar
V. V. Pullyet al.,
“Hybrid Rayleigh, Raman and TPE fluorescence spectral confocal microscopy of living cells,”
J. Raman Spectrosc., 41
(6), 599
–608
(2010). http://dx.doi.org/10.1002/jrs.v41:6 JRSPAF 0377-0486 Google Scholar
A. Kunstaret al.,
“Raman microspectroscopy: a non-invasive anlysis tool for monitoring of collagen-containing extracellular matrix formation in a medium-throughput culture system,”
Tissue Eng., 17
(7), 737
–744
(2011). http://dx.doi.org/10.1089/ten.tec.2010.0574 1937-3341 Google Scholar
N. Uzunbajakavaet al.,
“Nonresonant confocal Raman imaging of DNA and protein distribution in apoptotic cells,”
Biophys. J., 84
(6), 3968
–3981
(2003). http://dx.doi.org/10.1016/S0006-3495(03)75124-8 BIOJAU 0006-3495 Google Scholar
H. J. Van Manenet al.,
“Intracellular chemical imaging of heme-containing enzymes involved in innate immunity using resonance Raman microscopy,”
J. Phys. Chem. B, 108
(48), 18762
–18771
(2004). http://dx.doi.org/10.1021/jp046955b JPCBFK 1520-6106 Google Scholar
L. Hartsuiker,
“Microspectroscopic characterisation of gold nanorods for cancer cell detection,”
University of Twente: Enschede, The Netherlands,
(2011). Google Scholar
N. UzunbajakavaJ. GreveC. Otto,
“Raman microscopy of cells: chemical imaging of apoptosis,”
Proc. SPIE, 4963 223
–230
(2003). http://dx.doi.org/10.1117/12.487609 Google Scholar
C. Hervada-SalaE. Jarauta-Bragulat,
“A program to perform Ward’s clustering method on several regionalized variables,”
Comput. Geosci., 30
(8), 881
–886
(2004). http://dx.doi.org/10.1016/j.cageo.2004.07.003 CGEODT 0098-3004 Google Scholar
V. V. Pully,
“From cells to bone: Raman microspectroscopy of the mineralization of stromal cells,”
University of Twente: Enschede, The Netherlands,
(2010). Google Scholar
I. Notingheret al.,
“In situ spectral monitoring of mRNA translation in embryonic stem cells during differentiation in vitro,”
Anal. Chem., 76
(11), 3185
–3193
(2004). http://dx.doi.org/10.1021/ac0498720 ANCHAM 0003-2700 Google Scholar
S. WoldK. EsbensenP. Geladi,
“Principal component analysis,”
Chemom. Intell. Lab. Syst., 2
(1–3), 37
–52
(1987). http://dx.doi.org/10.1016/0169-7439(87)80084-9 CILSEN 0169-7439 Google Scholar
E. Ó. Faoláinet al.,
“Raman spectroscopic evaluation of efficacy of current paraffin wax section dewaxing agents,”
J. Histochem. Cytochem., 53
(1), 121
–129
(2005). http://dx.doi.org/10.1177/002215540505300114 JHCYAS 0022-1554 Google Scholar
C. Y. Wanget al.,
“Diagnosis of oral cancer by light-induced autofluorescence spectroscopy using double excitation wavelengths,”
Oral Oncol., 35
(2), 144
–150
(1999). http://dx.doi.org/10.1016/S1368-8375(98)00107-9 EJCCER 1368-8375 Google Scholar
C. Krafftet al.,
“Near infrared Raman spectra of human brain lipids,”
Spectrochim. Acta Part A, 61
(7), 1529
–1535
(2005). http://dx.doi.org/10.1016/j.saa.2004.11.017 SAMCAS 1386-1425 Google Scholar
W. D. Hergeth,
“Raman scattering on polymeric dispersions,”
Chem. Eng. Technol., 21
(8), 647
–651
(1998). http://dx.doi.org/10.1002/(ISSN)1521-4125 CETEER 1521-4125 Google Scholar
K. A. Dehringet al.,
“Correlating changes in collagen secondary structure with aging and defective type II collagen by Raman spectroscopy,”
Appl. Spectrosc., 60
(4), 366
–72
(2006). http://dx.doi.org/10.1366/000370206776593582 APSPA4 0003-7028 Google Scholar
S. Koljenovicet al.,
“Raman microspectroscopic mapping studies of human bronchial tissue,”
J. Biomed. Opt., 9
(6), 1187
–1197
(2004). http://dx.doi.org/10.1117/1.1805555 JBOPFO 1083-3668 Google Scholar
E. David-Vaudeyet al.,
“Fourier transform infrared imaging of focal lesions in human osteoarthritic cartilage,”
Eur. Cell Mater., 10 51
–60
(2005). ECMUBB 1473-2262 Google Scholar
W. T. Chenget al.,
“Micro-Raman spectroscopy used to identify and grade human skin pilomatrixoma,”
Microsc. Res. Tech., 68
(2), 75
–79
(2005). http://dx.doi.org/10.1002/(ISSN)1097-0029 MRTEEO 1059-910X Google Scholar
E. Ó. Faoláinet al.,
“A study examining the effects of tissue processing on human tissue sections using vibrational spectroscopy,”
Vib. Spectrosc., 38
(1–2), 121
–127
(2005). http://dx.doi.org/10.1016/j.vibspec.2005.02.013 VISPEK 0924-2031 Google Scholar
R. EllisE. GreenC. P. Winlove,
“Structural analysis of glycosaminoglycans and proteoglycans by means of Raman microspectrometry,”
Connecti. Tissue Res., 50
(1), 29
–36
(2009). http://dx.doi.org/10.1080/03008200802398422 CVTRBC 0300-8207 Google Scholar
A. Bonifacioet al.,
“Chemical imaging of articular cartilage sections with Raman mapping, employing uni- and multi-variate methods for data analysis,”
Analyst, 135
(12), 3193
–3204
(2010). http://dx.doi.org/10.1039/c0an00459f ANLYAG 0365-4885 Google Scholar
M. Pudlaset al.,
“Non-invasive identification of proteoglycans and chondrocyte differentiation state by Raman microspectroscopy,”
J. Biophotonics, 1
–8
(2012). http://dx.doi.org/10.1002/jbio.201200064 JBOIBX 1864-063X Google Scholar
C. J. FrankR. L. MccreeryD. C. B. Redd,
“Raman-spectroscopy of normal and diseased human breast tissues,”
Anal. Chem., 67
(5), 777
–783
(1995). http://dx.doi.org/10.1021/ac00101a001 ANCHAM 0003-2700 Google Scholar
R. J. Lakshmiet al.,
“Tissue Raman spectroscopy for the study of radiation damage: brain irradiation of mice,”
Radiat. Res., 157
(2), 175
–182
(2002). http://dx.doi.org/10.1667/0033-7587(2002)157[0175:TRSFTS]2.0.CO;2 RAREAE 0033-7587 Google Scholar
I. Notingheret al.,
“Discrimination between ricin and sulphur mustard toxicity in vitro using Raman spectroscopy,”
J. R. Soc., Interface, 1
(1), 79
–90
(2004). http://dx.doi.org/10.1098/rsif.2004.0008 1742-5689 Google Scholar
A. J. Ruiz-Chicaet al.,
“Characterization by Raman spectroscopy of conformational changes on guanine-cytosine and adenine-thymine oligonucleotides induced by aminooxy analogues of spermidine,”
J. Raman Spectrosc., 35
(2), 93
–100
(2004). http://dx.doi.org/10.1002/(ISSN)1097-4555 JRSPAF 0377-0486 Google Scholar
M. F. K. Funget al.,
“Pressure-tuning Fourier transform infrared spectroscopic study of carcinogenesis in human endometrium,”
Biospectrosc., 2
(3), 155
–165
(1996). http://dx.doi.org/10.1002/(SICI)1520-6343(1996)2:3<155::AID-BSPY2>3.3.CO;2-F BIOSFS 1075-4261 Google Scholar
C. P. TarnowskiM. A. IgnelziM. D. Morris,
“Mineralization of developing mouse calvaria as revealed by Raman microspectroscopy,”
J. Bone Miner. Res., 17
(6), 1118
–1126
(2002). http://dx.doi.org/10.1359/jbmr.2002.17.6.1118 JBMREJ 0884-0431 Google Scholar
J. W. Chanet al.,
“Micro-Raman spectroscopy detects individual neoplastic and normal hematopoietic cells,”
Biophys. J., 90
(2), 648
–656
(2006). http://dx.doi.org/10.1529/biophysj.105.066761 BIOJAU 0006-3495 Google Scholar
|


