
|
|
1.IntroductionShape sensing and structural health monitoring have been major applications in the development of fiberoptic sensing systems.1–4 One motivation for this research and development is its application in robotics for spatial awareness and control in hazardous conditions such as subsea manipulation, industrial inspection, and assisting medical applications, such as minimally invasive surgery. The majority of the systems are based upon monitoring the strain experienced using multiplexed fiberoptic sensors. The sensing element in these shape-sensing arrays varies. Fiber Bragg gratings (FBGs) have been utilized along with a shape determination algorithm that is based upon a strain-mapping technique which uses trial functions to represent the shapes.1 The weakness of this approach is having to calibrate the system for the specific applications and using the trial functions to interpolate between known shapes and to extrapolate, which can lead to significant errors. Other sensors that are being considered include the use of multi-core fiber to obtain a three-dimensional orientation sensor.3 A multi-core sensor can determine its own shape in Euclidean space, but there remain problems involved with interrogating the individual cores. Alternative shape-sensing systems include fiberoptic loop sensors based on bend-induced losses, such as the commercially available system called ShapeTape.2 While the data acquisition for this technique is high (110 Hz), there are limitations on the curvatures that this system can deal with. Other systems are based upon distributed sensing, such as intrinsic Rayleigh backscattering employing an optical frequency domain reflectometry (OFDR) interrogation technique;5 this system yields the shape of a linear structure but not of an object and hence cannot be used to recover volume. Alternative approaches to shape sensing employ camera systems using complex shape-sensing recognition algorithms.2,6 These camera-based systems are very much laboratory-based systems and the user needs a high level of training to operate such system. Long period grating (LPG) fiber sensors have been proposed for shape-sensing applications. LPGs have good curvature sensitivity and can have geometric orientation dependence.7 A major drawback of these schemes is the multiplexing of large arrays of LPGs. Using eccentric core fibers with LPGs also yields orientation dependence, but there are problems when connecting these fibers to single mode fiber (SMF) fiber-based components such as pigtailed distributed feedback (DFB) lasers. There are several research groups investigating respiratory function monitoring using fiber sensors.8–10 These fiber sensor systems have some drawbacks relating to detecting changes to the sensing array that can be correlated to respiratory motion of the human torso.8,9 The weakness is that they cannot be used independently and need a calibration with a spirometer to determine the total/tidal volume and cannot be used to determine the regional volume changes during breathing. More recently researchers have used a combination of sensing array techniques10 that needs to be calibrated to an individual patient (a strain mapping is required) and has a slow measurement rate of 2 Hz, with corruption possible due to buckling. One specific and novel medical application is ambulatory respiratory function monitoring and plethysmography.11,12 This technique can help to detect respiratory disease, which is a major cause of morbidity and death in the United Kingdom and worldwide. A system capable of meeting this challenge offers the opportunity of continuous ambulatory monitoring of asthma. This is a condition that affects one child in seven in the United Kingdom and 300 million individuals worldwide. Monitoring of chronic obstructive pulmonary disease (COPD),13 the fourth most common cause of death worldwide, and cystic fibrosis, the most common single gene disorder of childhood,14 would also become possible. Recently there have been attempts by our research group to produce a mobile and cost-effective system to measure the absolute volumetric changes during respiration from sections of the human torso using various techniques.15,16 Previous researchers have demonstrated that respiratory gas flow could be measured at the surface of the chest and abdomen, thus negating the need for measurement of flow at the mouth, potentially stopping misdiagnosis. There are obvious applications in neonatal intensive care units for a system that accurately measures respiratory tidal volumes. Another vest for children would need to be designed, but the sensing scheme remains the same. A number of measurement devices have been developed following the original researchers in this field;11 paradigms include respiratory inductive plethysmography (RIP),12 optical reflectance plethysmography (ORP),17 and the use of magnetometers.18 Each of these has certain limitations for use in mobile respiration monitoring. These pertain to the accuracy over wide variations in tidal volume and changes in posture after the calibration, as are observed with RIP.19 This can be addressed by using a sensor array13,20 working in conjunction with signal processing techniques that rely heavily on assumed models of the human anatomy. The cost and realisation of a sufficiently dense array of magnetometers is prohibitive. While the ORP methods lack such limitations, they rely on an off-body reference with which to track specified anatomical locations. Present instrumentation is bulky and generally has to be operated while the patient occupies a confined area. It follows that the technique is not suitable for routine ambulatory monitoring. More recently an LPG sensor array has been used to monitor absolute volumetric tidal changes.15,16 The problems with this approach are the difficulty of multiplexing, the low sensor density, slow time response, crude shape reconstruction, and lack of absolute measurement. Additional problems associated with LPGs are that their spectral features are broad (up to at the 3-dB level) and can experience large wavelength shifts—typically from 10 to 70 nm (see Ref. 21)—further complicating their interrogation. The system demonstrated in this paper is based upon FBGs, and while they do not have the intrinsic curvature sensitivity of LPGs, they can be packaged to provide sufficient sensitivity for this application. This scheme is based on directional bend sensors that consist of two FBGs to both obtain the direction of the curvature and calibrate out common mode strain and temperature effects. The scheme works in real time and has a data acquisition rate of 12 Hz for the entire array. As we will show, our method offers advantages in comparison to previously existing approaches, the most important of which is real-time three-dimensional shape reconstruction through tailor-made algorithms, yielding real-time absolute total and regional volume changes of the human torso. This sensing scheme has the potential to be both relatively inexpensive to implement and compact in size, meaning that the entire system could be attached to the patient being monitored. It is important to note that the system does not require any prior knowledge of the shape of the torso of the individual subjects, as the curvature and enclosed volume is directly determined by the information provided by the sensing elements. Also, the sensing elements are calibrated once before their insertion in the garment, and no separate calibration is needed for different test subjects. These are particularly important points as they make this technology highly portable and directly usable in ambulatory applications with a range of different patient body shapes. It is hoped that this sensing scheme has the potential to offer additional information for diagnosis to clinicians working in respiratory function monitoring and other medical fields. 2.Curvature Sensor and Sensing ArrayThere are 20 sensing locations within the sensor array, each sensing location consisting of two FBGs spatially arranged one above the other separated by a small distance, typically either side of the neutral axis to ensure the sensors respond in opposite fashions to curvature (Figs. 1 and 2). All the FBGs are inscribed in series along a single fiber optic line (SMFe208) separated by an optical path length of 1 m (due to the limitations of the interrogation scheme employed). The excess optical fiber between the FBGs is encapsulated into the silicone rubber sensing array. The array shape was chosen specifically for the respiratory function monitoring of humans. There are sensors that are adjacent to the human spine to reflect the posture of the subject and sensing arms that attach around the abdominal and thorax regions of the torso of the subject. The total length of the optical fiber is 42 m, and this is all encapsulated within a low temperature (90°C) curing silicone rubber (Schematic Fig. 1). Therefore the optical fiber is arranged in the silicone rubber so that in a three-dimensional space of Euclidean geometry the sensing locations (two FBGs) are separated by a few centimeters (from to ) with the optical path difference of a meter between each FBG in the array. The sensing length of each rib is 69.5 cm with an additional silicone encapsulation of fiber that gives an overall width of 104.0 cm. The sensing length of the spine is 33 cm, again with additional silicone encapsulation for the fiber extending this to 58.0 cm (see Fig. 1). The silicone rubber reduces the effect of transient ambient temperature changes on the FBGs. Each FBG is approximately 20 mm long, having a peak reflectivity of 5% along with a spectral bandwidth full width half maximum (FWHM) of 70 pm. These FBGs are specifically designed for the interrogation scheme22 employed for the sensing array based on time division multiplexing and all have approximately the same peak wavelength. The interrogation unit itself is commercially available from Moog Insensys Ltd and has the physical appearance of a black box approximately in size with a weight of 2 kg, with two ports for two sensing arrays along with a power point and USB connection for control by a computer. The interrogator addresses sensors at a frequency of 500 Hz; this sensing array consists of 42 devices and thus the complete array is addressed 12 times per second. A calibration of curvature at the sensing locations was first performed. The bending of the silicone where the two FBG elements are located was achieved by using the experimental setup shown in Fig. 2. The FBG sensor was clamped between two towers; one of the clamps was mounted on a translation stage, which was moved inward to induce a bend in the optical fiber. This arrangement, where the FBGs is midway between the clamps, gives the sensor’s curvature, , as: where is the half distance between the edges of the two towers and is the bending displacement at the center of the two FBGs.21The interrogation scheme yielded the wavelength shift of the individual FBGs. The sensing locations were calibrated for curvature as a function of wavelength difference between the two FBGs at the same spatial location (see Fig. 3 for a typical example). Inspecting Fig. 3, it can be seen that the response of the sensor location is not the same for concave to convex bending; this may be due to the inaccuracies in the laying-up of the optical fiber into the uncured silicone. The sensing locations yielded an average spectral sensitivity to curvature of m with a curvature resolution of . The variation of the spectral sensitivities between sensors arises from the variabilities in the encapsulation process. The curvature resolution stems from the 5-pm resolution of the interrogator. 3.Reconstruction of the ShapeThe generation of the shape from the sensing array formed from the curvature sensors was achieved by using the algorithm described below. The interrogator is controlled by Labview software and the algorithm is written in Matlab, which can be embedded into Labview. The wavelengths are converted to curvatures. The distances between adjacent sensing locations are known within the encapsulated silicone, along with the total lengths of fiber between gratings in the sensing array; thus the arc lengths for each sensing location are known. Consider a single Rib (one horizontal arm, which consists of four sensors each composed of two FBGs; see Figs. 1 and 4). The total length, , is divided into four sections (, where , 2, 3, 4), with each containing a single sensor located in the centre. Each section is composed of 20 segments approximating an arc, the last segment being used to calculate the angle to the spine of the array to ensure a continuous curve (which prevents any abrupt change in gradient) between adjacent sensing sections (see Fig. 4). By combining all of the curvature values, coupled with the known spatial dimensions, we were able to generate the corresponding , , and coordinates of the sensor array and reconstruct the entire sensing array in real time in three-dimensional space with a positional accuracy determined in the curvature calibration process and translated into Euclidean space. With the sensing array reconstructed in three dimensions (Figs. 5Fig. 6Fig. 7–8) we were able to calculate the volume of the various sections of the system. The procedure consists of first generating a two-dimensional (2-D) mesh across the surface of the ribs, dynamically, by interpolating the points in between the sensing arms, both vertically and horizontally (see inset in Fig. 8). Using these data we were able to then select a region of interest and perform a 2-D surface integration over the section of the mesh, thus obtaining a temporally dependent volume for any given region of the array. Fig. 7Three-dimensonal sensing array representation (units: metres) obtained from the algorithm. Panel (a) is an elliptic cylinder with radius (adjacent to the spine) of 35.4 cm. Panel (b) is a sphere with a radius of 36 cm. 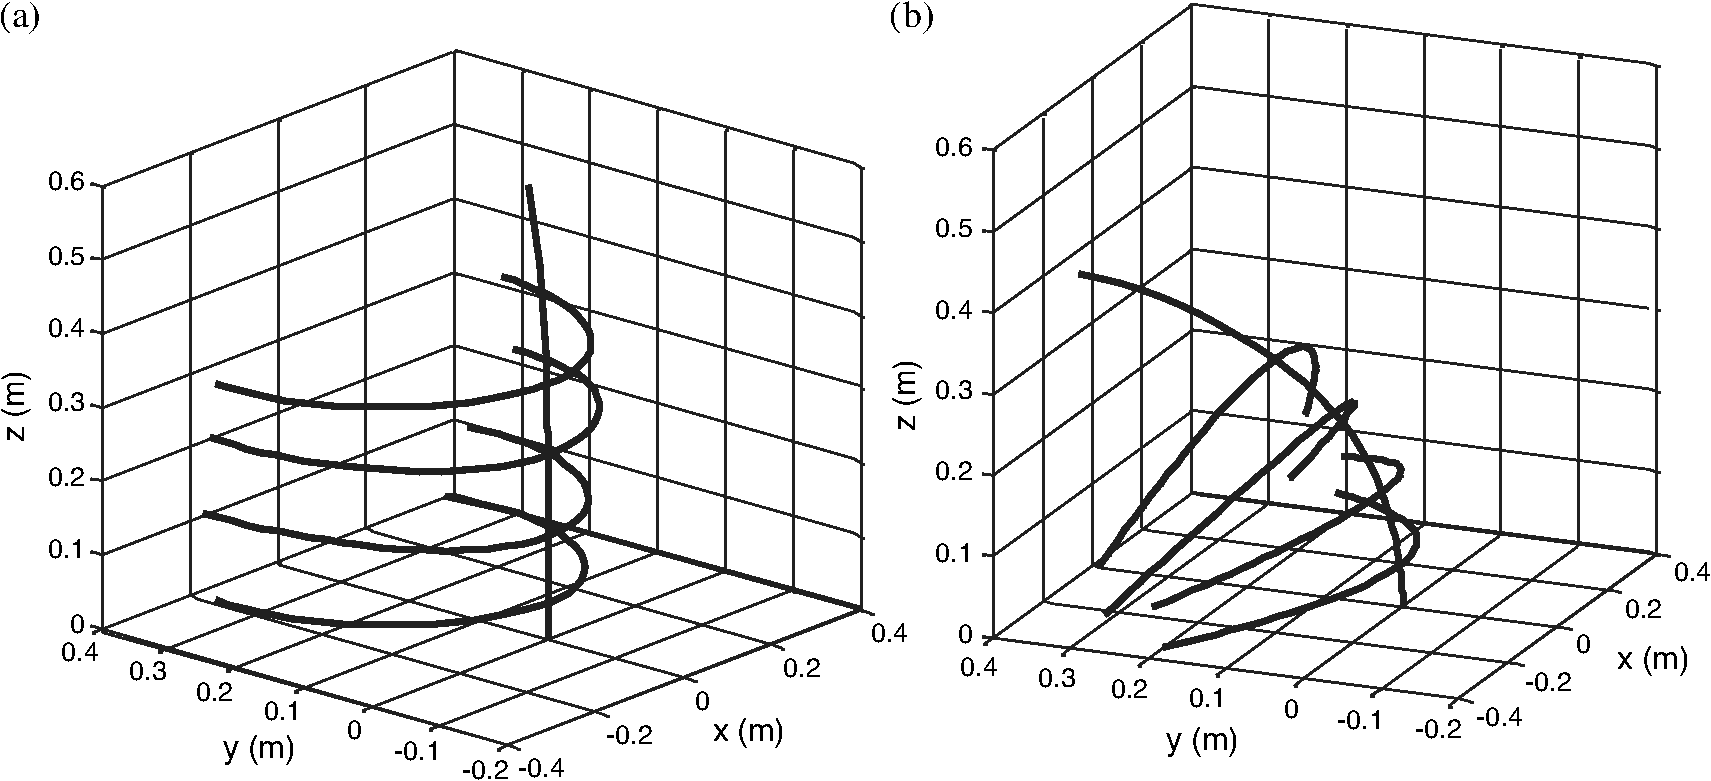 Fig. 8The estimated volumetric error for the shape-sensing scheme for known shapes and volumes (a) for elliptic cylinders, both major and minor elliptical axis are represented as (major, minor); (b) for spheres. Inset figure shows the reconstructed shape of an elliptical cylinder (dimensions 33.6, 31.5) and corresponding mesh generated, which is used to calculate the absolute volume.  The system can be broken into three parts: 1. the sensing array that detects shape changes, 2. the interrogator that monitors the changes of the individual sensing locations, and 3. the control and manipulation of the data (by modeling and control software) to generate the required information. An overview of the sensing scheme and the flow of information can be seen in Fig. 5. The system was evaluated by using known shapes and volumes and determining the error in the estimated volume of the shape. The shapes were chosen to evaluate the system with increasing dimensional difficulty. The first shape was a simple curvilinear surface (set to various constant curvatures), which presents a single dimensional degree of freedom. Secondly, elliptical cylinders were used, where the major and minor axes were varied, this being a second degree of freedom: two dimensions. The elliptical cylinder parameters a and b (see Fig. 6) both ranged from 29 to 35.4 cm. Third, we used varying diameters of known spheres, again increasing to three degrees of freedom (Fig. 6). The algorithm appeared to yield the correct shape of the object in contact with the shape-sensing array. The volume error for the algorithm was calculated for the known static shapes. The shape-sensing system yielded total errors ranging from 1% to 9% depending on the shapes being used (see Fig. 8). Note that the experimental error bars in Fig. 8 include both the statistical standard deviation from multiple trials (in the region of 100) for each object and static experimental and temporally dependent errors. The sources of errors include construction artifact in terms of FBGs not being perfectly aligned. Another error that is inherent in the design of the array is due to the fact that each sensor location contains two FBGs (which offer information on the curvature in a 2-D plane). Hence, any information regarding twisting is lost; this becomes more apparent when the spine is deformed, as we assumed the arms remain perpendicular to the spine of the array and assumptions were made in the reconstruction algorithm that all wavelength shifts are due to pure bending. Time-dependent fluctuation in the volumetric estimations was due to the cross-talk from wavelength shifts from adjacent FBG sensors. This cross-talk in wavelengths resulted in a small jitter in the curvature value at each sensing location. The shape-sensing scheme was analyzed to obtain a “figure of merit” based on quantitative analysis using two procedures, details of which have been provided elsewhere.23 The first approach made use of normalized cross-correlation functions for each dimension (, , ) that represent the object. This approach of using cross-correlation yielded an average over 0.95 for each dimension needed to describe the object. The second approach was based on a normalized vector dot-product. Calculating the product for each sensing point on the surface of the reconstructed shape and the known idealized shape yielded an average dot product of 97%. Furthermore, an in-depth analysis of the average deviation of the retrieved curvature radius from that of the known idealized shape showed that the overall shape determination is excellent. This can be seen from the measured average radius that ranged from 86% of the true value for the worst cases tested to 92% for the best. 4.Respiratory Function MonitoringAs mentioned previously, the specific application for this shape-sensing scheme is respiratory function monitoring and indeed plethysmography in general.11,12 The human torso is a good test for the system due to the fact that it is a varied and complex shape that changes as a function of time, due to breathing and postural variations. The sensing array was incorporated into a specifically designed Lycra vest where there are slots into which are inserted the sections of the silicone-encapsulated sensing array where the FBGs are situated (see Fig. 9). The “slot” positions are fixed on the vest, but there are two extra sets of slots for the rib section of the array, so it can be moved up or down 6 cm. The sensing array has been designed to investigate breathing patterns at various postures, the postures being monitored by the four vertical sensing locations along the spine. The first test of the sensing array is to observe the reproducibility of results for a given human posture and compare these results to the data collected from a spirometer. This was achieved by simultaneously monitoring the sensor array during rhythmic breathing and measuring the exhaled volumes at the mouth of the subject using an ultrasonic transduction system (model “easy on-pc,” ndd Medical Technologies Inc., Zurich, Switzerland24). Initially there were 10 separate monitoring runs using both the array and the spirometer. To ensure that the human subject maintains approximately the same posture for all initial tests the “spine” sensors were inspected and the spine results that were significantly different (defined as being greater than one standard deviation away from the average of the data) were eliminated from the test sample. Adopting this procedure resulted in eight tests being used from the initial 10. The authors acknowledge that using a selection procedure based upon a single standard deviation is not a commonly used method to exclude data. The authors are not sure how much the relative change in posture of the subject would affect the overall ability of the sensing scheme from test to test to detect the respiratory movement and provide the volume estimate. Observations from some preliminary results suggest that posture position of the human torso has a significant influence on regional variation of the shape and movement of the torso. The individual sensing locations (the fiber sensors) have slightly different responses to curvature due to deficiencies in the present fabrication procedures. This would affect the repeatability of the results from the sensing array and the sensing scheme. The variations in the spectral response of sensing locations with respect to curvature are due to slight variations in separation of the two FBGs and their positions within the encapsulating silicone. Thus only small variation is acceptable to obtain a first estimate of the performance of the system on human subjects. Note that the errors bars are the standard deviation in the curvature measured at the sensing locations during each trial. These small variations that are detected reflect the variations in the posture of the human test subject. Figure 10 shows examples of the variation of curvature at sensor locations and between trial runs due to postural differences. The circled data points in Fig. 10 show the runs excluded from the trials. Fig. 10The variations in curvature due to the changing posture of the human subject from trial to trial: Panel (a) is for sensor position and panel (b) is for sensor position obtained from Subject C in Table 1.  Table 1The variety of body types used with the shape-sensing vest.
For the selected trials, correlation values are obtained between the spirometer volume data and the estimated volume from the shape-sensing system. The mean Pearson correlation coefficient was 0.86 with a standard deviation of 0.03 (). Figure 11 shows an example of the volumes estimated from the sensing system compared to the volume measured with a spirometer at the same time. Fig. 11Typical example of normal rhythmic breathing, showing the measured volume change with time from the spirometer (dashed line) and the online real-time estimated volume from the curvature shape sensing scheme and the associated algorithms (solid line) obtained from Subject C in Table 1.  The flat line at around 7 s is a reference point for the two sets of data, where the subject wearing the sensing vest and using the spirometer holds his or her breath for 3 s. In this region there is a notable difference between the two sets of data. There are several reasons why this difference exists. First, it may be that the vest fabric is creeping on the subject, thus changing the volume estimate. Second, the variation may be a reaction of the muscles in the torso to holding one’s breath. Third, the sensing array shows good correlation to temporal behaviour of the volumes but the volumes are estimated by the sensing array; thus, the variation shown within the 3-s window may be actually much smaller than the volume estimation algorithm used in conjunction with the sensing array. Inspecting Fig. 11 and remembering that the spirometer measures the inhaled and exhaled volumes of air from the lungs while the sensing scheme measures the overall changes in volume of the torso, there are some inconsistencies between the two sets of results. Some of the inconsistencies may, as mentioned above, be due to vest fabric creeping on the subject and causing slippage of sensors in the vests. Secondly, these experimental discrepancies between the two methods may be real differences due to the fact that the sensing scheme measures volumetric changes in thorax and abdomen which also includes physical muscular changes. Thirdly, the same as above with either an over or under estimate of the volume generated by the volume estimation algorithm. As shown in Table 1, the sensing scheme was also used with a small group of subjects () possessing a large anatomical variation. The sensing vest was able to work with the various changes in shape and able to detect the respiratory movement of the torso. These preliminary trials were conducted on volunteers who were all men. While we have not yet carried out trials with women, the versatility of this approach has been shown. The volumetric statistics for each human subject are shown in Table 2, with maximum and minimum measured volumes of 31.8 and 13.6 l, respectively. This sample group range in body mass index from 17.9 to 32.7, which covers most of the range of anthropometry data found elsewhere for North American or Western European subjects.25 The sensing system will probably need to be adapted to allow for differences in the chest shape of women. Sensors above the breasts may reveal important changes in chest movement, but sensors on the under surface of the breast would be less likely to be helpful. These aspects will be tested in subsequent studies. Testing was performed on all subjects without the loss of signals from any sensors, showing the large range of curvatures that can be accommodated, which is an improvement upon earlier work (see Fig. 12).16 The old LPG sensing scheme16 had individual sensor failure rate of approximately 30% for any particular test subject when tested on a range of sizes of human subjects. The failure symptoms included curvatures out of the device measurement range and large amounts of noise, perhaps caused by buckling. In the present FBG sensing scheme none of the sensing elements failed for all the test subjects with typical curvature ranging from to , as opposed to typical ranges of 0 to for the LPG sensing scheme.16 Another major advantage of the current scheme over the old LPG scheme is that only one calibration procedure is need for the sensor array, and then this can be applied to all subjects, whereas the LPG scheme needed a calibration for each subject, using a linear regression technique. Fig. 12Examples of the versatility of the sensing scheme to monitor shape change and provide a real-time estimate of volumetric changes of the torso during normal rhythmic breathing for different anatomical shapes of subjects. Panels (a) and (b) show these changes for subject D, and panels (c) and (d) show the changes for subject B.  Table 2Typical estimated volumetric data from experimental data obtained from the shape-sensing vest.
Note that the associated experimental error for the volume measurements is ±0.1 l. While the authors understand that this is a small test group, it can be seen that there is a large diversity in the shape of the subjects, making this group an appropriate sample to test the system’s versatility. The two subjects chosen to illustrate the large diversity have a difference of the torso volume of approximately 5.3 l (Table 2). Figure 12 shows another example of the size range of subjects on which a single system is capable of providing meaningful data. Figure 12(a) and 12(c) shows the shape variation recorded with the sensing scheme, and the estimated temporal volume variations for each subject is shown in Fig. 12(b) and 12(d). The system should be compared to other researchers’ proposed and demonstrated schemes that are based upon magnetometry26 and inductive sensors.27 This is not an easy task due to the fact that their systems are used in conjunction with chest models constructed by other researchers,11,28 while in our case no model is assumed due to the fact that our system provides direct detection of the variations in the regional shape change of the torso during breathing. The system presented here can also monitor various regions of the torso’s shape and absolute volume change. Consideration of the physical size and weight of our detection scheme can be separated into two parts. First, the interrogation unit is a commercially available system by Moog Insensys Ltd, which is approximately with a weight of 2 kg. There is now a smaller version of the interrogator with the size reduced to approximately , which could be placed on a belt around the waist with a wireless connection for data transfer and storage; this reduction in size would not change the performance of the interrogator or the sensors. Second, the sensing garment is lightweight and has little bulk. The size of the interrogation system is comparable to, if not smaller than, other systems that have been reported.26,27 The authors acknowledge that this prototype is too bulky to be considered suitable for an individual to carry. The new miniature interrogator will make the sensing scheme truly portable for the individual for everyday activities and sports and enable unobtrusive ambulatory monitoring of breathing. The sensing garment reported here has 20 sensing locations over the thoracic and abdominal regions of the torso that directly yield regional variation in shape change during breathing [see Fig. 12(a) and 12(c)]. This is an advantage over the existing magnetometry and inductive sensor systems26,27 that can only detect motion in three locations on the torso. The sensing scheme presented here also has a greater number of sensors than the previous LPG scheme,16 which has nine sensors over the same region of the torso. The sensing scheme calibration with known shapes and volumes yielded a volumetric error of 6%. Due to the fact that the spirometer measures the inhaled and exhaled volumes of the lungs and the system presented here measures total volumetric change of the torso, it is difficult to estimate the error of the system on human test subjects. An error can be estimated based upon normalization of both sets of data after the reference feature that starts at approximately 7 s and finishes at 10 s; this yields an average volumetric error percentage of 4% with a maximum observed error of 15% and a correlation of 0.86. These error numbers compare well against reported studies of other portable systems, such as the magnetometry and inductive sensor systems26,27 that yielded errors of 10% and 16%, respectively. The authors realize this is not a direct comparison, due to the fact that our data needed to be normalized, but nevertheless the results are promising. 5.ConclusionAn array of 40 FBGs has been used to generate 20 curvature sensors on a vest to produce a real-time, three-dimensional shape-sensing scheme that has been used to monitor the thoracic and abdominal movements of a human during respiration. These results have been used to obtain the absolute volumetric changes of the human torso with an estimated 6% average volume error with a known shape and volume. This sensing system yields an average volumetric error percentage of 4% with a maximum observed error of 15% and a correlation of 0.86 when directly compared to a spirometer. This compares reasonably well with the 5% that is the accepted volume error in medicine.29 This estimated average volume error is very much dependent upon the volume of the shape being measured and the shape itself23 (see Fig. 8). The major drawback of the present system is the data acquisition and interrogation rate of the sensing array, which at 12 Hz may not allow volumetric details of transient breathing patterns to be completely detected. A new interrogator is being designed to operate at 20 Hz for this size of array. A series of trials ( per session for a single human subject) with a spirometer used simultaneously to record the inspired and expired volume at the mouth showed a direct correlation between the two measurements. The mean Pearson correlation coefficient was 0.86 with a standard deviation of 0.03 (). The sensing vest was also used on a group of five human males with differing body dimensions and with marked variation in body shape (representing a significant proportion of the anthropometry data range for North Americans or Western Europeans).25 The vest functioned well and successfully monitored all subjects. The regional volume changes are obtained in real time from the system presented here. Respiratory medical practice has many potential applications for a vest that can sense thoracic and abdominal movement and from this derive an accurate output of ventilation with respect to time. Spirometers require mouthpieces for the subject to use, which can affect the resting ventilatory state and so potentially corrupt the diagnostic accuracy of the technique. The sensing scheme presented here requires no mouthpiece, thus negating this potential problem. Currently, inductance plethysmography has limitations either by being unable to detect regional changes of volume in the thorax or by not being small and portable30 and hence not being suitable for ambulatory monitoring. Our sensing system has the potential to be made smaller and portable, thus enabling unobtrusive ambulatory monitoring of human breathing. AcknowledgmentsRanjeet S. Bhamber and J. D. Ania Castañón thank the financial support of Ministerio de Ciencia e Innovación (MICINN) through grants TEC2008-05791 and TEC2011-27314. Thomas Allsop thanks Heather Parkinson of Market-Stitch in Grimsby for her help in constructing the respiratory vest and Umeco Process Material Ltd [formerly Richmond Aerovac systems (UK) Ltd] for their continuing assistance and help with the project, with noted special thanks to the Process Engineer Michael Halliday and Technician Eric Wakeford. ReferencesM. A. Davisyet al.,
“Shape and vibration mode sensing using a fiber optic Bragg grating array,”
Smart Mater. Struct., 5
(6), 759
–765
(1996). http://dx.doi.org/10.1088/0964-1726/5/6/005 SMSTER 0964-1726 Google Scholar
L. DanischK. EnglehartA. Trivett,
“Spatially continuous six degree of freedom position and orientation sensor,”
Sensor Review, 19
(2), 106
–112
(1999). http://dx.doi.org/10.1108/02602289910266142 SNRVDY 0260-2288 Google Scholar
L. Yuanet al.,
“Three-core fiber-based shape-sensing application,”
Optic. Lett., 33
(6), 578
–580
(2008). http://dx.doi.org/10.1364/OL.33.000578 OPLEDP 0146-9592 Google Scholar
W. Yinet al.,
“Structural shape sensing for variable camber wing using FBG Sensors,”
Proc. SPIE, 7292 72921H
(2009). http://dx.doi.org/10.1117/12.812484 PSISDG 0277-786X Google Scholar
R. G. Duncanet al.,
“High-accuracy fiber-optic shape sensing,”
Proc. SPIE, 6530 65301S
(2007). http://dx.doi.org/10.1117/12.720914 PSISDG 0277-786X Google Scholar
J. M. Croomet al.,
“Visual sensing of continuum robot shape using self-organizing maps,”
in IEEE Conf. Robotics and Automation, I. R. C. A.,
4591
–4596
(2010). Google Scholar
H. J. Patrick,
“Self-aligning, bipolar bend transducer based on long period grating written in eccentric core fibre,”
Electron. Lett., 36
(21), 1763
–1764
(2000). http://dx.doi.org/10.1049/el:20001270 ELLEAK 0013-5194 Google Scholar
G. Wehrleet al.,
“A fibre optic Bragg grating strain sensor for monitoring ventilatory movements,”
Meas. Sci. Technol., 12
(7), 805
–809
(2001). http://dx.doi.org/10.1088/0957-0233/12/7/309 MSTCEP 0957-0233 Google Scholar
L. T. D’Angeloet al.,
“A system for respiratory motion detection using optical fibers embedded into textiles,”
in IEEE EMBS Conf. Process.,
3694
–3697
(2008). Google Scholar
J. Wittet al.,
“Medical textiles with embedded fiber optic sensors for monitoring of respiratory movement,”
IEEE Sensor. J., 12
(1), 246
–254
(2012). http://dx.doi.org/10.1109/JSEN.2011.2158416 ISJEAZ 1530-437X Google Scholar
K. KonnoJ. Meadet al.,
“Measurement of the separate volume changes of the rib cage and abdomen during breathing,”
J. Appl. Physiol., 22
(3), 407
–422
(1967). JAPYAA 0021-8987 Google Scholar
H. Watson,
“The technology of respiratory inductance plethysmography,”
in Proceedings of the 3rd International Symposium on Ambulatory Monitoring, ISAM 1979,
537
–563
(1980). Google Scholar
G. H. SkrepnekS. V. Skrepnek,
“Epidemiology, clinical and economic burden, and natural history of chronic obstructive pulmonary disease and asthma,”
Am J. Manag. Care, 10
(5), S129
–S138
(2004). Google Scholar
J. M. Rommenset al.,
“Identification of the cystic fibrosis gene: chromosome walking and jumping,”
Science, 245
(4922), 1059
–1065
(1989). http://dx.doi.org/10.1126/science.2772657 SCIEAS 0036-8075 Google Scholar
T. Allsopet al.,
“Embedded progressive-three-layered fibre long-period gratings for respiratory monitoring,”
J. Biomed. Opt., 8
(3), 552
–558
(2003). http://dx.doi.org/10.1117/1.1578497 JBOPFO 1083-3668 Google Scholar
T. Allsopet al.,
“The application of a long period grating sensors to human respiratory plethysmography,”
J. Biomed. Opt., 12
(6), 064003
(2007). http://dx.doi.org/10.1117/1.2821198 JBOPFO 1083-3668 Google Scholar
S. J. Calaet al.,
“Chest wall and lung volume estimation by optical reflectance motion analysis,”
J. Appl. Physiol., 81
(6), 2680
–2689
(1996). JAPYAA 0021-8987 Google Scholar
S. Levineet al.,
“Use of triaxial magnetometer for respiratory measurements,”
J. Appl. Physiol., 70
(5), 2311
–2321
(1991). JAPYAA 0021-8987 Google Scholar
R. B. Banzettet al.,
“A simple reliable method to calibrate magnetometers and respitrace,”
J. Appl. Physiol., 79
(6), 2169
–2176
(1995). JAPYAA 0021-8987 Google Scholar
T. EarthrowlB. JonesM. R. Miller,
“Chest and abdominal surface motion measurement for continuous monitoring of respiratory function,”
Proc. ImechE, Part H, Eng. med., 215
(5), 515
–520
(2001). http://dx.doi.org/10.1243/0954411011536028 PIHMEQ 0954-4119 Google Scholar
C-C. Yeet al.,
“Bend sensing in structures using long-period fibre gratings,”
in 5th European Conf. on Smart Structure and Materials,
311
–315
(2000). Google Scholar
G. D. Lloydet al.,
“Resonant cavity time-division-multiplexed fiber Bragg grating sensor interrogator,”
IEEE Photon. Technol. Lett., 16
(10), 2323
–2325
(2004). http://dx.doi.org/10.1109/LPT.2004.834849 IPTLEL 1041-1135 Google Scholar
R. Bhamberet al.,
“Arbitrary real-time three dimensional corporal object sensing and reconstruction,”
Opt. Lett., 37
(17), 3549
–3551
(2012). http://dx.doi.org/10.1364/OL.37.003549 OPLEDP 0146-9592 Google Scholar
K. M. Flegalet al.,
“Comparisons of percentage body fat, body mass index, waist circumference, and waist-stature ratio in adults1–3,”
Am. J. Clin. Nutr., 89
(2), 500
–508
(2009). http://dx.doi.org/10.3945/ajcn.2008.26847 AJCNAC 0002-9165 Google Scholar
F. D. McCoolet al.,
“Tidal volume and respiratory timing derived from a portable ventilation monitor,”
Chest, 122
(2), 684
–691
(2002). http://dx.doi.org/10.1378/chest.122.2.684 CHETBF 0012-3692 Google Scholar
C. F. Clarenbachet al.,
“Monitoring of ventilation during exercise by a portable respiratory inductive plethysmograph,”
Chest, 128
(3), 1282
–1290
(2005). http://dx.doi.org/10.1378/chest.128.3.1282 CHETBF 0012-3692 Google Scholar
J. C. SmithJ. Mead,
“Three degree of freedom description of movement of the human chest wall,”
J. Appl. Physiol., 60
(3), 928
–934
(1986). JAPYAA 0021-8987 Google Scholar
A. L. Coateset al.,
“Measurement of lung volumes by plethysmography,”
Eur. Respir. J., 10
(6), 1415
–1427
(1997). http://dx.doi.org/10.1183/09031936.97.10061415 ERJOEI 0903-1936 Google Scholar
A. Alvertiet al.,
“Optoelectronic plethysmography in intensive care patients,”
Am J. Respir. Crit. Care Med., 161
(5), 1546
–1552
(2000). AJCMED 1073-449X Google Scholar
|


