
|
|
1.IntroductionLung cancer is the leading cause of cancer-related mortality worldwide, with nearly 1.4 million deaths each year.1–3 Lung cancer is diagnosed at an advanced stage in a majority of patients, which is the primary reason behind the high mortality rate associated with this disease. Early detection continues to be an elusive goal, and substantial numbers of patients diagnosed with localized disease are often unsuitable for curative surgical procedures due to concomitant medical illness. Non-small cell lung cancer (NSCLC), which includes adenocarcinoma, squamous cell carcinoma, large cell carcinoma, and bronchioloalveolar carcinoma, accounts for nearly 85% of all cases of lung cancer.2,3 Cigarette smoking is the most common etiological factor, accounting for nearly 85% of patients with lung cancer.2,3 White light reflectance (WLR) color imaging endoscopy is the standard for clinical detection and localization of lung cancer. However, it suffers from poor sensitivity for early cancer detection. The diagnostic sensitivity of WLR imaging for early lung cancer is only about 9%.4 Preinvasive lesions such as carcinoma in situ (CIS) and moderate or severe dysplasia are only a few cell layers thick and may not show enough morphological changes or color variations detectable by a WLR image. As a scattering medium, tissue shows optical effects that are characteristic of turbid physical systems.5 Much of the light scattering in biological tissues is due to variations in polarizability, which can be characterized by variations in the index of refraction. In addition, the shape, size, and distribution of tissue constituents play an important role in the overall scattering properties of tissue.6 The refractive index mismatch of biological tissue components as a highly scattering medium has a strong influence on optical transmittance and reflectance, as well as on polarization and coherence of the scattered light.7 Light-based therapeutic and diagnostic techniques could be improved if scattering within tissue were temporarily reduced. Laser surgery and therapy would benefit from the increased depth of penetration. Imaging modalities, such as fluorescence microscopy, confocal imaging, and optical coherence tomography (OCT), would also benefit from an increased penetration depth.6 It is well known that the turbidity of a dispersive physical system can be effectively controlled using an immersion effect (matching the refractive indices of scatterers and the base material) as well as by changes in the size of scatterers and their packing (the volumetric arrangement affects the spatial correlation of the scatterers).5 The optical (scattering) properties of living tissue can be controlled by using various physical and chemical reactions such as compression, stretching, dehydration, coagulation, ultraviolet (UV) irradiation, low-temperature application (reversible cold cataract), and addition of chemicals.5,8–13 Several recent studies have demonstrated that sonophoretic (SP) delivery, as a noninvasive physical method, exhibited an enhanced tissue-clearing effect when applied topically with optical clearing agents (OCAs).14–17 The significant ultrasound-induced enhancement in OCT imaging depth and contrast of in vitro porcine skin and in vivo human skin was found.18,19 Several imaging techniques have been used to study the permeation of analytes in biological tissues,20 including ultrasound,21 magnetic resonance imaging (MRI),22 optical projection tomography (OPT),23 and OCT.24–28 OCT is particularly attractive because it is a nondestructive, noninvasive technique that provides high-resolution, real-time images of biological tissues. OCT has been used extensively in tissue studies24–28 to measure permeation of different molecules and materials through various epithelial tissues, such as rabbit sclera,25 monkey skin,26 rabbit cornea,27 porcine aorta,26,28 human skin,29 and human esophagus.30 Ultrasound-mediated bioeffects are generally believed to be caused by cavitation.31 Acoustic cavitation involves the creation and oscillation of gas bubbles in a liquid.32 Cavitation bubbles may exhibit sustained growth and oscillations over several acoustic cycles (stable cavitation) or violent growth and collapse in less than a cycle (transient or inertial cavitation).32 Potentially, both stable and transient cavitation may induce membrane permeabilization.33 A large number of studies have reported on the SP delivery of small molecules through the skin in transdermal drug delivery (TDD).34 It represents a useful noninvasive physical method to enhance epidermal permeability. In spite of the wide use of SP delivery in TDD, there are few studies to develop SP delivery for the effects of glucose permeability of normal, benign, and cancerous human lung tissues. The objectives of our study were to evaluate the effects of glucose mediated with ultrasound on permeability of normal, benign, and cancerous human lung tissue, to monitor and quantify the differences in permeability coefficients of ultrasound-OCAs combination in human normal lung (NL), lung benign granulomatosis (LBG), lung adenocarcinoma tumor (LAT), and lung squamous cell carcinoma (LSCC) tissue in vitro by the Fourier-domain optical coherence tomography (FD-OCT). 2.Materials and Methods2.1.Tissue PreparationA total of 48 samples of surgically resected human lung tissues were obtained from patients whose consents were obtained for the study at the First Affiliated Hospital of Sun Yat-Sen University. The samples were divided into four groups according to histological diagnosis: NL tissue (12 samples), LBG tissue (12 samples), LSCC tissue (12 samples), and LAT tissue (12 samples). Each removed tissue section was stored in 0.9% sodium chloride solution as soon as possible after the resection and then placed on ice and transported to the laboratory for performing measurements. They were stored at until the measurement in vitro. Each tissue was cut into an approximately piece and placed into physiological saline solution for each OCT measurement. 2.2.OCT SystemThe experiments were performed by using an FD-OCT system. It is made by Shenzhen MOPTIM Imaging Technique Co., Ltd., China. A schematic of the OCT system was shown in the literature.35 The optical source used in this system is a low-coherence broadband superluminescent diode with a wavelength of and an output power of 5 mW. The FD-OCT system provides an axial resolution of 12 μm and a transverse resolution of 15 μm in free space, determined by the focal spot size of the probe beam. The signal-to-noise ratio of the OCT system is measured to be 120 dB. 2-D images are obtained by scanning the incident beam over the sample surface in the lateral direction and in-depth (A-scan) scanning by the interferometer. The acquisition time per OCT image is about 180 ms, corresponding to an A-scan frequency of 2000 Hz. A computer is used to control the OCT system with a data acquisition software written in LabVIEW 7.2-D. OCT images obtained in the experiment were stored in the computer for further processing. 2.3.Ultrasound and Glucose ApplicationA DM-F608 sonicator with a 3-cm-diameter probe (Dimyth Beauty Equipment Manufacture, Guangzhou, China) was used for ultrasound application. The ultrasound frequency and intensity were 1 to 1.1 MHz and , respectively. Sonicators with the frequency are most commonly used in cosmetic treatments and TDD. Glucose was purchased from the Tianjin Damao Chemical Reagent Factory (Tianjin, China). The concentration of the glucose solutions used in this study was 30% () glucose solution. Solution of 30% () glucose was applied to the surface of each tissue of four different lung tissue types, and ultrasound were simultaneously performed on these samples for a period of 15 min, respectively. After 15 min of ultrasound treatment, a small amount of 30% glucose solution was discontinuously added to the surface of the samples for a total 120 min at a time interval of 30 min, respectively. At 0 min, these lung samples treated with glucose/SP are native. For the first 15 min of treatment, the samples with glucose/SP were applied with the ultrasound, while the samples of four different control groups were only applied with glucose for the whole 120 min. During the ultrasound treatment, the ultrasound probe was immersed in 30% glucose solution that was topically applied to the surface of tissue. 2.4.OCT MeasurementsOCT images were continuously acquired from each lung sample for about 120 min. Right before the OCT experiments, the tissues were left under room temperature for 30 min. The lung sections were kept moist by phosphate-buffered saline to avoid dehydration and the optical probe was never in contact with the sample during the scanning process. The position of the probe beam on the scanned tissue was monitored using a visible light guiding beam. The selected region of the samples was imaged for about 8 to 10 min before the addition of 30% glucose/SP to record a baseline, and then 30% glucose/SP was applied to the surface of lung specimens for a period of 15 min. The solutions were removed prior to OCT imaging. Every 30 min during the measurement, glucose solution was applied again on the tissue for 5 min. Then the OCT imaging was continuously monitored for about 2 h, and the room temperature was maintained at 22°C throughout the entire experiment. No tissues were used in more than one experiment. 2.5.Data ProcessingIn this study, OCT images obtained from lung tissue were processed using an original program developed in the MATLAB program to obtain the OCT signal and calculate the OCT signal slope (OCTSS). The OCTSS method has already been explained in detail in Refs. 24 to 30. The design of the system has been described by us previously.29,30,36 With the OCTSS method, the mean permeability coefficient of a specific region in the lung tissue was calculated by analyzing the slope changes in the OCT signal caused by 30% glucose/SP. 2-D OCT images were averaged laterally (approximately over 1 mm, which was enough for speckle noise suppression), and a single 1-D curve was produced that represented the measurement of the OCT signal in the sample on a logarithmic scale. As noise is inevitable in the measurement, a best-fit exponential curve is applied to the averaged 1-D OCT signal profile of each group. A region in the 1-D OCT signal was chosen where the signal was linear and underwent minimal alterations, and its thickness was measured. Slopes of five consecutive OCT signals were averaged in this paper, normalized and plotted as a function of time. The local increase of glucose concentration in the chosen region caused the scattering coefficient to decrease, which was clearly reflected in the OCTSS graph.37 The time was calculated by measuring from the point where the OCTSS started to decrease to the point at which a change in the slope of the OCT signal indicated that the diffusion had ended and the reverse process began to take place. An increase of the local glucose concentration induced a decrease of the OCT signal slope. The reverse process, designated by the positive slope change, is thought to have stemmed from the difference in the concentration gradients on both sides of the tissue causing the fluid to travel from the region of higher concentration to the lower one water reentering the tissue after diffusing out due to the application of glucose. The permeability coefficient was then calculated by dividing the thickness of the region selected by the time it took for glucose to diffuse through in Eq. (1):24–30,38 3.Results and DiscussionIn this investigation, the main purpose of this pilot study was to evaluate the effects of ultrasound-mediated glucose on permeability of normal, benign, and cancerous human lung tissues, to monitor and quantify the differences in permeability coefficients of ultrasound-OCAs combination in four different kinds of lung tissue by the FD-OCT, and to find a more effective ultrasound-OCAs combination method to distinguish normal and diseased human lung tissues than pure OCAs. The OCTSS of four kinds of lung tissue were calculated from the 80 μm region at a tissue depth of approximately 230 μm from the tissue surface. The OCTSS graphs were analyzed to obtain the permeability coefficients. First, the lung tissue was imaged for about 10 min to record the OCTSS base line as a control OCTSS with no glucose/SP added. During this time, the time series of OCTSS fluctuation was induced by the sample (NL, LBG, LAT, and LSCC tissue) scanning as shown in Figs. 1, 2, 3, and 4. After the 10 min period, 30% glucose/SP was topically applied to the OCT scanning area where imaging continued for another 2 h. Figure 1 displays a typical OCTSS graph as a function of time for NL tissue with the topical application of 30% glucose/SP. Diffusion of ultrasound-mediated glucose solution inside the lung tissues dynamically changed the local scattering coefficient and it was detected by the OCT system. The OCTSS decreased due to the reduction of scattering inside the tissue caused by the local increase of glucose concentration, and decrease of water content in the interstitial space due to osmotic action of glucose.24,25,27 The increase in slope at the end of the graph is thought to be the reverse process. Water starts to diffuse into the tissue due to the difference in concentration created by the increase of glucose concentration. Fig. 1OCT signal slope as a function of time recorded from NL tissue treatment with 30% glucose and ultrasound. 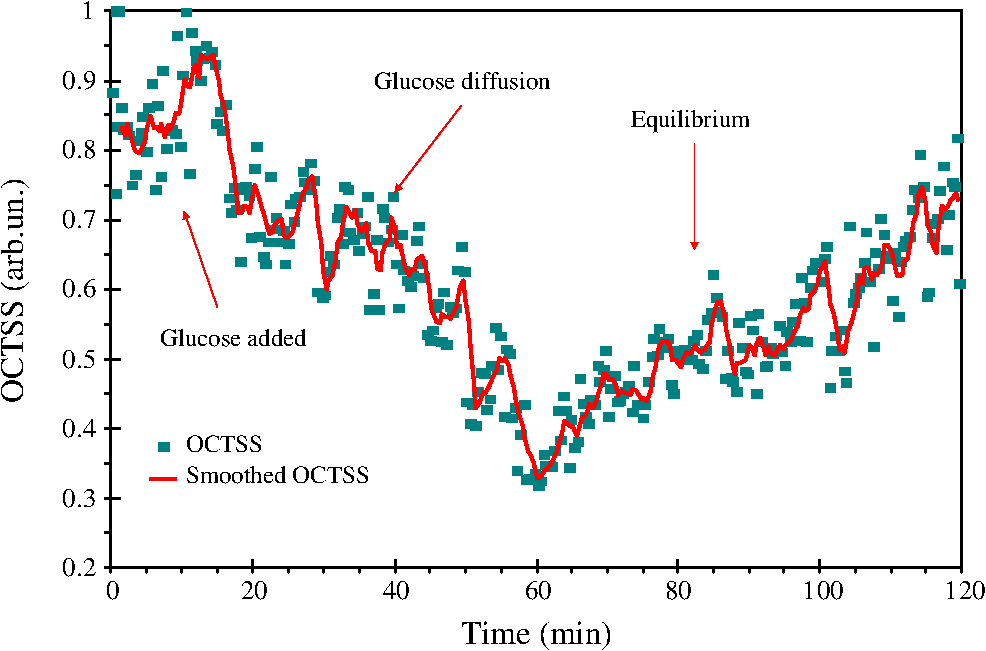 Fig. 2OCT signal slope as a function of time recorded from LBG tissue treatment with 30% glucose and ultrasound.  Fig. 3OCT signal slope as a function of time recorded from LAT tissue treatment with 30% glucose and ultrasound.  Fig. 4OCT signal slope as a function of time recorded from LSCC tissue treatment with 30% glucose and ultrasound.  In Fig. 1, the diffusion of glucose solution at NL tissue took approximately 52 min to reach an equilibrium state. A smoothed time-signal was obtained by adjacent averaging every five points. The mean permeability coefficient of 30% glucose/SP in NL tissue was measured in 12 independent experiments, which was estimated to be cm/s. Similarly, Figs. 2, 3, and 4 show the OCTSS graphs as a function of time for LBG, LAT, and LSCC tissue with the topical application of 30% glucose/SP, respectively. The changing trends in the OCTSS of LBG, LAT, and LSCC tissue are also similar to that of NL tissues. In Figs. 2, 3, and 4, the diffusion of glucose solution at LBG, LAT, and LSCC tissue took approximately 40, 37, and 31 min to reach an equilibrium state, respectively. Their mean permeability coefficients of 30% glucose/SP were , , and , respectively. Figure 5 represents the comparison of permeability coefficients for four different types of lung tissues with the topical application of 30% glucose/SP in vitro. The results shown in Fig. 5 illustrate that the permeability coefficients of 30% glucose/SP increase approximately 36.8%, 125.4%, and 189.1% for the LBG, LAT, and LSCC tissue compared with that for the NL tissue, respectively. There were statistically significant differences in permeability coefficients of 30% glucose/SP between LBG and NL tissue (), between LAT and NL tissue (), and between LSCC and NL tissue (). Fig. 5Comparing permeability coefficients of 30% glucose/SP diffusion in NL, LBG, LAT, and LSCC tissue in vitro.  In our previous studies35 the mean permeability coefficients have been reported for pure 30% glucose solution in human NL, LBG, LAT, and LSCC tissue in vitro. Comparison of the results of the current study with our previous studies35 shows a significant increase in the permeability coefficients of 30% glucose/SP compared with that of pure 30% glucose in the NL, LBG, LAT, and LSCC tissue in vitro, respectively. Their increments are 48.9%, 54.5%, 57.3%, and 64.6%, respectively. This phenomenon is consistent with our previous findings that ultrasound caused the increase in permeability of normal breast and breast cancer tissue17 and that ultrasound caused the increase of cell membrane permeability in TDD.39–42 The studies have demonstrated the ultrasound-induced tissue optical clearing enhancement with topical application of 30% glucose on in vitro normal, benign, and malignant human lung. Moreover, their optical clearing effects are significantly different. In the last decade, many studies analyzed the relationship between tissue composition, microstructure, and macrophysiology, showing that the lung’s physiological behavior reflects both the mechanical properties of tissue individual components and its complex structural organization. Different lung pathologies can affect the extracellular matrix (ECM).43 For example, the increased deposition of ECM proteins and fibroblasts in the stroma surrounding the epithelial cells of the breast is the leading risk factor for breast carcinoma (which accounts for 30% of breast cancer).44 This and many other diseases might potentially be diagnosed by comparing the permeability rates of several therapeutic or diagnostic agents in normal and abnormal tissues.26 Therefore, precise assessment of the diffusion processes in normal and abnormal tissues with OCT might provide a truly noninvasive way for evaluation of tissue health.28 As yet, however, no published reports have demonstrated the capability of the OCT technique for quantifying the permeability coefficients of the ultrasound-OCAs combination in normal, benign, and malignant human lung tissue. Our experiment is the first reported investigation of ultrasound-mediated glucose diffusion in normal, benign, and malignant human lung tissue. In our pilot experiments, the ultrasound was selected to enhance the glucose diffusion due to several reasons. First, the technique is noninvasive. Second, no insertion or surgery is needed, and acoustic transducers are placed in contact with the mixed solution that is spread on the tissue. Third, the method is extremely simple to implement (sonicators have been used in beauty parlors and clinics). Additionally, the cost is low. Ultrasound has demonstrated an enhanced transdermal mass transport effect when applied topically in TDD. Its mechanism is believed to be through acoustic cavitation, which is the formation and collapse of gaseous cavities, and has the dominant role in sonophoresis.45,46 Based on the aforementioned results, it indicated that due to the ultrasound penetration enhancing and convection effect, more glucose can penetrate the lung tissue and glucose can penetrate more quickly to achieve more refractive index matching in human lung tissue in vitro to improve lung tissue optical clearing. 4.ConclusionsOur results demonstrate that simultaneous application of ultrasound and glucose led to a marked increase in the permeability coefficients for four different types of lung tissues in vitro. The permeability coefficients of 30% glucose/SP increase approximately 36.8%, 125.4%, and 189.1% for the LBG, LAT, and LSCC tissue compared with that for the NL tissue, respectively. The coadministration of OCAs diffusion under ultrasound-assistance is a more effective approach in using OCT imaging to diagnose normal, benign, and cancerous human lung tissues than that of pure OCAs.35 AcknowledgmentsThis work was supported by the National Natural Science Foundation of China (Grant Nos. 60778047 and 61275187), Specialized Research Fund for the Doctoral Program of Higher Education of China (Grant No. 20114407110001), the Natural Science Foundation of Guangdong Province of China (Grant Nos. 06025080 and 9251063101000009), the Key Science and Technology Project of Guangdong Province of China (Grant Nos. 2005B50101015 and 2008B090500125), the Key Science and Technology Project of Guangzhou City of China (Grant No. 2008Z1-D391), and Key Laboratory of Optoelectronic Science and Technology for Medicine (Fujian Normal University), Ministry of Education, China (Grant No. JYG1202). ReferencesA. Jemalet al.,
“Global patterns of cancer incidence and mortality rates and trends,”
Cancer Epidemiol. Biomarkers Prev., 19
(8), 1893
–1907
(2010). http://dx.doi.org/10.1158/1055-9965.EPI-10-0437 CEBPE4 1055-9965 Google Scholar
S. S. RamalingamT. K. OwonikokoF. R. Khuri,
“Lung cancer: new biological insights and recent therapeutic advances,”
CA Cancer J. Clin., 61
(2), 91
–112
(2011). http://dx.doi.org/10.3322/caac.v61:2 CAMCAM 0007-9235 Google Scholar
A. HurriaM. G. Kris,
“Management of lung cancer in older adults,”
CA Cancer J. Clin., 53
(6), 325
–341
(2003). http://dx.doi.org/10.3322/canjclin.53.6.325 CAMCAM 0007-9235 Google Scholar
S. Lamet al.,
“Localization of bronchial intraepithelial neoplastic lesions by fluorescence bronchoscopy,”
Chest, 113
(3), 696
–702
(1998). http://dx.doi.org/10.1378/chest.113.3.696 CHETBF 0012-3692 Google Scholar
V. V. Tuchinet al.,
“Light propagation in tissues with controlled optical properties,”
J. Biomed. Opt., 2
(4), 401
–417
(1997). http://dx.doi.org/10.1117/12.281502 JBOPFO 1083-3668 Google Scholar
G. Vargaset al.,
“Use of an agent to reduce scattering in skin,”
Lasers Surg. Med., 24
(2), 133
–141
(1999). http://dx.doi.org/10.1002/(ISSN)1096-9101 LSMEDI 0196-8092 Google Scholar
V. V. Tuchin,
“Optical immersion as a new tool for controlling the optical properties of tissues and blood,”
Laser Phys., 15
(8), 1109
–1136
(2005). LAPHEJ 1054-660X Google Scholar
V. V. Tuchin,
“Laser light scattering in biomedical diagnostics and therapy,”
J. Laser Appl., 5
(2–3), 43
–60
(1993). http://dx.doi.org/10.2351/1.4745330 JLAPEN 1042-346X Google Scholar
B. Chanceet al.,
“Effects of solutes on optical properties of biological materials: models, cells, and tissues,”
Anal. Biochem., 227
(2), 351
–362
(1995). http://dx.doi.org/10.1006/abio.1995.1291 ANBCA2 0003-2697 Google Scholar
H. Liuet al.,
“Dependence of tissue optical properties on solute-induced changes in refractive index and osmolarity,”
J. Biomed. Opt., 1
(2), 200
–211
(1996). http://dx.doi.org/10.1117/12.231370 JBOPFO 1083-3668 Google Scholar
V. V. Tuchinet al.,
“Optical and osmotic properties of human sclera,”
Proc. SPIE, 2979 658
–675
(1997). http://dx.doi.org/10.1117/12.280302 PSISDG 0277-786X Google Scholar
J. S. Maieret al.,
“Possible correlation between blood glucose concentration and the reduced scattering coefficient of tissues in the near infrared,”
Opt. Lett., 19
(24), 2062
–2064
(1994). http://dx.doi.org/10.1364/OL.19.002062 OPLEDP 0146-9592 Google Scholar
M. Kohlet al.,
“Influence of glucose concentration on light scattering in tissue-simulating phantoms,”
Opt. Lett., 19
(24), 2170
–2172
(1994). http://dx.doi.org/10.1364/OL.19.002170 OPLEDP 0146-9592 Google Scholar
X. Q. XuQ. H. ZhuC. J. Sun,
“Assessment of the effects of ultrasound-mediated alcohols on skin optical clearing,”
J. Biomed. Opt., 14
(3), 034042
(2009). http://dx.doi.org/10.1117/1.3156827 JBOPFO 1083-3668 Google Scholar
C. Y. HuangB. LiuM. E. Brezinski,
“Ultrasound-enhanced optical coherence tomography: improved penetration and resolution,”
J. Opt. Soc. Am. A, 25
(4), 938
–946
(2008). http://dx.doi.org/10.1364/JOSAA.25.000938 JOAOD6 0740-3232 Google Scholar
H. Q. Zhonget al.,
“In vitro study of ultrasound and different-concentration glycerol—induced changes in human skin optical attenuation assessed with optical coherence tomography,”
J. Biomed. Opt., 15
(3), 036012
(2010). http://dx.doi.org/10.1117/1.3432750 JBOPFO 1083-3668 Google Scholar
H. Q. Zhonget al.,
“Enhancement of permeability of glycerol with ultrasound in human normal and cancer breast tissues in vitro using optical coherence tomography,”
Laser Phys. Lett., 7
(5), 388
–395
(2010). http://dx.doi.org/10.1002/lapl.v7:5 1612-2011 Google Scholar
X. XuQ. Zhu,
“Feasibility of sonophoretic delivery for effective skin optical clearing,”
IEEE Biomed. Eng., 55
(4), 1432
–1437
(2008). http://dx.doi.org/10.1109/TBME.2007.912416 IEBEAX 0018-9294 Google Scholar
X. XuQ. Zhu,
“Sonophoretic delivery for contrast and depth improvement in skin optical coherence tomography,”
IEEE J. Sel. Topics Quantum Electron., 14
(1), 56
–61
(2008). http://dx.doi.org/10.1109/JSTQE.2007.912900 IJSQEN 1077-260X Google Scholar
M. G. Ghosnet al.,
“Permeation of human plasma lipoproteins in human carotid endarterectomy tissues: measurement by optical coherence tomography,”
J. Lipid Res., 52
(7), 1429
–1434
(2011). http://dx.doi.org/10.1194/jlr.D015255 JLPRAW 0022-2275 Google Scholar
B. B. Goldberg,
“Ultrasound contrast agents,”
Clin. Diagn. Ultrasound, 28 35
–45
(1993). CDULDB 0193-743X Google Scholar
H. Uematsuet al.,
“Vascular permeability: quantitative measurement with double-echo dynamic MR imaging—theory and clinical application,”
Radiology, 214
(3), 912
–917
(2000). RADLAX 0033-8419 Google Scholar
J. RipollH. MeyerA. Garofalakis,
“In vivo optical tomography: from diffusion to ballistic,”
Opt. Mater., 31
(7), 1082
–1085
(2009). http://dx.doi.org/10.1016/j.optmat.2007.12.021 OMATET 0925-3467 Google Scholar
K. V. LarinV. V. Tuchin,
“Functional imaging and assessment of the glucose diffusion rate in epithelial tissues in optical coherence tomography,”
Quantum Electron., 38
(6), 551
–556
(2008). http://dx.doi.org/10.1070/QE2008v038n06ABEH013850 QUELEZ 1063-7818 Google Scholar
M. G. Ghosnet al.,
“Differential permeability rate and percent clearing of glucose in different regions in rabbit sclera,”
J. Biomed. Opt., 13
(2), 021110
(2008). http://dx.doi.org/10.1117/1.2907699 JBOPFO 1083-3668 Google Scholar
M. G. Ghosnet al.,
“Monitoring of glucose permeability in monkey skin in vivo using optical coherence tomography,”
J. Biophotonics, 3
(1–2), 25
–33
(2010). http://dx.doi.org/10.1002/jbio.200910075 JBOIBX 1864-063X Google Scholar
M. G. GhosnV. V. TuchinK. V. Larin,
“Nondestructive quantification of analyte diffusion in cornea and sclera using optical coherence tomography,”
Invest. Ophthalmol. Visual Sci., 48
(6), 2726
–2733
(2007). http://dx.doi.org/10.1167/iovs.06-1331 IOVSDA 0146-0404 Google Scholar
M. G. Ghosnet al.,
“Effect of temperature on permeation of low-density lipoprotein particles through human carotid artery tissues,”
J. Biophotonics, 2
(10), 573
–580
(2009). http://dx.doi.org/10.1002/jbio.v2:10 JBOIBX 1864-063X Google Scholar
X. Guoet al.,
“In vivo comparison of the optical clearing efficacy of optical clearing agents in human skin by quantifying permeability using optical coherence tomography,”
Photochem. Photobiol., 87
(3), 734
–740
(2011). http://dx.doi.org/10.1111/php.2011.87.issue-3 PHCBAP 0031-8655 Google Scholar
Q. L. Zhaoet al.,
“Quantifying glucose permeability and enhanced light penetration in ex vivo human normal and cancerous esophagus tissues with optical coherence tomography,”
Laser Phys. Lett., 8
(1), 71
–77
(2011). http://dx.doi.org/10.1002/lapl.v8.1 1612-2011 Google Scholar
M. W. MillerD. L. MillerA. A. Brayman,
“A review of in vitro bioeffects of inertial ultrasonic from a mechanistic perspective,”
Ultrasound Med. Biol., 22
(9), 1131
–1154
(1996). http://dx.doi.org/10.1016/S0301-5629(96)00089-0 USMBA3 0301-5629 Google Scholar
T. Leighton, The Acoustic Bubble, Academic Press, San Diego
(1997). Google Scholar
J. SundaramB. R. MelleinS. Mitragotri,
“An experimental and theoretical analysis of ultrasound-induced permeabilization of cell membranes,”
Biophys. J., 84
(5), 3087
–3101
(2003). http://dx.doi.org/10.1016/S0006-3495(03)70034-4 BIOJAU 0006-3495 Google Scholar
N. B. Smith,
“Perspectives on transdermal ultrasound mediated drug delivery,”
Int. J. Nanomedicine, 2
(4), 585
–594
(2007). IJNNHQ 1178-2013 Google Scholar
X. Guoet al.,
“Quantification of glucose diffusion in human lung tissues by using Fourier domain optical coherence tomography,”
Photochem. Photobiol., 88
(2), 311
–316
(2012). http://dx.doi.org/10.1111/php.2012.88.issue-2 PHCBAP 0031-8655 Google Scholar
X. Guoet al.,
“In vivo quantification of propylene glycol, glucose and glycerol diffusion in human skin with optical coherence tomography,”
Laser Phys., 20
(9), 1849
–1855
(2010). http://dx.doi.org/10.1134/S1054660X10170032 LAPHEJ 1054-660X Google Scholar
I. V. Larinaet al.,
“Enhanced OCT imaging of embryonic tissue with optical clearing,”
Laser Phys. Lett., 5
(6), 476
–479
(2008). http://dx.doi.org/10.1002/(ISSN)1612-202X 1612-2011 Google Scholar
X. Q. XuQ. H. ZhuC. J. Sun,
“Combined effect of ultrasound-SLS on skin optical clearing,”
IEEE Photon. Technol. Lett., 20
(24), 2117
–2119
(2008). http://dx.doi.org/10.1109/LPT.2008.2006987 IPTLEL 1041-1135 Google Scholar
G. A. HusseiniW. G. Pitt,
“Ultrasonic-activated micellar drug delivery for cancer treatment,”
J. Pharm. Sci., 98
(3), 795
–811
(2009). http://dx.doi.org/10.1002/jps.v98:3 JPMSAE 0022-3549 Google Scholar
K. Tachibanaet al.,
“Enhanced cytotoxic effect of Ara-C by low intensity ultrasound to HL-60 cells,”
Cancer Lett., 149
(1–2), 189
–194
(2000). http://dx.doi.org/10.1016/S0304-3835(99)00358-4 CALEDQ 0304-3835 Google Scholar
K. Tachibanaet al.,
“Induction of cell-membrane porosity by ultrasound,”
Lancet, 353
(9162), 1409
(1999). http://dx.doi.org/10.1016/S0140-6736(99)01244-1 LANCAO 0140-6736 Google Scholar
S. MitragotriJ. Kost,
“Low-frequency sonophoresis: a noninvasive method of drug delivery and diagnostics,”
Biotechnol. Prog., 16
(3), 488
–492
(2000). http://dx.doi.org/10.1021/bp000024+ BIPRET 8756-7938 Google Scholar
D. S. FaffeW. A. Zin,
“Lung parenchymal mechanics in health and disease,”
Physiol. Rev., 89
(3), 759
–775
(2009). http://dx.doi.org/10.1152/physrev.00019.2007 PHREA7 0031-9333 Google Scholar
N. F. Boydet al.,
“Mammographic densities and breast cancer risk,”
Cancer Epidemiol. Biomarkers Prev., 7
(12), 1133
–1144
(1998). CEBPE4 1055-9965 Google Scholar
S. Mitragotri,
“Sonophoresis: a 50-year journey,”
Drug Discov. Today, 9
(17), 735
–736
(2004). http://dx.doi.org/10.1016/S1359-6446(04)03209-X DDTOFS 1359-6446 Google Scholar
J. SundaramB. R. MelleinS. Mitragotri,
“An experimental and theoretical analysis of ultrasound-induced permeabilization of cell membranes,”
Biophys. J., 84
(5), 3087
–3101
(2003). http://dx.doi.org/10.1016/S0006-3495(03)70034-4 BIOJAU 0006-3495 Google Scholar
|


