
|
|
1.IntroductionTopical microbicide gels offer promise for vaginal prophylaxis against sexually transmitted infections, including human immunodeficiency virus (HIV). These gels contain active pharmaceutical ingredients (APIs) that either act to neutralize pathogens before they come into contact with the mucosal surfaces, or inhibit the viral transmission processes within the mucosa proper.1–6 An effective topical microbicide gel requires a potent API, loaded into a delivery vehicle that provides adequate extent and thickness of coating, in order to successfully deliver the drug.7 Such delivery depends upon details of the coating thickness distribution.8,9 Although this distribution, and the associated drug delivery, can be predicted by mechanistic computational modeling,9 there is a need for experimental methodologies that directly measure it in vivo, to help understand the pharmacokinetics and pharmacodynamics of potential microbicidal gel candidates. Remote sensing imaging techniques, such as magnetic resonance imaging (MRI) and single-photon emission computed tomography (SPEC-CT), can provide information about such vaginal gel distributions.10–15 While these imaging modalities provide excellent information on the pelvic anatomy and general microbicide gel distribution, they typically lack the resolution to detect the thin coating layers, of the order of 100 μm, that may be sufficient for microbicide gel functioning.7,8 Further, contrast agents typically must be added to the gels before imaging, and this may limit the time between gel insertion and imaging since the contrast agent can separate from the gel into the tissues and fluids of the body. As shown with mechanistic modeling,8,9 the details of microbicide gel drug delivery, and also HIV migration from semen to vulnerable epithelial surfaces, depend upon the details of local coating thicknesses. That gel coating thickness distribution depends on gel properties, inserted volume, and frequency of dosing.9 We have developed an optical probe-based imaging platform that can be applied to determine how vaginal gel coating thickness distributions vary spatially and temporally after product insertion. Data from this device can be input to biophysical models of coating layers development and of HIV transport.7–9,16 We initially created a fluorescence-based device,17,18 but the addition of an exogenous contrast agent (sodium fluorescein) limited the time interval for imaging because of separation of the fluorophore from gel to tissue. Our second-generation device now combines two optical imaging modalities, multiplexed low coherence interferometry (mLCI) and fluorimetry, into a single endoscopic method; the two modalities can be implemented in tandem for in vivo imaging, as described in Drake et al.19 The instrument has an axial resolution , allowing measurement of much thinner gel layers than those detected using remote sensing techniques. Significantly, the mLCI measurements do not require addition of exogenous contrast agents for measurement. Preliminary proof-of-concept results from this method were presented in an earlier technical paper.19 Here, we provide demonstration of instrument capability in a human in vivo clinical study, and evaluate the quality and relevance of the data obtained from this new device. 2.Materials and Methods2.1.Optical Imaging InstrumentThe optical imaging device is a dual-modality, probe-based instrument that measures local gel coating thickness with both fluorimetry and mLCI, simultaneously. Figure 1 presents a schematic of the key components of the instrument. The instrument implements these measurements within an optically clear, sealed polycarbonate tube, with a wall thickness of 3.2 mm. The material has been approved by the FDA for medical use (General Electric, medical grade Lexan 104 resin). The tube is inserted into the vagina for imaging while the participant is in the supine position on a standard pelvic examination table. The tube is held in place by a mechanical mounting cart (Fig. 2), while the internal optical components of the endoscope (outside diameter 4 mm) rotate and translate freely within it, for complete scanning of the vaginal canal. Henderson et al. and Drake et al. have described in detail the operational features and calibration methods of the fluorimetric and mLCI devices, respectively, in previous publications.17–20 Originally, the device was designed and built for fluorimetry alone; the mLCI optics were later adapted for dual-modality imaging.19–21 The fluorimetry method is built around a 4-mm-diameter medical-grade endoscope (Storz 27005CA) that acts to deliver light for fluorescence excitation and to collect emitted light for spectral measurement. Excitation light is provided by a 300-watt Xenon lamp (Wolf AUTO-LP 5131.001), notch-filtered to exclude the emission peak of fluorescein (500 to 560 nm). The detected fluorescence emission is split into two signals: one is routed to a video camera to provide visual information on the surfaces of the vaginal canal, and the other is routed to a photomultiplier tube via fiber optic cabling to provide quantitative information on fluorescence intensity at the measurement point. The probe tip of the internal endoscope features a sealed well containing distilled water, to limit changes in index of refraction, and thus reflections, in the fluorimetry light path. This feature also acts as a thermal buffer between the illumination tip of the endoscope and the vagina. Fig. 1(a) High-level diagram of the mLCI system (left side), the fluorimetric system (right side), and the components they have in common (center); PMT: photomultiplier tube. Both the mLCI system and fluorimetric system have their own unique light source and detectors. The information from the positional encoders is used to co-register the data. The probe geometry is shown in (b) where the endoscopic probe rotates within the polycarbonate tube. 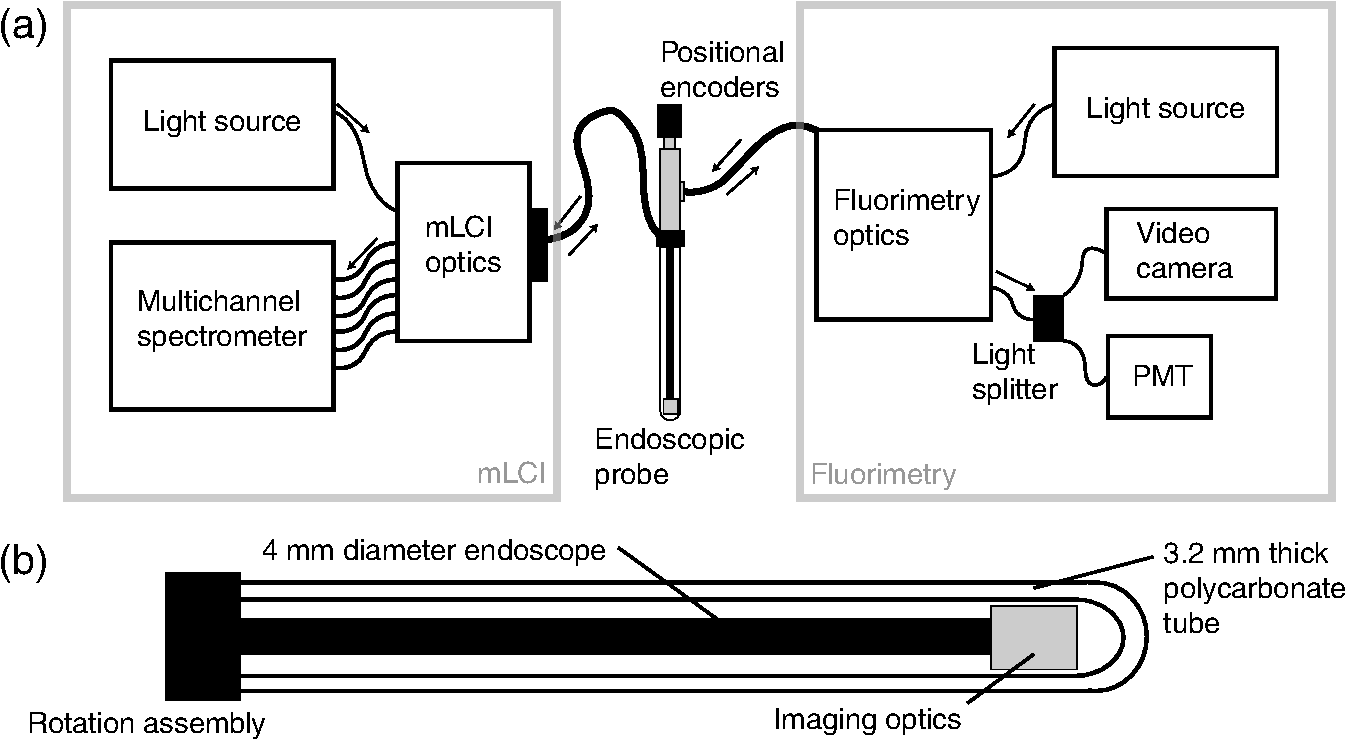 Fig. 2Photograph of the endoscopic probe mounted onto its positioning cart. The azimuthal and axial positional encoders supply accurate positioning information to both systems. 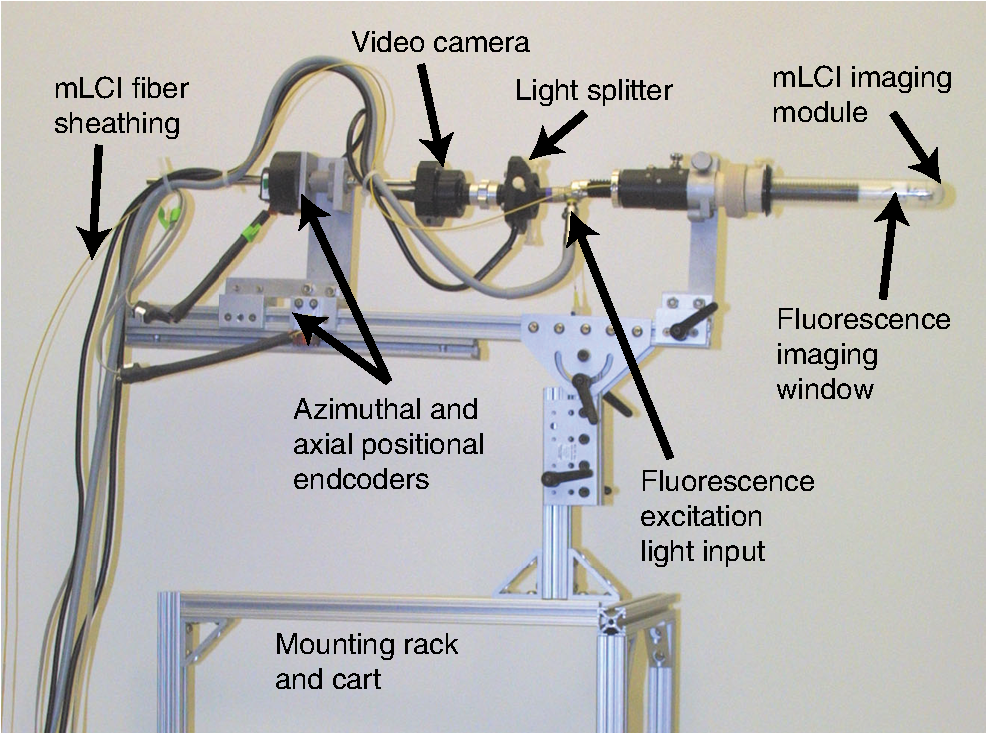 The mLCI imaging modality is based on an interferometric optical sectioning technique similar to that used in Fourier-domain optical coherence tomography.22 mLCI measures depth-resolved reflectance profiles of a sample A-scan analogous to the acoustic reflection profiles commonly seen in ultrasound. It applies broadband light from a superluminescent diode (SLD, Superlum Diodes) with a bandwidth of 54.2 nm and a center wavelength of 837.5 nm. This provides a coherence length, or axial resolution, of 5.7 μm, enabling high-resolution measurements of thickness. The light from the SLD is split into eight channels (six are used) and six fiber optic couplers (AC Photonics). Each creates six parallel sample and reference arms for each interferometer. The parallel interferometers contain electromechanical fiber optic shutters to allow gating of each reference arm, for background subtraction during measurement. In the sample arms of the device, the six fiber optic cables are routed through a polyetheretherketone (PEEK, ZEUS, Inc.) sheath and into the common endoscopic probe, as shown in Fig. 1. A custom-imaging module was built and mounted to the distal end of the endoscope, leading the fluorescence measurement field by 20 mm and rotated 180 degrees. This imaging module acts to hold the fibers securely in place and enables imaging of six measurement spots on the surface of the vaginal epithelium through the polycarbonate tube.19,21 The light returned by the sample is recombined with the reference light by the aforementioned fiber optic couplers, and detected with a multichannel spectrometer (Avantes, Inc.). The spectrometer allows simultaneous detection of all six interference signals and operates at a rate of .19 Data are transferred via a USB 2.0 interface to a laptop computer, which provides automated control of the fiber optic switches for background subtraction and preliminary data analysis. The background-subtracted interference spectra are then converted from wavelength to wavenumber, resampled to restore linearity, and Fourier transformed to reveal A-scans, or depth scans, for the measurement position.19 A linear and rotational positional encoder system relays the axial and azimuthal coordinates of the endoscope to both systems, to enable co-registration between the two modalities. During measurement, the fluorimetric measurement fields are approximately 1 cm in diameter, while each mLCI field consists of six 50 μm-diameter spots arranged in a line that extends about 3.5 mm, and is oriented azimuthally around the tube surface (i.e., the line is transverse to the axis of the tube). A combination of data from these different sampling procedures is presented below. For the trial described in this study, four of six mLCI imaging channels were active; two did not include electromechanical fiber shutters for background subtraction due to cost. The 20-mm and 180-deg field-of-view offset was also digitally compensated for in the same manner as described in Drake et al.19 2.2.Clinical Study ProtocolNine participants completed fifteen study sessions during an initial clinical study that compared mLCI vaginal gel thickness measurements with simultaneous, co-registered measurements of coating thickness by the fluorimetric technique. The participants were healthy women between the ages of 18 and 45, who were not pregnant and had a regular menstrual cycle. There were no restrictions on race or ethnicity. Some participants completed multiple study sessions, but the study design did not require all participants to do so. Test gel distribution was measured primarily at 10 min after gel insertion. However, in two pilot experiments, the measurements were performed at 60 min after insertion, and those results are included here. The participant either: 1. remained seated for 1 min, stood for 1 min, seated again for 1 min, and then supine for the remaining minutes (referred to as sit/stand/sit); or 2. remained in the supine position for the entire time interval (referred to as supine). The test gel consisted of 3.5 mL of fluorescein-labeled Replens (0.1% ) vaginal moisturizer (Lil Drugstore), a polycarbophil-based gel that is considered a biophysical model of some microbicide gel products.11,17,18 For each of the fifteen study sessions, the following procedure was used for data collection. First, the tube was cleaned by submerging it in an enzymatic detergent (EmPower, Metrex Research) for a minimum of 1 min. The tube was then submerged in a CIDEX OPA solution (Advanced Sterilization Products) for at least 12 min, rinsed with water for three 1-min rinses, wiped with alcohol and allowed to dry. The participating woman then entered the exam room and assumed a supine position on the pelvic exam table. The tube was then lubricated with a thin coating of nonlabeled Replens gel for comfort during insertion for a background scan. The physician then inserted the tube and endoscope assembly, positioning the endoscope to the vaginal fornix, and adjusting an opaque flange that eliminates ambient light from the exam room. The endoscopic assembly was zero-positioned at the fornix, and the physician then advanced the endoscope manually inside the polycarbonate tube which remained locked in a stationary position. Data were collected at 1-mm intervals axially for mLCI and 5-mm intervals for fluorescence measurements, until the endoscope was advanced completely to the introitus. The endoscope was then rotated azimuthally 45 deg inside the tube and the scan was continued back towards the fornix, repeating these maneuvers until an azimuthal 360-deg sweep of the vaginal lumen was completed. Once the background scan was completed, 3.5 mL of fluorescein-labeled Replens loaded into a syringe-type applicator was inserted in the participant’s vagina to the fornix. The participant then underwent, in private, one of the two defined posture sequence protocols. The complete probe was again inserted into the vagina to the same depth as the background scan, and the scan procedure was repeated. On average, the data set consisted of approximately 150 measurement sites for fluorimetry and 1500 measurement points (or A-scans) for mLCI per participant. These numbers differed amongparticipants due to variations in the anatomical length of the vaginal canal. Typically, 75 to 110 mm of axial distance was scanned at eight angles. The study procedure generally lasted on average 49 min per participant for measurement 10 min after gel insertion, and 1 h 40 min for measurements 60 min after insertion.19 2.3.Data AnalysisImaging data were first registered between the two modalities, compensating for the field-of-view offset, using the procedure explained by Drake et al.19 The mLCI dataset is rotated by 180 deg and shifted to reconcile the mLCI imaging data with the fluorimetry results. Five consecutive axial mLCI scans were then averaged to compensate for the larger field of view of the fluorimetric instrument, at each fluorimetric measurement position. A subtraction of the mLCI background scan from the test scan was also performed to remove any effects from nonlabeled Replens gel, a small amount of which was used for probe insertion.19 2.4.Summary Measures of CoatingA set of summary measures was evaluated to characterize salient features of gel coating thickness distribution. These metrics were designed to provide information that is useful in characterizing and comparing vaginal drug delivery by different gels. It is important to note that in this study we are not comparing the performance of different gels, as in Henderson et al., but assessing the feasibility and accuracy of mLCI in measuring gel coating thickness distributions in the human vaginal canal.17 However, some of the previously developed summary measurements are appropriate to compare the results from the two imaging modalities, as summarized below. In addition, we have introduced a new measure: the azimuthally averaged coating thickness as a function of position along the vaginal canal. This graphically depicts the mass distribution of gel. It provides a useful visual indication of how far the gel has spread down the canal from the site of application in the interior fornix towards the introitus. 3.ResultsFifteen study sessions were completed in this study, which followed a protocol approved by the IRB at the Duke University Medical Center. Table 1 summarizes results. A total of 22,344 mLCI scans was obtained during the study, but scans with low signal intensity were rejected at a 23.7% failure rate, yielding a total of 17,048 mLCI scans. The fluorimetric data set consisted of a total of 2232 scans, all of which had sufficient signal for processing. Table 1Summary results for clinical study.
The average fraction of tissue surface with coating measured by mLCI was (), while fluorimetry yielded ; these were not significantly different (; paired test after arcsine transformation of the percentages). The average absolute difference between the modalities per experiments was . Figure 3 illustrates comparative results for the two imaging modalities on a per-experiment basis. Linear regression gave a line with a slope of 0.9967 (; not significantly different from unity), and an intercept value of (; not significantly different from zero). Fig. 3Fraction of vaginal surface with detectable coating comparison, for the mLCI modality (-axis) versus the fluorimetric modality (-axis). The shaded region indicates the 95% confidence curve of the fit while the dotted lines demarcate the 95% confidence interval of the individual data observations.  Typical coating thickness distributions are shown graphically in Fig. 4, for a 10-min time interval between insertion and imaging during which the participant completed the sit/stand/sit protocol. The data are given as a topographical plot, in which the color-bar indicates gel thickness. The zero-degree angle of the -axis is aligned to the vertical position as the participant is lying on the exam table, and the axial location of 20 mm is located towards the fornix, i.e., the deepest location within the vagina. Additionally, results of the azimuthally averaged coating thickness as a function of axial distance from the fornix to the introitus are plotted for six experiments (three sit/stand/sit, three supine) in Fig. 5. The mLCI data were truncated at 20 mm to match the fluorimetric field of view. Again, it is revealed that mLCI failed to measure the full thickness for larger coatings, but the modalities do show agreement in identifying the axial extent of gel coating. Additionally, the axial distance at which azimuthally averaged coating fell below the 100 μm threshold were plotted for the modalities (Fig. 6), and a linear regression was performed. The line of best fit had a slope of 0.9155 (; not statistically different from unity), and a -intercept of (; not statistically different from zero). While we acknowledge that there are multiple ways in which to compare data on a case by case basis, our regression shows no systematic offset between the data and a linear relationship between the two measurement modalities. Additional coating metrics are summarized in Table 2, where percentages of tissue coatings with thicknesses less than 100 μm were calculated for both modalities. In addition, the average axial extents of azimuthally averaged coating with thickness greater than 100 μm were calculated for the data and presented below. The importance of this critical coating thickness is discussed below. Fig. 4Typical human in vivo microbicide gel coating measurements from a single study (10-min time interval; sit/stand/sit posture protocol. The color-bar shows gel coating depth in μm from the fluorimetric technique (a) and mLCI in (b). Contour lines represent 50 μm changes in coating while the red contour line is the margin for areas with a coating thickness greater than 100 μm.  Fig. 5Azimuthally averaged coating thickness distributions from mLCI (red) and fluorimetry (blue). The -axis reveals coating thickness in microns and the -axis shows the axial location with 20 mm being towards the fornix and 100 mm towards the introitus of the vagina. The dotted line demarcates 100 μm coating thickness. 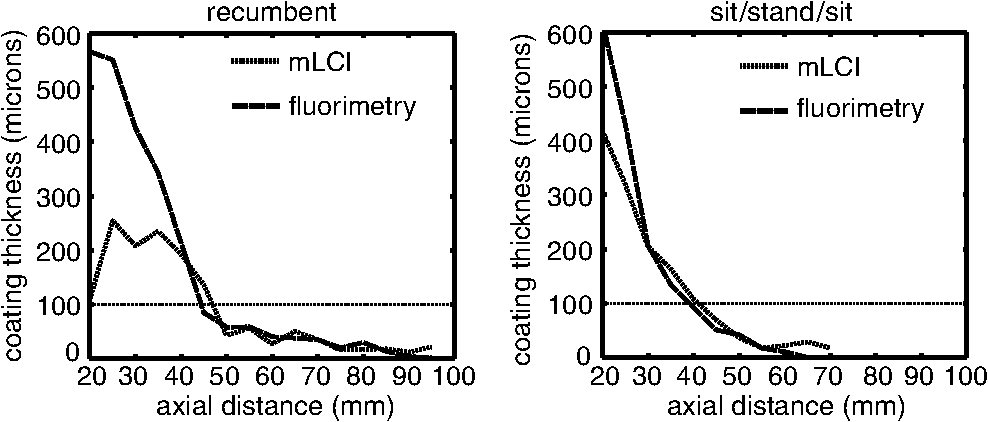 Fig. 6Axial extent of azimuthally averaged coating with thickness less than 100 μm. mLCI modality (-axis) is plotted versus the fluorimetric modality (-axis). The shaded region indicates the 95% confidence curve of the fit and the dotted lines define the 95% confidence interval of the individual data observations. 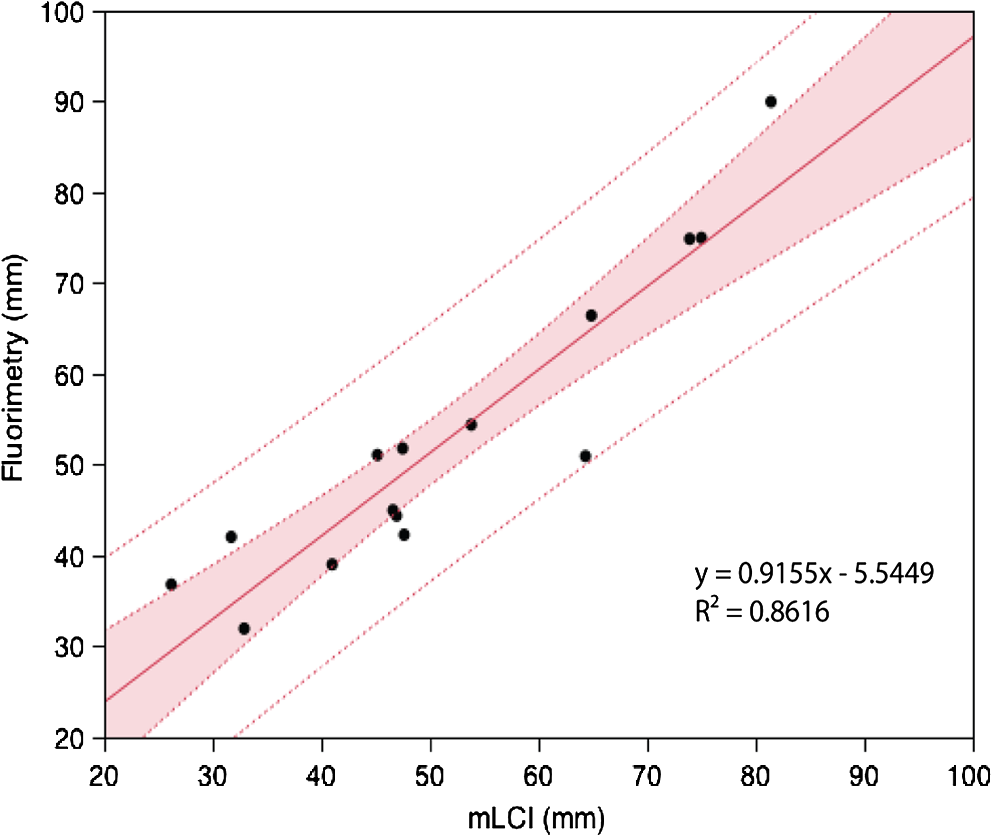 Table 2Fraction of coating thickness distribution with relatively low thickness (<100 μm) and axial extent of azimuthally averaged coating with thickness greater than 100 μm. Results are shown as mean±SEM. Average values for mLCI versus fluorimetry were not significantly different for either sit/stand/sit or supine protocols at 10 min (paired t test after arcsine transformation of percentages).
From Table 2, it is seen that mLCI and fluorimetry measured similar fractions of surface with relatively low coating thicknesses (). The modalities also agreed in identifying the axial point at which azimuthally averaged coating falls below the 100 μm threshold. We note, however, that there is a fundamental depth measurement limit for this current mLCI instrument due to our spectral resolution (1.588 mm)20 that is not achieved with the current optical configuration. This limit is described further in Sec. 4. Consequently, the mLCI instrument lacked the imaging depth to properly measure relatively thick coatings (greater than ). This can be improved upon by modifying the measurement parameters, as is discussed below. 4.DiscussionCharacterization of the in vivo coating thickness distributions of microbicide gel products informs their rational design. The extent and uniformity of coating in the vaginal lumen govern the release and transport of APIs to target tissues and fluids, and also provide a physical barrier to HIV virion migration to the tissue surface. Imaging techniques that can provide data on these coating thickness distributions can thus be valuable in interpreting the relative performances of different gels, gel volume, and gel dosage regimens. The data can serve not just as empirical measures of coating, but can be input to biophysically based computations that characterize gel performance in delivering drugs to vaginal fluids and tissue, and in retarding HIV migration from semen to those tissues (where transmission may occur).7–9,16 Our probe-based optical imaging instrument is capable of providing details of microbicide gel coating in the human vagina with depth resolution on the order of 10 μm. The probe is roughly the same size and shape as a phallus and when applied, mimics the gel distribution that would occur during the time of intromission. It provides data that can be used in objective computations of microbicide gel performance. In this initial clinical study, a custom-built, Fourier-domain multiplexed low-coherence interferometry (mLCI) imaging system was adapted to a previously validated fluorescence-based imaging platform in order to test the feasibility of mLCI in measuring in vivo gel coating thickness distributions.17–21 Measured fraction of vaginal surface with gel coating was similar for the two modalities, with mLCI yielding 0.667 and fluorimetry measuring 0.645. However, the mLCI module in our device was limited in its ability to measure relatively large local coating thickness. This was due to optical aberrations and scattering caused by the endoscope’s protective polycarbonate tube, as well as off-axis aberrations from the use of off-the-shelf optics in the mLCI imaging module. In addition, the mLCI field of view is much smaller than that of the fluorescence device. Therefore, the mLCI instrument detects local changes in coating more precisely than the fluorimetric system. At thicker coatings, where mLCI data is lost due to lack of imaging depth, fewer mLCI data points are averaged in the data processing routine, and the effect of local coating variation is greater. Our original hypothesis of the study was there would be changes in gel thickness distribution between the two protocols, sit/stand/sit and supine. However, statistically significant changes in thickness distribution were not seen. Based on the observed differences, it is believed that a significantly larger number of participants would be needed, but the resources were not available for expanding this proof-of-principle study. Instead, we plan a much larger trial in the near future that will compare multiple gel formulations and protocols. We note that biophysical analyses show that as coating thickness increases to the order of 1000 μm (that might occur in the relatively large space of the fornix), both viral and drug transport are substantially delayed.7,8 Thus, the inability to distinguish amongst local regions with large thicknesses may not compromise biological interpretation of the coating distribution overall. It is the widespread presence of regions with smaller thicknesses, on the order of 100 μm or less, over as much epithelial surface as possible, that could adversely impact gel performance. Use of mLCI for measuring vaginal gel coating over a range of conditions is advantageous in that it does not require addition of exogenous contrast agent(s) to the gel. Such agents can diffuse out of the gel and into adjacent tissues and/or fluids, thereby creating artifactual indications that gel is present. Label-free modalities are preferable for measurements at extended times after gel insertion, which are biologically important in understanding gel functionality in delivering APIs. We are currently building an improved, second-generation dual-modality device for further clinical study. Improvements include increased imaging depth resolution of the mLCI. New epoxy-based molded tubes (EPO-TECK 301, Epoxy Technology) are being used; these have significantly more uniform optical surfaces than the original polycarbonate tubes, resulting in better optical transmission and a decrease in spurious light reflections, which increases signal and penetration depth. Notably, the fluorimetric imaging is less affected by this change, since the device averages signal over a larger field. These improvements will greatly increase mLCI imaging depth for in vivo applications, allowing the system to better approach its theoretical maximum depth of 1.588 mm.20 In addition, the fluorimetry and mLCI devices are being fully integrated onto a single clinical instrument that will reduce the footprint in the exam room and, with improved ergonomics, decrease study time. The relevance of this clinical instrument and our study can be seen by considering recent clinical trials, such as the CAPRISA 004 phase IIb trial of the use of a vaginal gel containing the antiretroviral drug tenofovir, as a HIV prevention modality. In this trial, the use of prophylactic gel showed a 39% reduction of HIV transmission over the control population, indicating that microbicide gels can be efficacious.23 However, another phase III trial of the same drug tenofovir, the VOICE MTN-003 trial, had two arms of its testing terminated, including the topical tenofovir gel delivery arm, because preliminary data analysis indicated that it was not effective in preventing HIV in enrolled women.24 Although dose regimen differed between the trials, the reason for the disparate outcomes is not fully understood. For the gel trials, the vaginal distribution of the gel has been shown to be an important factor of pharmacokinetics of the drug, as well as acting as a physical barrier to HIV virions, and is a key factor for biological performance of HIV prevention.9 Thus, the microbicide field would benefit greatly from an in vivo coating measurement technique that accurately and safely measures gel distribution along the vaginal canal. 5.SummaryIn summary, a probe-based dual-modality optical imaging instrument was used to measure in vivo vaginal gel coating thickness distributions in a human clinical trial. Thickness data from fluorimetric measurements were compared to those from mLCI to assess the feasibility of using mLCI in studying in vivo gel thickness distributions. Fractions of vaginal tissue with coating values were compared for the modalities, and these measurements were found to be not statistically different (; ; ). The mLCI device does not require the use of exogenous contrast agents for imaging, allowing extended time studies to be performed. Future work on this device will be aimed at improving its accuracy for measuring large coating thicknesses and improving its ergonomics to decrease study time. AcknowledgmentsThis research was supported by the National Institutes of Health Grant No. U19-AI 077289. ReferencesH. Brown,
“Marvellous microbicides. Intravaginal gels could save millions of lives, but first someone has to prove that they work,”
Lancet, 363
(9414), 1042
–1043
(2004). http://dx.doi.org/10.1016/S0140-6736(04)15881-9 LANCAO 0140-6736 Google Scholar
R. ShattockS. Solomon,
“Microbicides—aids to safer sex,”
Lancet, 363
(9414), 1002
–1003
(2004). http://dx.doi.org/10.1016/S0140-6736(04)15876-5 LANCAO 0140-6736 Google Scholar
A. Stone,
“Microbicides: a new approach to preventing HIV and other sexually transmitted infections,”
Nat. Rev. Drug Discov., 1
(12), 977
–985
(2002). http://dx.doi.org/10.1038/nrd959 NRDDAG 1474-1776 Google Scholar
A. T. Haase,
“Perils at mucosal front lines for HIV and SIV and their hosts,”
Nat. Rev. Immunol., 5
(10), 783
–792
(2005). http://dx.doi.org/10.1038/nri1706 NRIABX Google Scholar
S. L. Lard-Whitefordet al.,
“Recommendations for the nonclinical development of topical microbicides for prevention of HIV transmission: an update,”
J. Acquir. Immune. Defic. Syndr., 36
(1), 541
–552
(2004). http://dx.doi.org/10.1097/00126334-200405010-00001 JAISET 0894-9255 Google Scholar
J. P. MooreR. J. Shattock,
“Preventing HIV-1 sexual transmission—not sexy enough science, or no benefit to the bottom line?,”
J. Antimicrob. Chemother., 52
(6), 890
–892
(2003). http://dx.doi.org/10.1093/jac/dkh011 JACHDX 0305-7453 Google Scholar
A. R. GeonnottiD. F. Katz,
“Dynamics of HIV neutralization by a microbicide formulation layer: biophysical fundamentals and transport theory,”
Biophys. J., 91
(6), 2121
–2130
(2006). http://dx.doi.org/10.1529/biophysj.106.086322 BIOJAU 0006-3495 Google Scholar
B. E. Laiet al.,
“Transport theory for HIV diffusion through in vivo distributions of topical microbicide gels,”
Biophys. J., 97
(9), 2379
–2387
(2009). http://dx.doi.org/10.1016/j.bpj.2009.08.010 BIOJAU 0006-3495 Google Scholar
D. KatzY. GaoM. Kang,
“Using modeling to help understand vaginal microbicide functionality and create better products,”
Drug Delivery Transl. Res., 1
(3), 256
–276
(2011). http://dx.doi.org/10.1007/s13346-011-0029-z 2190-393X Google Scholar
K. Barnhartet al.,
“Distribution of topical medication in the human vagina as imaged by magnetic resonance imaging,”
Fertil. Steril., 76
(1), 189
–195
(2001). http://dx.doi.org/10.1016/S0015-0282(01)01822-2 FESTAS 0015-0282 Google Scholar
K. T. Barnhartet al.,
“The optimal analysis of MRI data to quantify the distribution of a microbicide,”
Contraception, 73
(1), 82
–87
(2006). http://dx.doi.org/10.1016/j.contraception.2005.07.005 CCPTAY 0010-7824 Google Scholar
K. T. Barnhartet al.,
“In vivo distribution of a vaginal gel: MRI evaluation of the effects of gel volume, time and simulated intercourse,”
Contraception, 70
(6), 498
–505
(2004). http://dx.doi.org/10.1016/j.contraception.2004.06.013 CCPTAY 0010-7824 Google Scholar
C. K. Maucket al.,
“Vaginal distribution of Replens and K-Y Jelly using three imaging techniques,”
Contraception, 77
(3), 195
–204
(2008). http://dx.doi.org/10.1016/j.contraception.2007.11.016 CCPTAY 0010-7824 Google Scholar
J. Brownet al.,
“Spreading and retention of vaginal formulations in post-menopausal women as assessed by gamma scintigraphy,”
Pharm. Res., 14
(8), 1073
–1078
(1997). http://dx.doi.org/10.1023/A:1012113714552 PHREEB 0724-8741 Google Scholar
Y. J. Caoet al.,
“Quantification of the spatial distribution of rectally applied surrogates for microbicide and semen in colon with SPECT and magnetic resonance imaging,”
Br. J. Clin. Pharmacol.,
(2012). http://dx.doi.org/10.1111/j.1365-2125.2012.04267.x BCPHBM 0306-5251 Google Scholar
D. F. Katz,
“How did tenofovir bioavialibility differ for gel dosing in the CAPRISA 004 vs. VOICE trials?,”
in International Microbicides 2012,
(2012). Google Scholar
M. H. Hendersonet al.,
“Optical imaging and analysis of human vaginal coating by drug delivery gels,”
Contraception, 75
(2), 142
–151
(2007). http://dx.doi.org/10.1016/j.contraception.2006.08.014 CCPTAY 0010-7824 Google Scholar
M. H. Hendersonet al.,
“Optical instrument for measurement of vaginal coating thickness by drug delivery formulations,”
Rev. Sci. Instrum., 76
(3), 034302
(2005). http://dx.doi.org/10.1063/1.1863832 RSINAK 0034-6748 Google Scholar
T. K. Drakeet al.,
“Design and validation of a multiplexed low coherence interferometry instrument for in vivo clinical measurement of microbicide gel thickness distribution,”
Biomed. Opt. Express, 2
(10), 2850
–2858
(2011). http://dx.doi.org/10.1364/BOE.2.002850 BOEICL 2156-7085 Google Scholar
T. K. DrakeF. E. RoblesA. Wax,
“Multiplexed low coherence interferometry instrument for measuring microbicide gel thickness distribution,”
Appl. Opt., 48
(10), D14
–D19
(2009). http://dx.doi.org/10.1364/AO.48.000D14 APOPAI 0003-6935 Google Scholar
T. K. Drakeet al.,
“Development of an integrated endoscopic device for multiplexed low coherence interferometry (LCI) measurements of microbicide gel thickness,”
Proc. SPIE, 7169 71690R
(2009). http://dx.doi.org/10.1117/12.809114 SPIECJ 0361-0748 Google Scholar
M. Chomaet al.,
“Sensitivity advantage of swept source and Fourier domain optical coherence tomography,”
Opt. Express, 11
(18), 2183
–2189
(2003). http://dx.doi.org/10.1364/OE.11.002183 OPEXFF 1094-4087 Google Scholar
Q. A. Karimet al.,
“Effectiveness and safety of tenofovir gel, an antiretroviral microbicide, for the prevention of HIV infection in women,”
Science, 329
(5996), 1168
–1174
(2010). http://dx.doi.org/10.1126/science.1193748 SCIEAS 0036-8075 Google Scholar
L. Rossi,
“Microbicide trials network statement on decision to discontinue use of tenofovir gel in VOICE, a major HIV prevention study in women,”
in VOICE,
(2011). Google Scholar
|
||||||||||||||||||||||||||||||||||||||||||||||||||||||||||||||||||||||||||||||||||||||||||||||||||||||||||||||||||||||||||||||||||||||||||||||||||||||||||||||||||||||||||||||||||||||||||


