
|
|
1.IntroductionAtopic dermatitis (AD) is a chronic inflammatory disease associated with cutaneous hyperreactivity to environmental triggers.1 AD is characterized by eczematous lesions and in some cases are associated with elevated serum IgE levels. Various studies have indicated that AD has a complex etiology, with activation of multiple immunologic and inflammatory pathways.2,3 Langerhans cells (LCs) are the predominant dendritic cell (DC) population in the epidermis and are thus the first line of defense against antigens that penetrate the skin.4 In AD skin lesions, the majority of LCs exhibit surface-bound IgE, with being the critical IgE-binding receptor enabling it to capture allergens penetrating into the skin. LCs up-regulate their display of in atopy patch tests.5 In AD, LCs bearing the antigen migrate from the skin to the draining lymph nodes (DLNs) where they activate -mediated Th2 immune responses. It is possible that other undefined receptor-mediated antigen sensitization pathways might thus be responsible for allergen uptake and allergic response relevant to the pathophysiology of AD. CD207 (langerin) is a type II C-type lectin receptor (CLR) that binds mannose and related sugars in a calcium-dependent manner through its carbohydrate-recognition domain (CRD).6 Its expression is demonstrated at the surface membrane as well as in Birbeck granules, those organelles specific for LCs. Several lines of evidence have indicated that CD207 is a specific marker for the acquisition of the LC phenotype.7,8 A mouse homologue of human CD207 has also been identified.9,10 The predicted mouse CD207 displays an overall 66% sequence identity with the human CD207.9 It has been suggested that the process of antigen capture, internalization (endocytosis), the formation of Birbeck granules, processing, migration to lymphoid tissue, and maturation of LCs is a consequence of CD207 function.11 The precise role of LCs in allergic diseases is still under debate. A concordant increase in LC proliferation in patients with human AD and in a mouse AD model suggests a potential relevance of LCs in the pathophysiology of AD.12,13 LCs are in the foreground in the initial sensitization phase of AD.14,15 CD207 expression was essential for promotion of the skin allergic responses.16 However, LCs contribute to Th2 polarization by an unknown mechanism after allergen capture.17 It is not clear that whether allergen uptake by CD207 plays any role in the development of allergic sensitization in human beings.18 We set up a technique combining Alexa Fluor conjugates with Cr:forsterite laser-based multimodality nonlinear microscopy to allow for the unequivocal imaging of LCs and ovalbumin (OVA) in the skin and in the DLNs. 2.Materials and Methods2.1.Mice, Allergens, and Epicutaneous SensitizationFor the animal model of epicutaneous (EC) OVA sensitization, six- to eight-week-old female BALB/c mice were obtained from the Animal Center of the College of Medicine, National Taiwan University. All procedures performed on the mice were approved by The Animal Care and Use Committee of National Taiwan University Hospital. EC sensitization of the mice was performed as previously described.19 The protein antigens used in this study were OVA () (Sigma Chemical Co., St. Louis, MO, USA). The antigen was prepared in distilled water. In brief, 20 μl of OVA solution was first added to the paper disc insert of a Finn Chamber (Epitest Co., Tuusula, Finland), which was then applied to a patch of sterile gauze. The disc was then applied to the skin on the lateral side of the abdomen and fixed and secured with an elastic bandage to ensure skin contact and to prevent oral ingestion. The OVA patches were kept there for 24 h and freshly prepared patches were reapplied to the same skin site everyday. The course of immunization was totally for five days. 2.2.Monoclonal AntibodiesAlexa Fluor 647-rat anti-mouse CD207, and Alexa Fluor 647-rat IgG2a isotype control were purchased from eBioscience, Inc. (San Diego, CA). OVA-Alexa Fluor 647 conjugate was purchased from Invitrogen (Carlsbad, CA). Alexa Fluor 700-rat anti-mouse CD205 was obtained from AbD Serotec (Oxford, UK). 2.3.Cr:forsterite Laser-Based Multimodality Nonlinear Microscopy SystemThe imaging system used for our experiments has been described previously.19 The Cr:forsterite laser-based multimodality nonlinear microscopy system was adapted from a FluoView 300 (FV300) scanning unit (Olympus, Tokyo, Japan) combined with a BX51 microscope (Olympus, Tokyo, Japan). The light source was a home-built Cr:forsterite fs laser centered at 1230 nm with a 130 fs pulse width and a 110-MHz repetition rate. The infrared (IR) beam exiting the laser was first shaped by a telescope and then directed into the Olympus FV300 scanning unit and the Olympus BX51 microscope. Real-time scanning was accomplished with a pair of galvanometer mirrors inside the scanning unit. An IR water-immersion objective of working distance 2 mm (LUMplanFL/IR /N.A. 0.9, Olympus, Tokyo, Japan) was used to focus the laser beam into the observed skin specimen. The average illumination power applied onto the surface of the specimen was 100 mW. A mean power of 100 mW with a 110-MHz repetition rate was chosen (pulse energy of ). Different optical harmonic signals were separated with another beam-splitter (BS 1, 490DRXR, Chroma technology, Rockingham, VT). The backward-propagating harmonic signals were detected by different photomultiplier tubes (PMT) (Harmamatsu R4220P for third harmonic generation (THG); and Harmamatsu R943-02 for second harmonic generation (SHG), Bridgewater, Westport, CT, USA) with 410- and 615-nm narrowband interference filters (D410/30X and D615/10X, respectively, Chroma technology) in front, which were synchronized with the galvanometer mirrors. For in vivo observation, the laser beam exiting the objective was scanned across the specimen and the backward-propagating multimodal nonlinear signals from the specimen were collected with the same water-immersion objective. The microscope objective employed to focus the laser beam also acted as the collection lens to collect the backward propagation SHG, THG, and two-photon fluorescence (TPF). The backward-propagating TPF signals, which were not deflected with the dichroic mirror, were separated with another beam-splitter (BS 2, 865dcxru, Chroma technology) and detected by another PMT (Harmamatsu R928P). We employed long-pass emitter LF635/LP-A-000 (Semrock) and E700lp (Chroma technology) in front of the PMT for TPF to select wavelengths longer than 655 and 700 nm and block shorter wavelengths, respectively. We used short-pass emitter E700sp-2p (Chroma Technology), which transmits wavelengths shorter than 700 nm and blocks longer wavelengths. The scanning rate of the FV300 scanning unit was corresponding to two frames per second for a resolution. Spatial resolution was and for SHG and THG signals in the plane, respectively. Resolution was on the order of 1 μm in the plane. Specimens were mounted on a fixed stage within the microscope. Optical observations were made as follows:
2.4.Measurement of Cellular Numbers and CD207 Expression of Langerhans Cells Labeled with Alexa Fluor 647-Rat Anti-Mouse CD207LCs are located at an average depth of .20 We collected the acquired images from the skin at a depth of 15 μm and from the DLN specimens from the mice that received EC sensitization on day one (D1) and on day five (D5), respectively. A total of 10 images and six fields randomly chosen within each image were selected from each mouse for analysis. Multiple measurements of the same image are counted as independent samples. In brief, optical sectioned images were saved as uncompressed 8-bit grayscale tiff files and analyzed using the NIH Image software program (NIH Image J 1.44). Signal levels were converted to a numerical value using a grayscale from 0 (white) to 255 (black). The background noise was subtracted from all acquired values. Cell numbers were measured using the Particles function of ImageJ, where a single value is entered and particles smaller than that value are then ignored. We used 10 μm and particles (actually cells) smaller than that value were ignored.20 To include every possible cell, we kept circularity at the default 0.00 to 1.00. Before analysis, we checked all the counted particles shown as numbered outlines using the “show” function, and compared that with the original image. The density of LCs was also determined (). The quantitative analysis of TPF emitted from the Alexa Fluor 647-rat anti-mouse CD207 has been described previously.19 To account for variations in the grayscale intensity due to possible nonuniformity of skin and/or lymph node tissue, mean gray values (MGVs, average gray value within the region of interest) were measured to determine the levels of TPF. 2.5.Statistical AnalysisData are expressed as deviation, unless otherwise specified. The comparison of the cell counts and the relative TPF intensity among groups were expressed as median (the 50th percentile) and interquartile range (the range of values between the 25th and 75th percentile of distribution) and were statistically analyzed using a nonparametric Mann-Whitney test. All statistical analyses were performed with Prism software (Graph Pad, San Diego, CA). A value of less than 0.05 was considered to indicate a statistically significant difference. 3.Results3.1.Observation of MHC Class II Expressing Cells Labeled with Alexa Fluor 700-Rat Anti-mouse MHC Class II mAbHuman and mouse DCs in the epidermis are easily identified based on the surface expression of the MHC class II molecules. We took advantage of the nonlinear two-photon fluorescence (TPF) from Alexa Fluor 700 under an excitation wavelength of 1230 nm of the Cr:forsterite femto-second (fs) laser.19,21 A typical emission spectrum acquired from Alexa Fluor 700 conjugated mAb against MHC class II was measured [Fig. 1(a)]. We acquired sequential images along the plane from the surface of the fixed skin. We found some red spot signaling located within the epidermis [Fig. 2(a) to 2(c)]. We confirmed the nonlinear signal by verifying that the TPF signals we observed had a central emission wavelength around 703 nm. We repeated our experiment in vivo. We observed the same characteristic distribution of red spot signals outlining some cellular morphology within the epidermis [Fig. 2(d) to 2(e)]. We measured the -sectioned nonlinear images in the skin of live mice and confirmed that these red spot signals were located at the basal epidermis [Fig. 2(f)]. Next we examined intact lymph nodes by Cr:forsterite laser-based nonlinear microscopy to determine their suitability for lymph nodes imaging. We acquired sequential images along the -axis from the surface of the fixed DLN. Some red signals representing the TPF from the Alexa Fluor 700-rat anti-mouse MHC Class II molecules were present in the inner paracortex area, a T cell-rich zone (Fig. 3).22,23 Deduced from their locations, these brightly stained cells within skin and DLN might be some MHC class II expressing cells, including DCs and LCs. Fig. 1Emission spectra obtained from the skin surface () of mice under excitation wavelength 1230 nm of the Cr:forsterite fs laser. (a) emission spectrum of TPF acquired from Alexa Fluor 700-rat anti-mouse MHC Class II mAb with the peak emission wavelength at 703 nm; (b) emission spectrum of TPF acquired from Alexa Fluor 647-rat anti-mouse CD207 mAb with the peak emission wavelength at 677 nm. The Alexa Fluor 700-rat anti-mouse MHC Class II mAb and Alexa Fluor 647-rat anti-mouse CD207 mAb used for molecular labeling were injected 6 h before in vivo imaging in a concentration of mice body weight. BALB/c mice were anesthetized and the hairs of their skin were removed. The objectives were in contact with the skin of the mice, and their interface was rinsed with distilled water. Optical sectioning of mice skin was carried out on the lateral side of the abdomen. Under the excitation wavelength 1230 nm of the Cr:forsterite fs laser, the backward propagation TPF was collected into a monochrometer (SpectraPro-150, Roper Scientific) and recorded by a TE-cooled CCD detector (DV42-0E, Andor Technology). The monochrometer is SpectraPro-150 spectrograph with a wavelength range of 0 to 1400 nm, yielding a resolution of 0.4 nm or better. in μm measured from the surface of capsule. The intensity counts are in arbitrary unit. TPF (two-photon fluorescence). 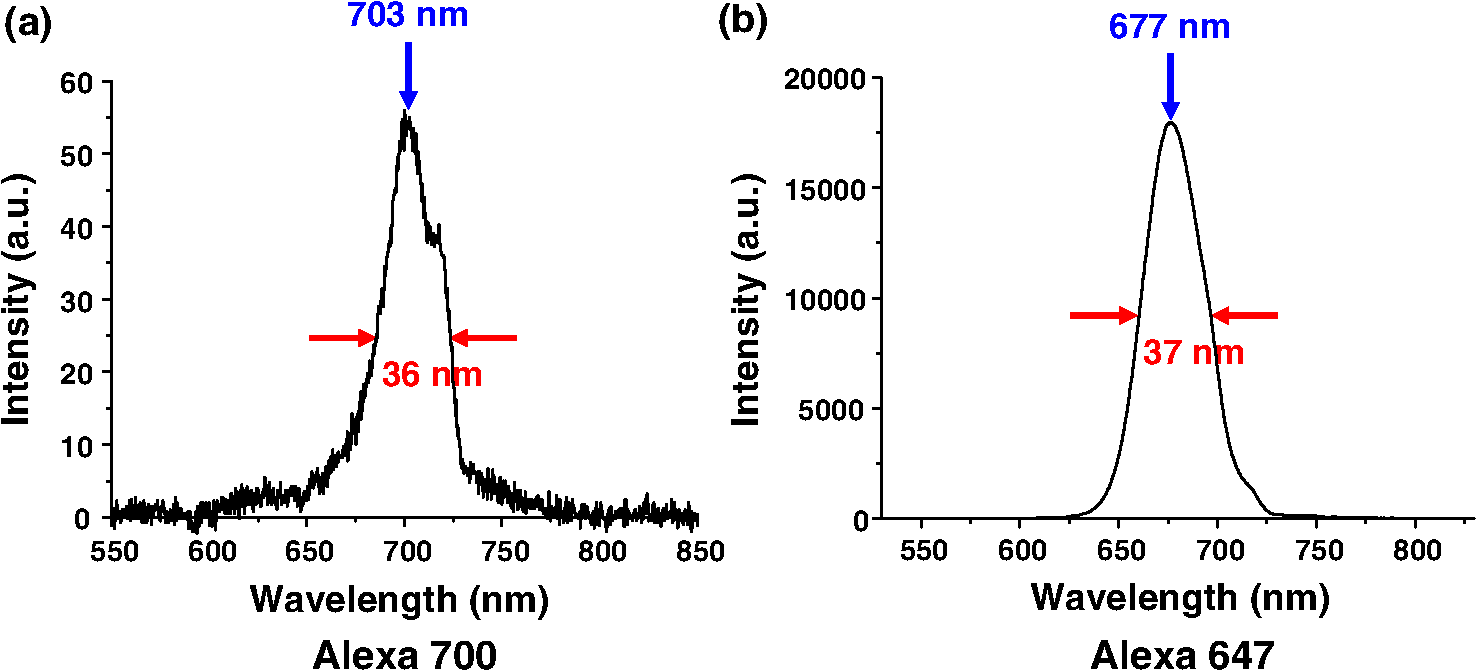 Fig. 2Multimodal nonlinear images from skin of BALB/c mice received Alexa Fluor 700-rat anti-mouse MHC Class II mAb. (a) to (c) The plane sectioning images from the basal epidermis (a); epidermo-dermal junction (b); and superficial dermis (c) of fixed skin, respectively. Some red spot mapped by TPF signals are noted within the epidermis mapped by THG signals (blue) and the upper dermis is mapped by SHG signals (green). (d) to (e) The plane sectioning images from the epidermo-dermal junction of skin in vivo; (f) the plane sectioning images from the whole layer of skin in vivo. The red spot signals located near the spinosum layer of epidermis is noted. in μm measured from skin surface. Scale bar: 20 μm. Data are representative images of three mice. 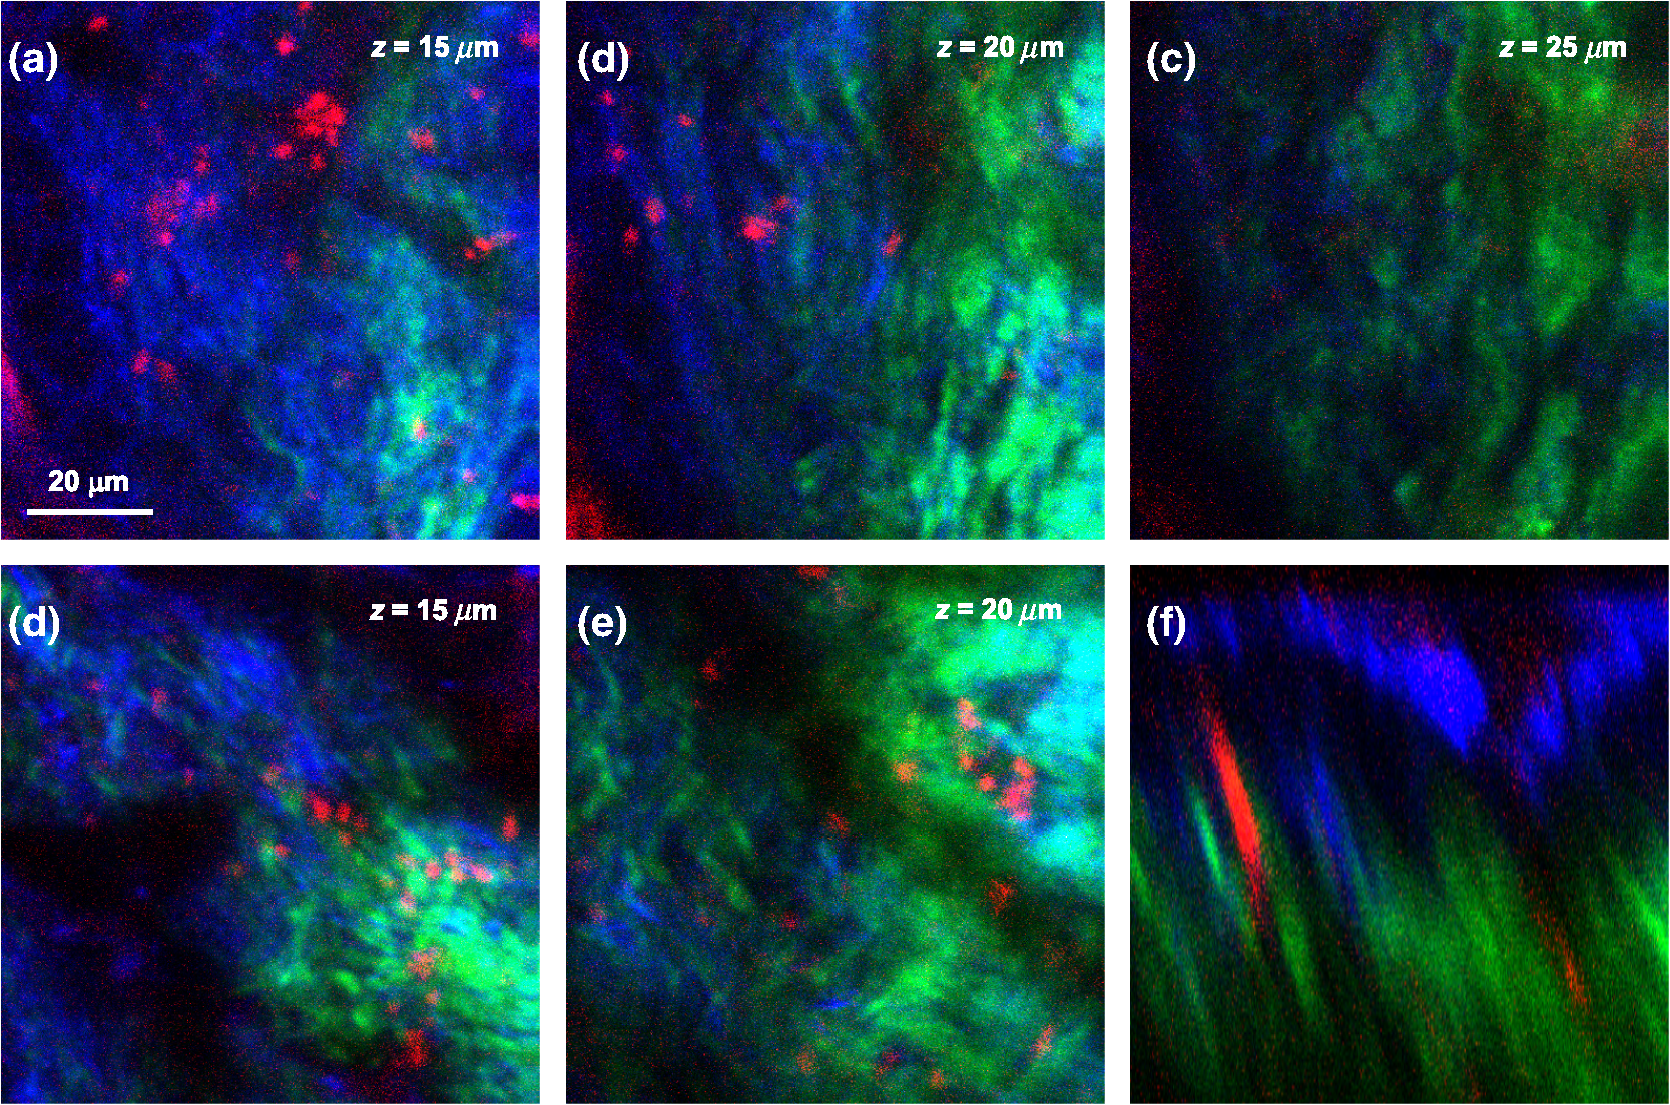 Fig. 3Multimodal nonlinear images from skin-draining lymph node of BALB/c mice received Alexa Fluor 700-rat anti-mouse MHC Class II mAb. Representative plane sectioning images of at various depths of fixed lymph node. The THG signals (blue) outlining the parenchyma of the lymph node are noted. The red TPF signals outlining the cellular morphology with some dendrites (yellow arrow) are clustered mainly within the inner paracortex area. in μm measured from skin surface. Scale bar: 40 μm. Data are representative image of three mice in each group. sc, superficial cortex; pc, paracortex; m, medullary sinus; THG, third harmonic generation. 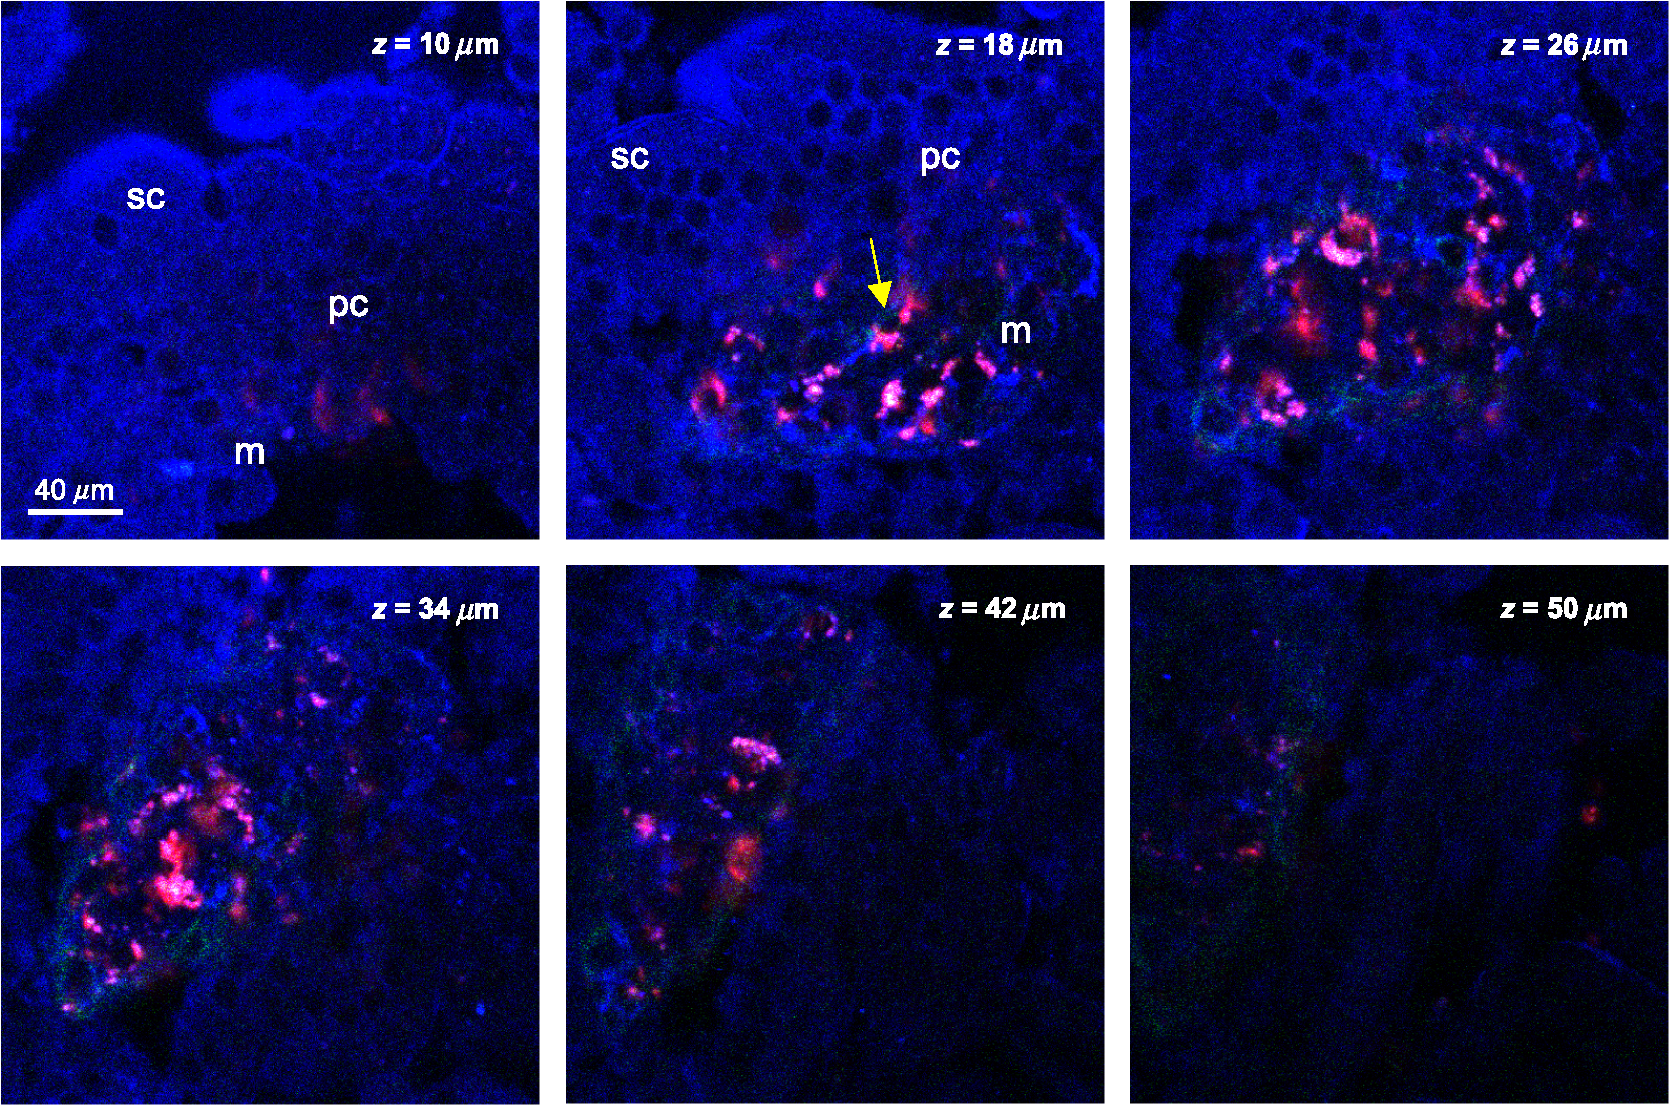 3.2.Observation of CD207 Expressing LCs Labeled with Alexa Fluor 647-Rat Anti-mouse CD207 mAbCD207 is a marker that persists during LC maturation and migration and can therefore be used as a tracer.22 By intraperitoneally injecting Alexa Fluor 647-rat anti-mouse CD207 mAb into mice as our fluorescent probe, we could trace the TPF signal from Alexa Fluor 647. A typical emission spectrum acquired from the skin surface is shown in [Fig. 1(b)]. We acquired sequential sectioned images along the plane from the surface of the fixed skin and found some cells with extending dendrites located within the epidermis (Fig. 4 and Video 1). We confirmed the nonlinear signal by verifying that the TPF signals we observed had a central emission wavelength around 677 nm. To verify the specificity of the labeling of CD207 and of the imaging of LCs, we use the Alexa Fluor 647-rat IgG2a isotype control (IC) mAb. We did not observe any fluorescent signals representing the TPF from the fluorescent dye Alexa Fluor 647 in the mice group receiving IC mAb (data not shown). We found that the average size of the cell body of LCs was . The average epidermal LC density was , similar to the reported value of .20,22 We verified that our technique could specifically image and trace the LCs in situ, aiding to investigate the maturation and migration process of LCs under the real physiological and pathological conditions. Fig. 4Multimodal sequential sectioning images along the plane from the surface of the fixed skin of BALB/c mice received Alexa Fluor 647-rat anti-mouse CD207 mAb. The morphology, approximated size and distribution of LCs are outlined by the TPF (light green) from the Alexa Fluor 647-rat anti-mouse CD207 mAb. The average size of the cell body of LCs were . LCs within the epidermis are distributed evenly at a density of around . The autofluorescence (white) associated with the thickened stratum corneum of epidermis mapped by THG signals (purple) are observed.19 in μm measured from skin surface. Scale bar: 60 μm. Data are representative image of three mice. 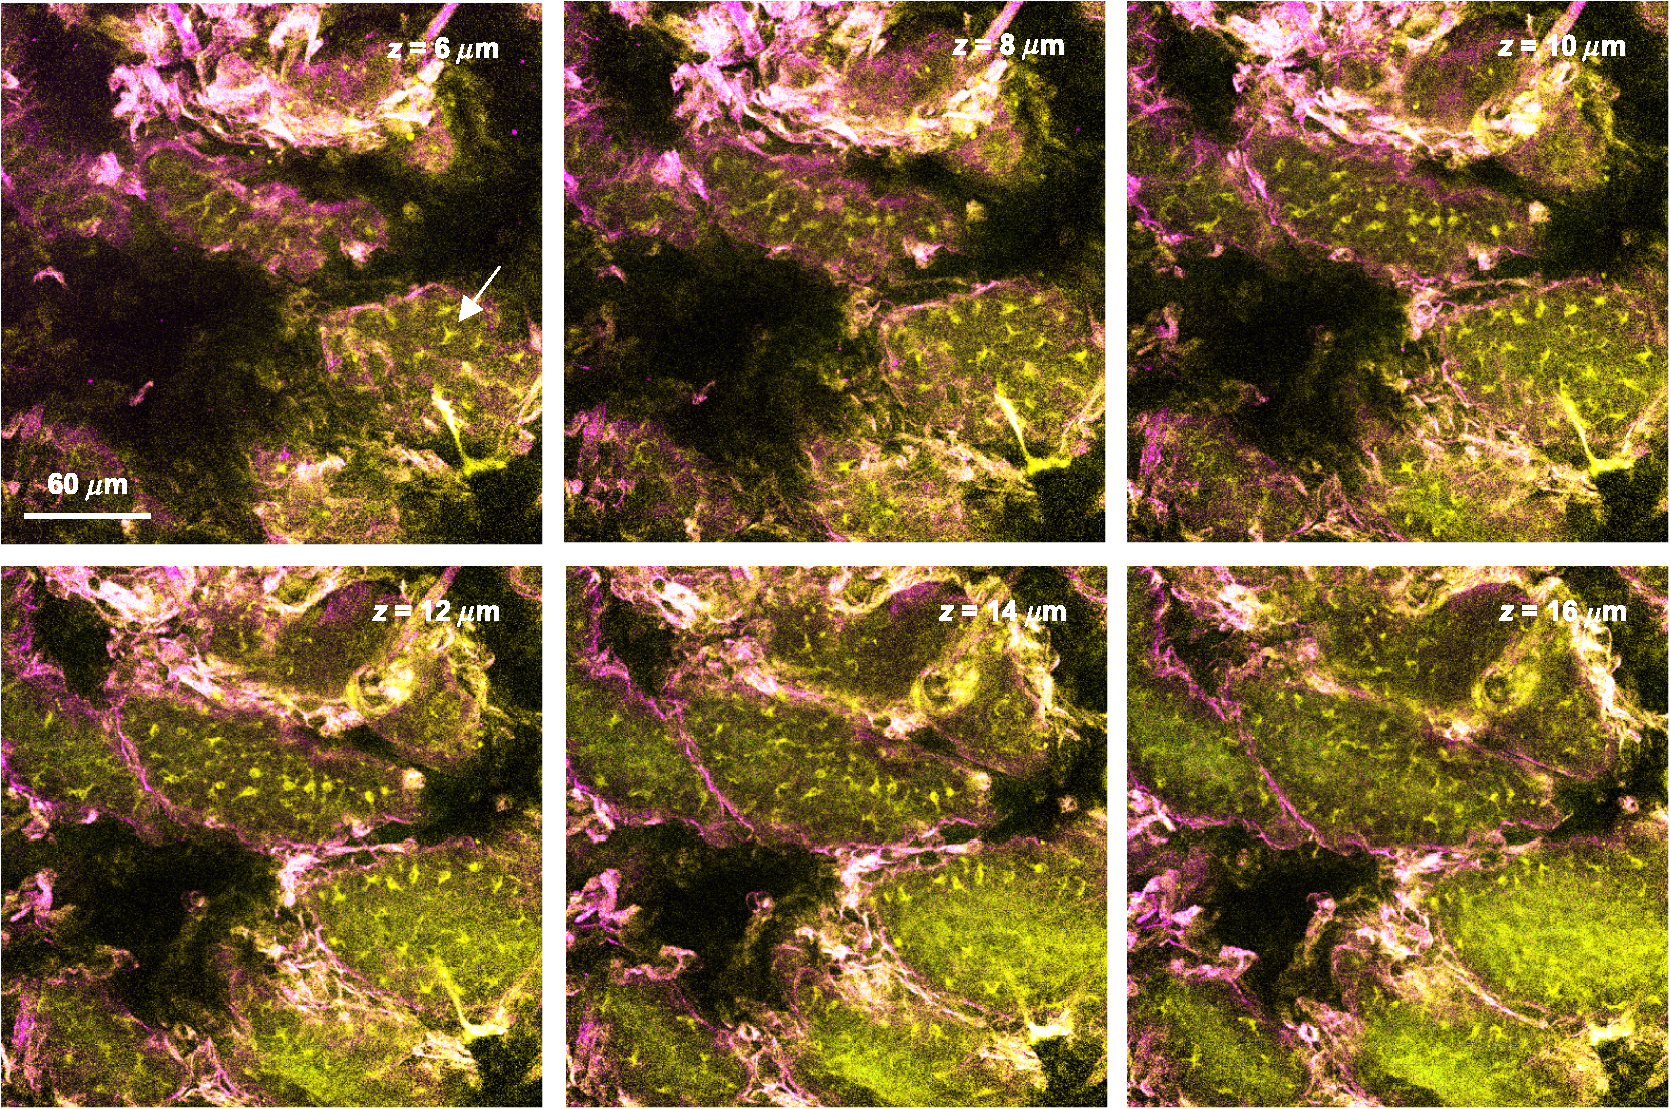 Video 1In vitro movies of depth-resolved plane sectioning images from the normal skin of BALB/c mice received Alexa Fluor 647-rat anti-mouse CD207 mAb. The epidermis is mapped by THG (purple) signals. The autofluorescence (white) associated with the thickened stratum corneum of epidermis are observed. The dermis is mapped by SHG (green) signals. The CD207-expressing LCs is mapped by TPF (yellow) signals. The CD207-expressing LCs observed in the epidermis are in groups and displayed the typical morphology of many extruding dendrites (MOV, 11.8 MB) [URL: http://dx.doi.org/10.1117/1.JBO.17.11.XXXXXX.1].  3.3.Comparison of Cellular Counts and Relative CD207 Expression of LCs Between OVA-Treated and OVA-Untreated Skin and DLNsLCs may have an important role in the initiation of AD.24 We use OVA EC sensitization to induce an inflammatory skin mimic AD to explore the role of CD207-expressing LCs in the initiation of allergen induced skin sensitization. We used the -plane nonlinear images taken from fixed skin and lymph node samples of mice received EC sensitization and Alexa Fluor 647-rat anti-mouse CD207 mAb for quantitative analysis. The LC counts and the relative expression levels of CD207 represent by relative TPF intensity measured by optical analysis of the acquired images were compared [Fig. 5(a) to 5(d)]. Fig. 5Comparison of the number of CD207-positive LCs and the expression of CD207 between the D1, D5, and between the OVA-untreated and OVA-treated skin: (a) The number of CD207-positive LCs within skin. The number of D5 OVA-treated skin is decreased compared to that of D1; (b) the number of CD207-positive LCs within DLN. The number of D5 OVA-treated side is increased compared to that of the D5 untreated side; (c) the relative expression of CD207 on LCs within skin. On D1, the relative expressions of OVA-treated side skin are decreased compared to that of untreated side; (d) the relative expression of CD207 on LCs within DLN. Note that on D5, the relative expressions of OVA-treated DLN are increased than those of untreated side. Data are expressed as median (horizontal lines) and interquartile range (the range of values between the 25th and 75th percentile of distribution). Counting area: . , , . Data are representatives of three experiments.  LC counts in skin and DLNs. We observed decreased counts of epidermal LCs in D5 OVA-treated skin compared to D1 OVA-treated skin (D5 treated versus D1 treated ) [Fig. 5(a)]. We observed an increased number of LCs in DLN of OVA-treated skin on D5 (D5 treated versus D5 untreated ) [Fig. 5(b)]. Our result indicated that both the decreased LCs within the OVA-treated skin and the increased LCs arrived the DLNs were associated with the dynamic migration of LCs after OVA-induced EC sensitization. Relative CD207 expressions in skin and DLNs. The relative CD207 expression in the OVA-treated skin was decreased compared to that in the OVA-untreated skin on D1 (D1 treated versus D1 untreated ) [Fig. 5(c)]. The relative CD207 expression levels in the DLNs of OVA-treated skin were increased on D5 (D5 treated versus D5 untreated ) [Fig. 5(d)]. Our result indicated that both the decreased CD207 expression of LCs within the OVA-treated skin and the increased CD207 expression of LCs arrived the DLNs were relevant to the functional phenotype of LCs after OVA-induced EC sensitization. 3.4.In Vivo Imaging of Cells Within Normal and D1 OVA-Treated SkinTo determine whether we could trace and image the LCs in vivo, we intraperitoneally injected Alexa Fluor 647-rat anti-mouse CD207 mAb into mice, and sectioned images were acquired 6 h later. We observed some LCs within the epidermis of OVA-untreated mice [Fig. 6(a) and Video 2], but we did not find any LCs in the epidermis of mice received injection of Alexa Fluor 647-rat IgG2a IC mAb [Fig. 6(a)]. Fig. 6Multimodal sectioning images from the surface of the skin of BALB/c mice received intraperitoneally injected Alexa Fluor 647-rat anti-mouse CD207 mAb in vivo. Images were acquired with the application of long-pass emitter LF635/LP-A-000; (a) The representative sequential images along the plane of normal skin. The epidermis is mapped by THG (purple) signals. The dermis is mapped by SHG (green) signals. Simultaneous image of TPF signal, SHG signal, and THG signal are displayed. Some cells are observed in the epidermis and few in the dermis (white arrow). In the isotype control (IC) group, no TPF signals of cells are observed in both epidermis and dermis. in μm measured from skin surface; (b) the representative sequential images along the plane of D1 OVA-treated skin. No cells are observed in the epidermis. In contrast, some yellow signals representing TPF from cells (white arrow) are detected within the dermis of the D1 OVA-treated skin; (c) the representative plane sectioning images from the whole layer of D1 OVA-treated skin. The epidermis is mapped by THG (purple) signals. The dermis is mapped by SHG (green) signals. The sectioning images along plane as indicated by purple and yellow lines are shown on the right and button side, respectively. The characteristic distribution of the yellow TPF signals representing cells located within dermis was noted. Data are representative image of three mice. Scale bar: 60 μm.  Video 2In vivo movies of depth-resolved plane sectioning images from the normal skin of BALB/c mice received Alexa Fluor 647-rat anti-mouse CD207 mAb. The epidermis is mapped by THG (purple) signals. The dermis is mapped by SHG (green) signals. The CD207-expressing LCs was mapped by TPF (yellow) signals. Simultaneous image of TPF signal (upper left, yellow color), SHG signal (upper right, green color), and THG signal (lower central, purple color) are displayed. Most of CD207-expressing LCs are observed in the epidermis and a few in the dermis (MOV, 255 KB) [URL: http://dx.doi.org/10.1117/1.JBO.17.11.XXXXXX.2].  In the following experiment we selected the long-pass emitter LF635/LP-A-000 to specifically collect the fluorescent signals of emission wavelength , e.g., those from Alexa Fluor 647-rat anti-mouse CD207 mAb ( under excitation wavelength 1230 nm), and to omit the signals from SHG with .19 Thus we were able to more specifically collect the fluorescent signals emitted from the Alexa Fluor 647-rat anti-mouse CD207 mAb; thus we were suitable for explore the physiological conditions within the dermis which were mapped by SHG. When we observed the epidermis of D1 OVA-treated skin, we found nearly no LCs in the epidermis; however, there were cells intercalated among collagen fibers [Fig. 6(b) and Video 3]. We acquired the and plane sectional images simultaneously and found that the CD207-expressing cells were located within the superficial layer of the dermis [Fig. 6(c) and Video 3]. Interestingly, Soumelis et al. reported that many LCs were found only within the epidermis of normal skin while many CD207-expressing DCs were found within the dermis of lesional skin.25 Similar patterns of distribution of cells were observed in our experiment, suggesting that these cells may be epidermal LCs that migrated to the dermis or the occurrence of dermal DCs within the OVA sensitized skin. Video 3In vivo movies of depth-resolved plane sectioning images from the D1 lesional skin of BALB/c mice received Alexa Fluor 647-rat anti-mouse CD207 mAb. The epidermis is mapped by THG (purple) signals. The dermis is mapped by SHG (green) signals. The CD207-expressing LCs is mapped by TPF (yellow) signals. Simultaneous image of TPF signal (upper left, yellow color), SHG signal (upper right, green color), and THG signal (lower central, purple color) are displayed. No CD207-expressing LCs are observed in the epidermis while many CD207-expressing LCs are detected within the dermis (MOV, 749 KB) [URL: http://dx.doi.org/10.1117/1.JBO.17.11.XXXXXX.3].  3.5.In Vivo Imaging of OVA Within Normal Skin and Ex Vivo Imaging of OVA in Skin DLNsIn an attempt to directly measure the antigen capturing capabilities of DCs in vivo, we administered OVA-Alexa Fluor 647 conjugate into BALB/c mice via the intraperitoneal route, and sectioned images were acquired 6 h later. Again, we use the long-pass emitter LF635/LP-A-000 to specifically collect the fluorescent signals emitted from the OVA-Alexa Fluor 647 conjugate under the physiological conditions. We did not observe any fluorescent signal from the epidermis; however, we did find many clusters of fluorescent signals from the OVA-Alexa Fluor 647 conjugate within the dermis [Fig. 7(a) and Video 4]. We acquired the and plane sectional images simultaneously and found that these OVA were located within the superficial dermis [Fig. 7(b)]. Recently, it has been reported that after subcutaneous injection of FITC-OVA probes, which accumulated in dermal cells but not in epidermal cells.26 Our approach showed the similar result that redistribution of systemic sensitizing Ag into skin were within the dermis. Fig. 7Multimodal sectioning images from the surface of the skin of BALB/c mice received intraperitoneally injected OVA-Alexa Fluor 647 conjugate in vivo. Images were acquired with the application of the long-pass emitter LF635/LP-A-000; (a) the representative sequential images along the plane. The epidermis is mapped by THG (purple) signals. The dermis is mapped by SHG (green) signals. Simultaneous image of TPF signal, SHG signal, and THG signal are displayed. No OVA-carrying cells are observed in the epidermis due to lack of TPF signal from OVA-Alexa Fluor 647 conjugate. In contrast, some yellow TPF signals representing OVA-carrying cells are detected within the dermis of skin (white arrow). SHG (second harmonic generation); THG (third harmonic generation); TPF (two-photon fluorescence); (b) the representative plane sectioning images from the whole layer of skin. The epidermis is mapped by THG (purple) signals. The dermis is mapped by SHG (green) signals. The sectioning images along plane as indicated by the purple and yellow lines are shown on the right and button side, respectively. The characteristic distribution of the yellow TPF signals representing OVA-capturing cells located within dermis is noted. Data are representative image of three mice. Scale bar: 60 μm. in μm measured from skin surface.  Video 4In vivo movies of depth-resolved plane sectioning images from the abdominal skin of BALB/c mice received OVA-Alexa Fluor 647. The epidermis is mapped by THG (purple) signals. The dermis is mapped by SHG (green) signals. The OVA-carrying cells are mapped by TPF (yellow) signals. Simultaneous image of TPF signal (upper left, yellow color), SHG signal (upper right, green color), and THG signal (lower central, purple color) are displayed. No OVA-carrying cells are observed in the epidermis. In contrast, some OVA-carrying cells are detected within the dermis of skin (MOV, 963 KB) [URL: http://dx.doi.org/10.1117/1.JBO.17.11.XXXXXX.4].  We then observe the excised skin DLNs ex vivo and found many signals of OVA-Alexa Fluor 647 conjugate from the cells within outer and inner paracortex (Fig. 8 and Video 5), suggesting the accumulated OVA-carrying cells within the DLNs after application of OVA-Alexa Fluor 647 conjugate.23 Thus we confirmed that Cr:forsterite laser-based nonlinear microscopy complemented with exogenous fluorescent probe could detect the antigen-carrying cells or the occurrence of antigen within skin and LNs. Fig. 8Multimodal sequential sectioning images along the plane at various depths of the fixed skin-draining lymph node of BALB/c mice received intraperitoneally injected Ovalbumin-Alexa Fluor 647 conjugate in vivo. Images were acquired with the application of the long-pass emitter LF635/LP-A-000. Images of the upper and lower row are from different skin-draining lymph node. Note the yellow TPF signals representing CD207-expressing LCs are detected within the skin-draining lymph node (white arrow). in μm measured from the surface of capsule. Data are representative image of three mice. Scale bar: 60 μm.  Video 5Ex vivo movies of depth-resolved plane sectioning images from the skin DLN of BALB/c mice received OVA-Alexa Fluor 647 conjugates. Simultaneous image of TPF signal (upper left, yellow color), SHG signal (upper right, green color), and THG signal (lower central, purple color) are displayed. The capsule is mapped by some THG signal representing the epithelium and few SHG signals representing the connective tissue. The honeycomb shape area within the capsule might be the adipose tissue surrounding the connective tissue of capsule. Following the capsule, there is an area showing dense and light TPF signal of OVA-Alexa Fluor 647 conjugates from the dermal DCs within the outer paracortex.23 Following the outer paracortex, there is an area showing sparse and dim TPF signal of OVA-Alexa Fluor 647 conjugates from the migratory LCs within the inner paracortex23 (MOV, 521 KB) [URL: http://dx.doi.org/10.1117/1.JBO.17.11.XXXXXX.5].  3.6.Co-Localization of OVA with CD205-Expressing Dendritic Cells in Skin DLNsCD207 was frequently co-expressed with CD205.27 We first injected Alexa Fluor 700-rat anti-mouse CD205 mAb intraperitoneally and injected OVA-Alexa Fluor 647 conjugate 6 h later. We used the long-pass emitter E700lp to collect the fluorescent signals emitted from the Alexa Fluor 700-rat anti-mouse CD205 mAb ( under excitation wavelength 1230 nm), and the short-pass emitter E700sp-2p to collect the fluorescent signals emitted from the OVA-Alexa Fluor 647 conjugate. We found that the yellow signal from OVA-Alexa Fluor 647 conjugate were adjacent to the red signal from Alexa Fluor 700-rat anti-mouse CD205 mAb (Fig. 9 upper panel). When we merged the images obtained from different emitters, we observed that there was an overlap between populations of cells expressing CD205 and populations of OVA-capturing cells in most of field (Fig. 9, lower panel), implying that cells co-expressing CD207 are capable of uptake OVA-Alexa Fluor 647 conjugate and transport it to the DLN for initiation of the specific T cell immune response. Fig. 9Co-localization of OVA-Alexa Fluor 647 conjugate with Alexa Fluor 700-rat anti-mouse CD205 labeled DCs within the skin-draining lymph nodes. The TPF signal (yellow color) emitted from OVA-Alexa Fluor 647 conjugate with a wavelength below 700 nm are collected by the short-pass emitter E700sp-2p. The TPF signal (red color) emitted from Alexa Fluor 700-rat anti-mouse CD205 labeled DCs with a wavelength above 700 nm are collected by the long-pass emitter E700lp. The upper panel shows an artificial “shift” when image were acquired from two different emitters. Note the yellow and red fluorescent signals are nearly total merged in the lower panel images. Images of the upper and lower panel are from different skin-draining lymph node. Data are representatives of three experiments. 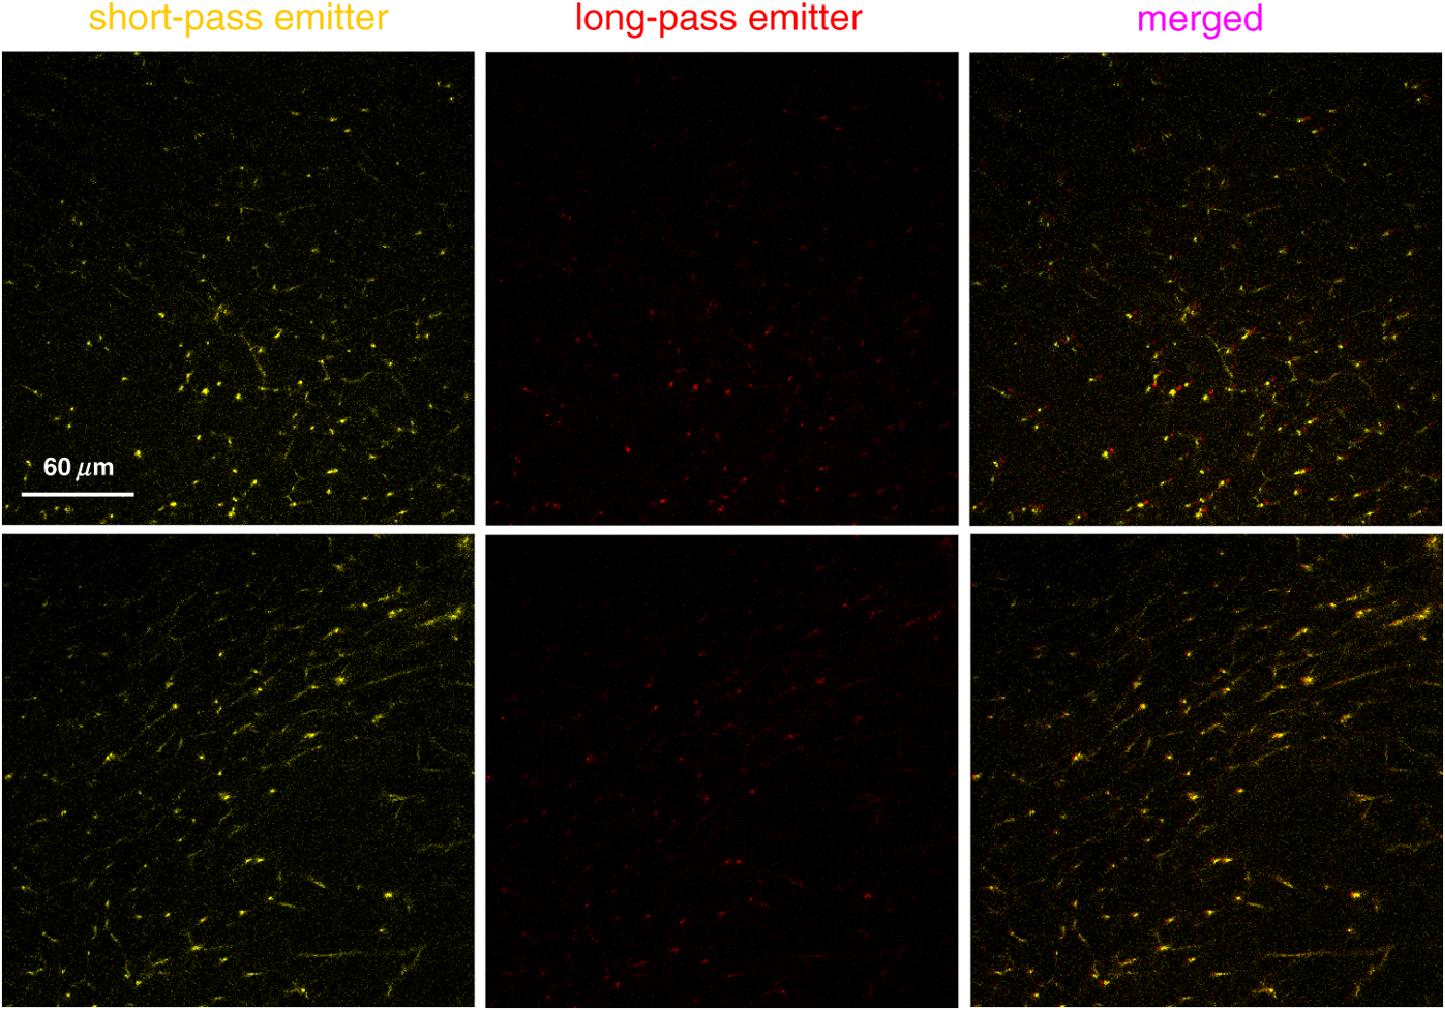 4.DiscussionThere are two major methods for in vivo imaging of live tissues, cells, or molecules. One approach is to introduce fluorescent proteins YFP or GFP, which selectively target the tissue of interest in transgenic mice to highlight various cellular or molecular features.28 The other approach is to take advantage of endogenous molecules (e.g., NADPH), which provides valuable information on the tissue architecture without the need for exogenous labeling.29 The drawback of the fluorescent proteins method is the inability to quantify the expression levels of molecules of interest. The endogenous molecules method lacks specificity, and only limited molecules are available. Our technique provides two levels of specificity. First, the molecules are specifically recognized by the mAb, and the nonspecific binding effects of the Alexa Fluor 647-rat anti-mouse CD207 were controlled because no LCs were seen within the Alexa Fluor 647-rat IgG2a isotype control mAb group [Fig. 6(a)]. Second, only the limited exogenous fluorophores (e.g., Alexa Fluor 647) are excited under Cr:forsterite laser-based nonlinear microscopy because much of the autofluorescence from endogenous fluorophores was reduced.19 Our method is a promising approach that could be used to unequivocally identify and track LCs by in vivo imaging. We were limited by the fact that the resolution of some images shown appears rather low. Besides, we could stain LCs in fixed skin samples (Fig. 4), but only a few LCs in skin of live mice (Fig. 6). The reason was fluorescence changes associated with tissue fixation.19 This discrepancy of imaging reflects the difference in biophysical properties of epidermis between the live and the dead/fixed skin of mice, hence the different TPF intensities from CD207 mAb-conjugated Alexa Fluor 647. Prerequisite roles of skin DCs and potentially of LCs in the development of AD have been suggested.24 An increase in LC proliferation has been reported to be required to induce the Th2 polarization of T cells and maintain disease.30 Our data demonstrated an increased number of LCs in the DLNs in the later sensitization phase on D5.23 The dynamic changes of LCs seen in our results are associated with the EC sensitization course. It is interesting to note that found some occurrences of migratory LCs or dermal DCs within the dermis of the mice. All published descriptions of dermal DCs have so far been in the mouse.31 In the LC paradigm, no distinctions could be drawn between epidermal LCs en route through the dermis and the novel dermal DCs in situ. It turned out that these dermal DC in the dermis were a dermis-resident population, unrelated to LC, and they can be readily detected in the draining lymphoid organs called lymph-node-resident DCs.31 Our results confirm a similar result in that a decrease and/or disappearance of LCs in the epidermis was directly correlated with the increased number of LCs or dermal DCs in the superficial dermis and in the DLNs.32 We suggest LCs play some role in the initiation of OVA induced skin sensitization use EC sensitization. Our model used here is only a model of epicutaneous sensitization induced inflammatory skin. Our study were similar to Spergel et al. that the epidermal layer was approximately three to five cell layers thick in OVA sensitized sites compared with two to three cell layers thick in saline sensitized sites.19,33 Although our model is different from the originally described model,33 the epidermal hyperkeratosis/thickening and dermal fibrosis shown here indicated that our murine model shared the characteristic cutaneous inflammatory response associated with AD. In our paper, we used Alexa Fluor fluorophores for molecular labeling and in vivo imaging, so the toxicity of Alexa fluor used should be addressed. A review of published literature on the toxicity of some widely used fluorophores was conducted by searching 26 comprehensive biomedical and chemical literature databases and analyzing the retrieved material.34 The Alexa Fluor fluorophores were searched without accompanying toxicity-related reports. Besides, no toxicity or developmental abnormalities resulting from treatment with Alexa Fluor 647 conjugate were observed in an in vivo imaging experiment of developing zebrafish.35 The Alexa fluorophores we used were administrated into mice in vivo. However, applying these fluorophores to patients and determining the safe dose of these fluorophores will require further clinical and laboratory investigation. With Alexa-Fluor 647 conjugates used as a tracer, we showed the dynamic migration and functional phenotype of cells and the existence and encounter of OVA. We showed that LCs are present in the skin and that they migrate to the DLN upon OVA induced EC sensitization. The distribution of OVA upon intraperitoneal injection and co-localization of OVA with LCs in DLN has been readily demonstrated by our data. The respective data generated by Cr:forsterite laser-based multimodality nonlinear microscopy validate our method and the sensitization model, but also give new insights into that CD207 plays any role of allergen uptake in the development of allergic sensitization in human beings such as AD. Our approach using Cr:forsterite laser-based nonlinear microscopy complemented with an exogenous fluorescent probe demonstrates the potential to do flow cytometry and to perform immunohistochemistry (IHC) in vivo, which might be applied to real-time and specific detection of antigens/allergens and to evaluate the interaction between immune cells in the skin and in the lymph node in vivo. AcknowledgmentsThe authors would like to acknowledge the support from the National Science Council of Taiwan under NSC 99-2314-B-002-024-MY3, the National Taiwan University Hospital under NTUH 099-001394 and the NTU Research Center for Medical Excellence. ReferencesD. Y. M. LeungT. Bieber,
“Atopic dermatitis,”
Lancet, 361
(9352), 151
–160
(2003). http://dx.doi.org/10.1016/S0140-6736(03)12193-9 LANCAO 0140-6736 Google Scholar
E. B. Mitchellet al.,
“Increase in skin mast cells following chronic house dust mite exposure,”
Br. J. Dermatol., 114
(1), 65
–73
(1986). http://dx.doi.org/10.1111/bjd.1986.114.issue-1 BJDEAZ 1365-2133 Google Scholar
N. NovakT. BieberD. Y. M. Leung,
“Immune mechanisms leading to atopic dermatitis,”
J. Allergy Clin. Immunol., 112
(6 Suppl.), S128
–S139
(2003). http://dx.doi.org/10.1016/j.jaci.2003.09.032 JACIBY 0091-6749 Google Scholar
M. MeradF. GinhouxM. Collin,
“Origin, homeostasis and function of Langerhans cells and other langerin-expressing dendritic cells,”
Nat. Rev. Immunol., 8
(12), 935
–947
(2008). http://dx.doi.org/10.1038/nri2455 NRIABX Google Scholar
K. Kerschenlohret al.,
“Atopy patch test reactions show a rapid influx of inflammatory dendritic epidermal cells in patients with extrinsic atopic dermatitis and patients with intrinsic atopic dermatitis,”
J. Allergy Clin. Immunol., 111
(4), 869
–874
(2003). http://dx.doi.org/10.1067/mai.2003.1347 JACIBY 0091-6749 Google Scholar
N. S. StambachM. E. Taylor,
“Characterization of carbohydrate recognition by langerin, a C-type lectin of Langerhans cells,”
Glycobiology, 13
(5), 401
–410
(2003). http://dx.doi.org/10.1093/glycob/cwg045 GLYCE3 1460-2423 Google Scholar
J. Valladeauet al.,
“The monoclonal antibody DCGM4 recognizes Langerin, a protein specific of Langerhans cells, and is rapidly internalized from the cell surface,”
Eur. J. Immunol., 29
(9), 2695
–2704
(1999). http://dx.doi.org/10.1002/(ISSN)1521-4141 EJIMAF 0014-2980 Google Scholar
J. Valladeauet al.,
“Langerin, a novel C-type lectin specific to Langerhans cells, is an endocytic receptor that induces the formation of Birbeck granules,”
Immunity, 12
(1), 71
–81
(2000). http://dx.doi.org/10.1016/S1074-7613(00)80160-0 IUNIEH 1074-7613 Google Scholar
J. Valladeauet al.,
“Identification of mouse langerin/CD207 in Langerhans cells and some dendritic cells of lymphoid tissues,”
J. Immunol., 168
(2), 782
–792
(2002). JOIMA3 0022-1767 Google Scholar
K. Takaharaet al.,
“Identification and expression of mouse Langerin (CD207) in dendritic cells,”
Int. Immunol., 14
(5), 433
–444
(2002). http://dx.doi.org/10.1093/intimm/14.5.433 INIMEN 0953-8178 Google Scholar
A. Ingber,
“Langerhans cell receptors,”
Dermatol. Clin., 25
(4), 559
–562
(2007). http://dx.doi.org/10.1016/j.det.2007.06.019 DERAEG 1018-8665 Google Scholar
A. Elentneret al.,
“Langerhans cells are critical in the development of atopic dermatitis-like inflammation and symptoms in mice,”
J. Cell. Mol. Med., 13
(8B), 2658
–2672
(2009). http://dx.doi.org/10.1111/jcmm.2009.13.issue-8b JCMMC9 1582-4934 Google Scholar
L. Chorroet al.,
“Langerhans cell (LC) proliferation mediates neonatal development, homeostasis, and inflammation-associated expansion of the epidermal LC network,”
J. Exp. Med., 206
(13), 3089
–3100
(2009). http://dx.doi.org/10.1084/jem.20091586 JEMEAV 0022-1007 Google Scholar
N. NovakW. PengC. Yu,
“Network of myeloid and plasmacytoid dendritic cells in atopic dermatitis,”
Adv. Exp. Med. Biol., 601 97
–104
(2007). http://dx.doi.org/10.1007/978-0-387-72005-0 AEMBAP 0065-2598 Google Scholar
T. Bieber,
“Atopic dermatitis,”
Ann. Dermatol., 22
(2), 125
–137
(2010). http://dx.doi.org/10.5021/ad.2010.22.2.125 ANDEEM 1013-9087 Google Scholar
L. Wanget al.,
“Langerin expressing cells promote skin immune responses under defined conditions,”
J. Immunol., 180
(7), 4722
–4727
(2008). JOIMA3 0022-1767 Google Scholar
T. Bieber,
“Atopic dermatitis,”
N Engl J Med., 358
(14), 1483
–1494
(2008). http://dx.doi.org/10.1056/NEJMra074081 Google Scholar
A. H. Liu,
“Innate microbial sensors and their relevance to allergy,”
J. Allergy Clin. Immunol., 122
(5), 846
–858
(2008). http://dx.doi.org/10.1016/j.jaci.2008.10.002 JACIBY 0091-6749 Google Scholar
J. H. Leeet al.,
“Noninvasive in vitro and in vivo assessment of epidermal hyperkeratosis and dermal fibrosis in atopic dermatitis,”
J. Biomed. Opt., 14
(1), 014008
(2009). http://dx.doi.org/10.1117/1.3077182 JBOPFO 1083-3668 Google Scholar
W. J. Mulhollandet al.,
“Multiphoton high-resolution 3D imaging of Langerhans cells and keratinocytes in the mouse skin model adopted for epidermal powdered immunization,”
J. Invest. Dermatol., 126
(7), 1541
–1548
(2006). http://dx.doi.org/10.1038/sj.jid.5700290 JIDEAE 0022-202X Google Scholar
C. K. Sun,
“Higher harmonic generation microscopy,”
Adv. Biochem. Eng. Biotechnol., 95 17
–56
(2005). ABEBDZ 0724-6145 Google Scholar
P. Stoitzneret al.,
“Visualization and characterization of migratory Langerhans cells in murine skin and lymph nodes by antibodies against Langerin/CD207,”
J. Invest. Dermatol., 120
(2), 266
–274
(2003). http://dx.doi.org/10.1046/j.1523-1747.2003.12042.x JIDEAE 0022-202X Google Scholar
A. Kissenpfenniget al.,
“Dynamics and function of Langerhans cells in vivo: dermal dendritic cells colonize lymph node areas distinct from slower migrating Langerhans cells,”
Immunity, 22
(5), 643
–654
(2005). http://dx.doi.org/10.1016/j.immuni.2005.04.004 IUNIEH 1074-7613 Google Scholar
S. DubracM. SchmuthS. Ebner,
“Atopic dermatitis: the role of Langerhans cells in disease pathogenesis,”
Immunol. Cell Biol., 88
(4), 400
–409
(2010). http://dx.doi.org/10.1038/icb.2010.33 ICBIEZ 0818-9641 Google Scholar
V. Soumeliset al.,
“Human epithelial cells trigger dendritic cell mediated allergic inflammation by producing TSLP,”
Nat. Immunol., 3
(7), 673
–680
(2002). NRIABX Google Scholar
R. E. Frugéet al.,
“Real-time visualization of macromolecule uptake by epidermal Langerhans cells in living animals,”
J. Invest. Dermatol., 132
(3 Pt 1), 609
–614
(2012). http://dx.doi.org/10.1038/jid.2011.385 JIDEAE 0022-202X Google Scholar
S. Henriet al.,
“The dendritic cell populations of mouse lymph nodes,”
J. Immunol., 167
(2), 741
–748
(2001). JOIMA3 0022-1767 Google Scholar
R. Weigertet al.,
“Intravital microscopy: a novel tool to study cell biology in living animals,”
Histochem. Cell Biol., 133
(5), 481
–491
(2010). http://dx.doi.org/10.1007/s00418-010-0692-z HCBIFP 0948-6143 Google Scholar
W. R. Zipfelet al.,
“Live tissue intrinsic emission microscopy using multiphoton-excited native fluorescence and second harmonic generation,”
Proc. Natl. Acad. Sci. U.S.A., 100
(12), 7075
–7080
(2003). http://dx.doi.org/10.1073/pnas.0832308100 PNASA6 0027-8424 Google Scholar
L. Chorroet al.,
“Langerhans cell (LC) proliferation mediates neonatal development, homeostasis, and inflammation-associated expansion of the epidermal LC network,”
J. Exp. Med., 206
(13), 3089
–3100
(2009). http://dx.doi.org/10.1084/jem.20091586 JEMEAV 0022-1007 Google Scholar
N. RomaniB. E. ClausenP. Stoitzner,
“Langerhans cells and more: langerin-expressing dendritic cell subsets in the skin,”
Immunol. Rev., 234
(1), 120
–141
(2010). http://dx.doi.org/10.1111/imr.2010.234.issue-1 IMRED2 0105-2896 Google Scholar
S. Taweechaisupaponget al.,
“Langerhans cell density and serological changes following intradermal immunisation of mice with dengue 2 virus,”
J. Med. Microbiol., 45
(2), 138
–145
(1996). http://dx.doi.org/10.1099/00222615-45-2-138 JMMIAV 0022-2615 Google Scholar
J. M. Spergelet al.,
“Epicutaneous sensitization with protein antigen induces localized allergic dermatitis and hyperresponsiveness to methacholine after single exposure to aerosolized antigen in mice,”
J. Clin. Invest., 101
(8), 1614
–1622
(1998). http://dx.doi.org/10.1172/JCI1647 JCINAO 0021-9738 Google Scholar
R. Alfordet al.,
“Toxicity of organic fluorophores used in molecular imaging: literature review,”
Mol. Imaging., 8
(6), 341
–354
(2009). MIOMBP 1535-3508 Google Scholar
S. T. Laughlinet al.,
“In vivo imaging of membrane-associated glycans in developing zebrafish,”
Science, 320
(5876), 664
–667
(2008). http://dx.doi.org/10.1126/science.1155106 SCIEAS 0036-8075 Google Scholar
|


