
|
|
|
Glaucoma, the second leading cause of blindness worldwide,1 is a group of eye diseases that may be characterized by progressive cupping and pallor of the optic nerve. Associated death of the retinal ganglion cell (RGC) axons passing through the optic nerve head (ONH)2 occurs, results in irreversible vision loss. The mechanism responsible for the optic nerve damage in glaucoma remains unknown; however, substantial evidence suggests that compression and distortion of the lamina cribrosa (LC) may contribute to the initial injury of RGC axons.3 The LC is a three-dimensional (3-D) fenestrated collagenous structure consisting of a series of plates within the ONH that span across the nerve to insert into the scleral rim surrounding the nerve. The laminar tissues provide protective support and nutrients to the RGC axons. Intraocular pressure (IOP) and especially the elevated IOP in glaucoma imparts stress and strain on the LC, leading to bowing and stretching of the lamina beams within the LC4 described as cupping of the ONH. Two mechanisms may be involved in injury to the ONH axons. First, stretching and deformation of the lamina beams may directly restrict the nutrient transport to the axons passing through the laminar pores5 giving rise to direct injury of the axons.6 Second, deformation of the laminar beams and alterations in their relationship with the vessels crossing the scleral rim may cause a reduction of the LC capillary blood flow resulting in a reduction or loss of the normal blood supply to the ONH axons. Clinical studies suggest altered perfusion may be a factor in the glaucoma process.7–9 An understanding of these delicate processes requires an improved ability to assess/visualize 3-D microstructure and microcirculation within the ONH in humans in vivo. However, we currently lack crucial information about the microvascular beds in which perfusion is important in glaucoma as well as the appropriate methods to evaluate their blood flow.10 Recently, several technologies have been reported to be capable of providing high-resolution structural images of the LC in vivo; for example, adaptive optics scanning laser ophthalmoscopy (AO-SLO)11,12 and adaptive optics optical coherence tomography (AO-OCT).13 Although the results from these state-of-the-art imaging techniques are exciting and somewhat promising, none of them is capable of providing information about microcirculation (capillary level resolution) within the LC. Optical microangiography (OMAG)14,15 is a functional extension of Fourier domain optical coherence tomography (FDOCT), capable of noninvasively imaging 3-D microstructures and blood flow within microcirculatory tissue beds in vivo. Since its first report,14 OMAG has been further developed to provide ultrahigh sensitivity to image capillary blood flow within tissue beds.16 The OMAG application has been demonstrated in a number of organs in vivo, including both human; e.g., retina17,18 and skin19; rodent models, e.g., brain,20 cochlea,21 and lymph nodes.22 In this paper, we demonstrate for the first time the ability of OMAG to simultaneously image 3-D microstructures and microcirculations within the ONH in humans. The schematic of the OMAG system setup used in this study is shown in Fig. 1(a) and is similar to that described in a prior report.17 Briefly, the system utilized a superluminescent diode (SLD) as the illuminating light source. The SLD had a spectral bandwidth of 45 nm centered at 842 nm, providing an axial resolution of in air. The light source was coupled to a fiber-based Mach-Zehnder interferometer via a fiber coupler. With two optical circulators, 20% of the light was routed to the sample arm and 80% to the reference arm. In the sample arm, the light was delivered into the human eye via a scanning optics setup with a measured light power of at the cornea, the power of which is within the safe ocular exposure limits recommended by the American National Standards Institute (ANSI).23 The scanning optics consisted of a collimator, an galvo-scanner, and an ocular objective lens, which provided a raster-scanning of the probe-beam spot at the retina. The light backscattered from the eye and reflected from the reference mirror was collected and delivered to two laboratory-built high-speed spectrometers via a fiber coupler. The two spectrometers were designed to have almost identical performances in terms of OCT imaging. For each camera, 800 out of 4096 pixels were selected for sensing the spectral interferogram, resulting in a 250 kHz A-scan (depth-scan) rate. By sequentially controlling the two cameras,17 the whole system provided a 500 kHz A-scan rate for the OCT/OMAG imaging. The system used to scan the ONH in this study had a measured sensitivity of and was capable of an imaging rate of 700 frames per second (with 500 A-scans per image frame). Five healthy subjects with no history of ocular diseases were included for this study. Ethical approval was obtained from the Institutional Review Board at the University of Washington and informed consent was obtained from the subjects before participation. The OCT/OMAG images obtained from all five subjects were demonstrated to have similar quality. Below, we report the results from one subject to demonstrate the potential utility of the OMAG in imaging the ONH. Fig. 1(a) schematic of ultrahigh speed OMAG system used in this study, where SLD denotes the superluminescent diode, PC the polarization controller, OC the optical circulator, and M the reflecting mirror. (b) OCT fundus image of the ONH covering an area of , where S denotes superior, N is nasal, I means inferior and T is temporal. 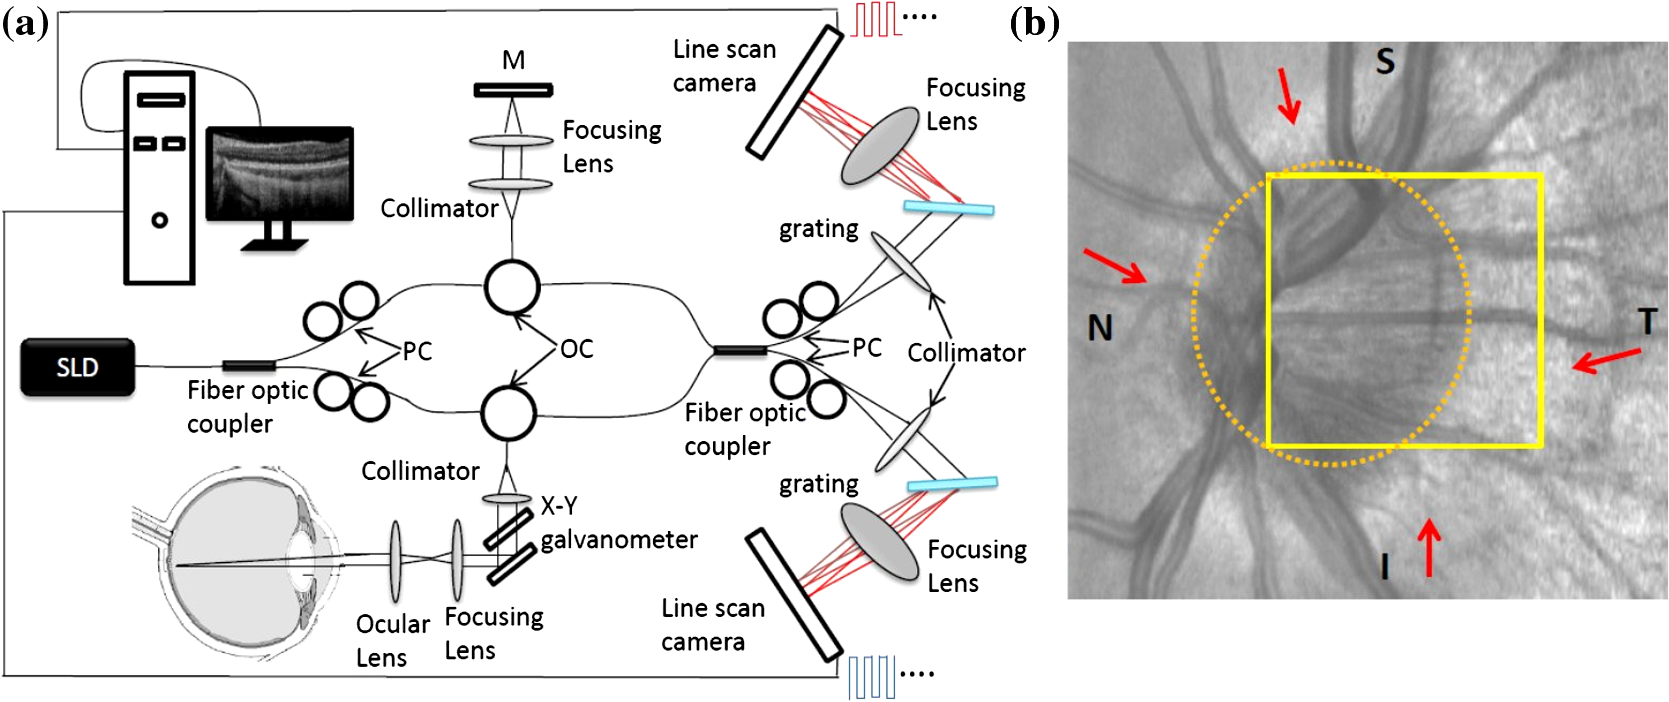 We first captured a volumetric FDOCT image, covering an area of centered on the ONH by the use of a low lateral resolution imaging probe. The probe had an incident beam diameter of , giving a theoretical lateral-resolution of at the retina. The OCT image consisted of and required for the system to acquire. After the collection of this 3-D scan, the OCT A-scans were then integrated along the -axis direction in the ONH to produce an ONH OCT fundus image [Fig. 1(b)].24 In the figure, some important physiological features of the ONH can be clearly identified. Features include the optic disc (seen as a dark disk around a central image, sketched as a dashed-circle), and the scleral rim (seen as a brighter rim around the optic disk, as also identified by the arrows). The distinctive appearance of the ONH blood vessels is also identifiable. However, the image fails to reveal the detailed microstructural and microvascular morphology of the ONH. For better evaluation of the ONH, a high resolution optical imaging probe, with a probe beam diameter at the cornea of approximately 4 mm, was installed in the sample arm to deliver a theoretical lateral resolution of at the ONH. To realize OMAG imaging of the ONH microcirculation, 500 pixels were captured along the fast-scan (X-scan) direction and 1500 B-frames along the slow-scan (Y-scan) direction. The scanned image covered an area of at the temporal region of the ONH [square-marked in Fig. 1(b)], and required a total scanning time of 2.1 s, which is sufficient to minimize artifacts induced by subject motion. The comprehensive results obtained from such an OMAG scan are shown in Figs. 2Fig. 3Fig. 4–5, respectively. Fig. 2(a) The OCT fundus image of the temporal region of the ONH, and (b) the projection image of corresponding 3D microvasculatures. (c) a typical cross sectional image at the position marked as the dashed line in (a), showing microstructural organizations, and (d) the corresponding blood flow image. Here, , ; ONH tissue, and . .  Fig. 3Volumetric rendering of the 3D OMAG/OCT dataset, showing key physiological features of the ONH in 3D space. The marked lines sketch the approximate positions for depth-resolved en-face slices shown in Fig. 4. 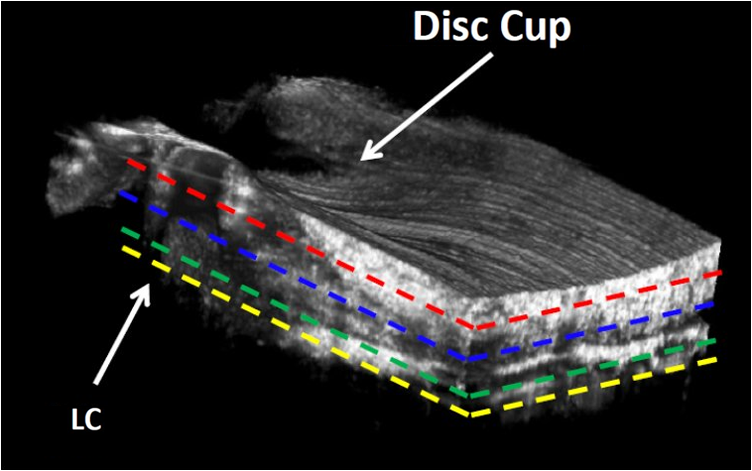 Fig. 4OMAG is capable of providing critical information about the structural organization and the corresponding vascular perfusion at different depths within the ONH. Shown from the top row to the bottom row are enface slices at depths from the superficial surface of the nerve layer of 80, 180, 400, and 600 μm. Microstructural images are represented in the left column. Corresponding blood flow images at the same depth are represented in the middle column. To better appreciate their spatial relationships, the right column gives the merged images from the microstructures (green) and microcirculations (purple) in columns 1 and 2, respectively. . Video 1 illustrates OHN microstructure organization, and Video 2 illustrates functional vascular networks. (Video 1, MOV, 10.6 MB) [URL: http://dx.doi.org/10.1117/1.JBO.17.11.XXXXXX.1] (Video 2, MOV, 11.1 MB) [URL: http://dx.doi.org/10.1117/1.JBO.17.11.XXXXXX.2] 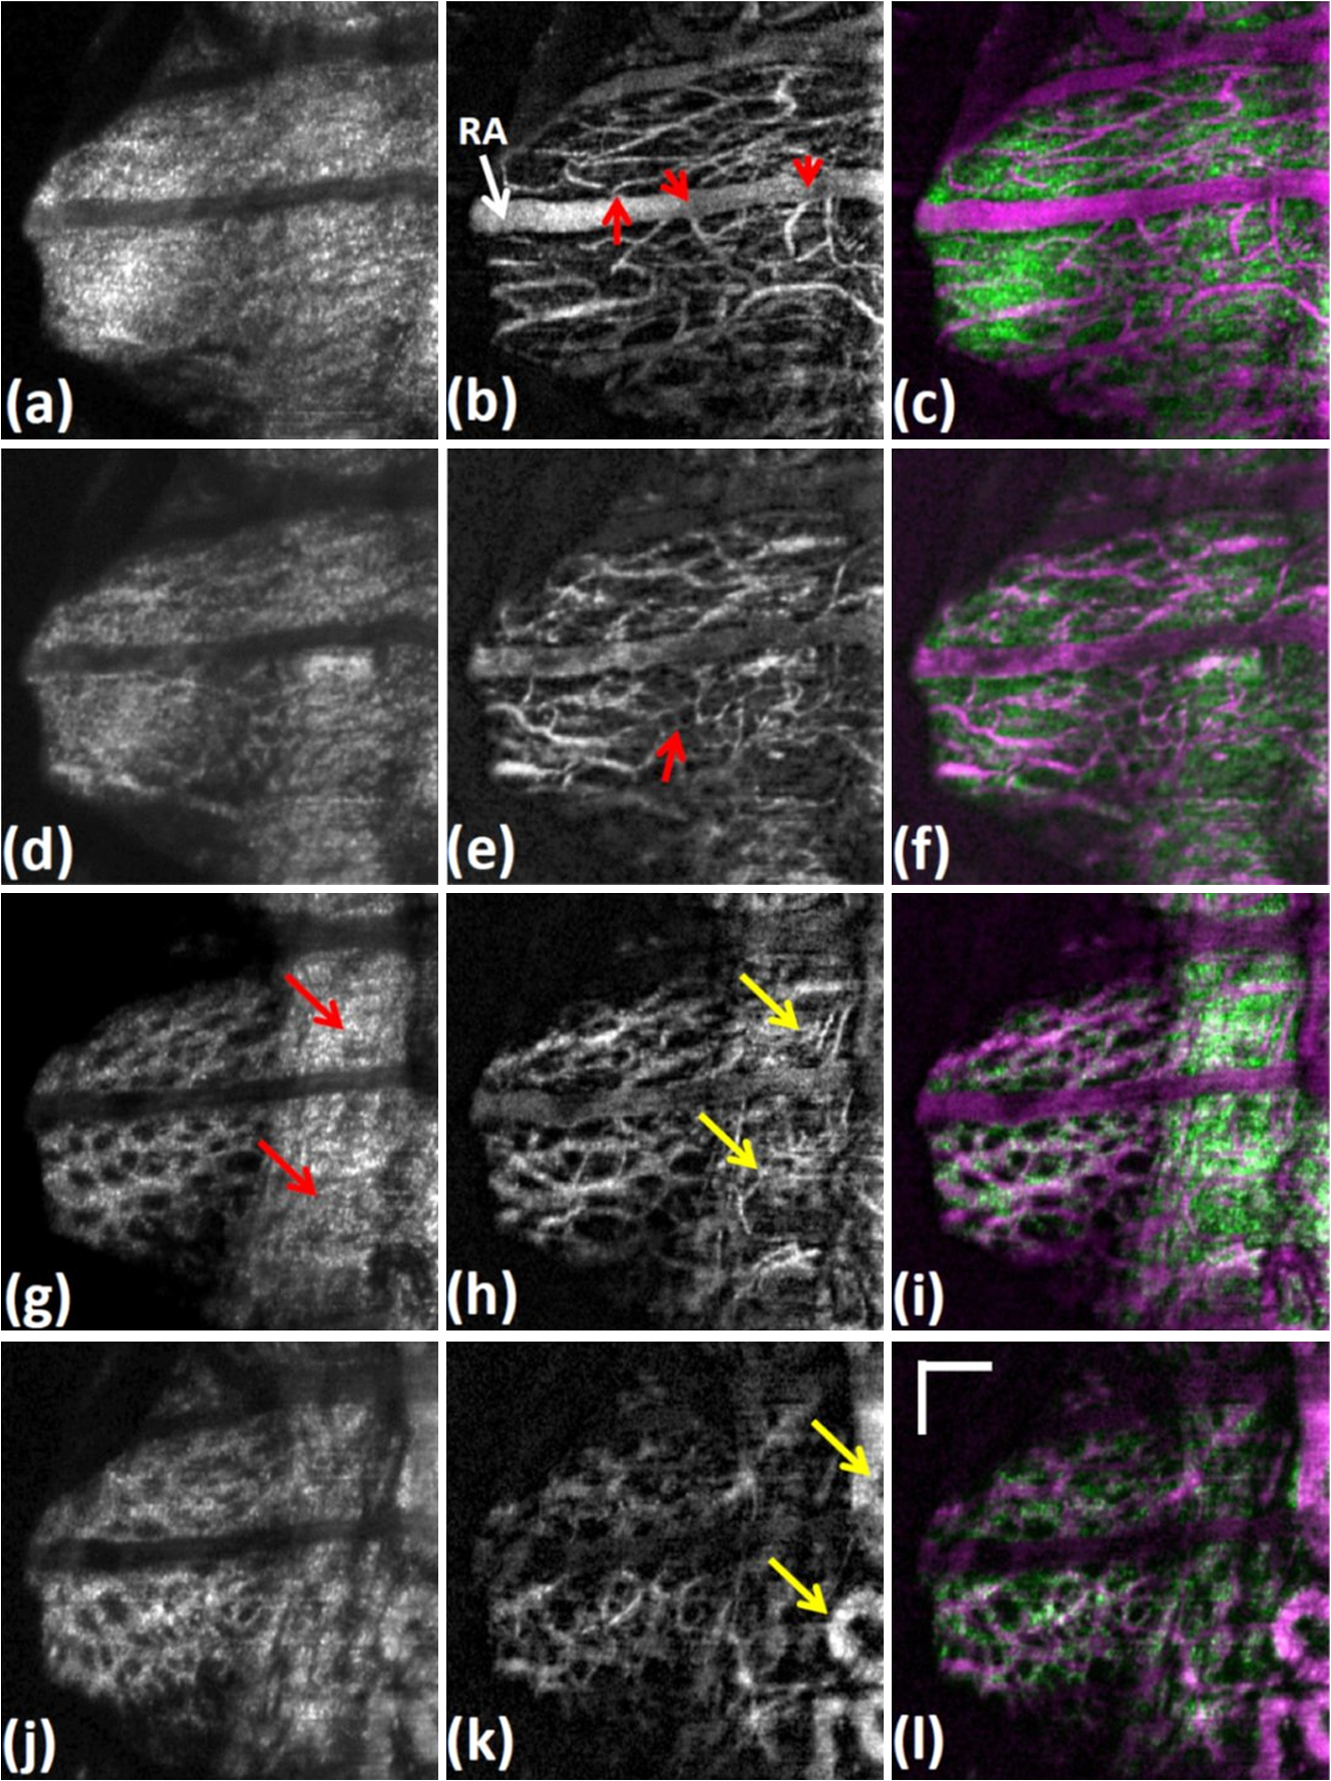 Fig. 5(a) En-face microstructure image extracted at the ONH depth of 400 μm below the ONH surface; (b) binary image showing the selected region of the LC pores computed from the region marked by the white circle in (a); and (c) image resulting from superimposing images (a) and (b) with red representing LC pores.  Figure 2(a) illustrates the OCT fundus image obtained from the 3-D dataset of the high resolution OMAG scan. Figure 2(b) gives the projection image of the corresponding 3-D microcirculation, showing that the ONH is highly vascularized. Figure 2(c) is a typical cross sectional image scanned at the location marked by the dashed line in Fig. 2(a); the corresponding blood flow image is given in Fig. 2(d). One advantage of the OMAG imaging is that it is capable of providing the depth-resolved tissue-structural image and the co-registered blood flow image in parallel. The structural image is identical to that of the conventional SD-OCT, demarcating the important physiological landmarks of the ONH [Fig. 2(a) and 2(c)]. Landmarks include the retinal artery (RA), superficial optic nerve fiber layer (NFL), prelaminar area (PL) and LC. The neuroretinal (NR) rim is seen as a weaker optical reflectance represented by the region marked by the enclosed dashed-line in Fig. 2(a). The scleral rim is seen as a stronger optical reflectance to the right of the marked dash-line region in Fig. 2(a). More importantly, the in vivo OMAG blood flow image demonstrates that the ONH is highly vascularized [Fig. 2(b)], consistent with evidence from numerous prior studies of the 3-D ONH vasculature, the evidence until now only obtainable through in vitro corrosion casting techniques25,26 or histologic study.4 In this study where we used a system operating in the 850 nm wavelength region, the blood flow in the patent vessels within the ONH can be localized to an ONH depth of [Fig. 2(d)]. Figure 3 shows the volumetric rendering of the 3-D structural dataset, which may be utilized to indicate the locations of some key features of the ONH, such as the LC and cupped region of the optic nerve. The 3-D dataset containing both the organizational and vascular information can be manipulated to display en-face tissue slices at particular depths. One such example is illustrated in Fig. 4, showing the detailed spatial relationship between vascular and tissue microstructure at locations representing various depths within the ONH. Displayed in Fig. 4 are the enface tissue slices of the microstructural images (left column), the corresponding vascular images (middle column), and the merged structure and blood flow images (right column), which permit better appreciation of corresponding structural and vascular spatial relationships. These images were extracted at four depth locations: approximately 80, 180, 400, and 600 μm, below the superficial surface of the ONH, which are located approximately within the four identified layers to correspond with the superficial NFL [Fig. 4(a)], the prelaminar region [Fig. 4(d)], and LC [Fig. 4(g) and 4(j)], respectively. It is clear that each layer exhibits a different morphological pattern in terms of both structural organization and microvasculature. The superficial NFL, the most anterior zone of the ONH is histologically continuous with the NFL of the retina25; optically, the NFL layer appears relatively homogeneous compared with other structures in the OCT images [Figs. 2(c) and 4(a)]. The OMAG blood flow image [Fig. 4(b)] illustrates the detailed capillary network within the NFL layer region. The NFL network is clearly visualized as being continuous with the retinal capillaries at the disk margin [in the region of the right side of Fig. 4(b)]. OMAG is able to identify a number of capillaries (arrows) branching off from the RA to supply a portion of the blood supply to the ONH superficial NFL. Immediately posterior to the NFL is the prelaminar region [Fig. 4(d)], which lies adjacent to the peripapillary choroid [to the right side of the Fig. 4(d) image]. The corresponding OMAG blood flow image [Fig. 4(e)] reveals vessels passing centripetally from the choroid to supply the ONH region. A complicated capillary plexus is present, with an increased vessel size compared to that of the superficial region [Fig. 4(b)]. More posteriorly, microstructural imaging demonstrates that the laminar region becomes continuous with the sclera. This more posterior region is composed of the LC [Fig. 4(g) and 4(j)], a structure consisting of fenestrated, connective tissue lamellae (laminar beams), which allow the transit of neural fibers through the scleral coat.25 There is a subtle change in the organization of the capillaries when transitioning from the prelaminar to the laminar region [e.g., seen as anastomotic capillary loops identified by arrow in Fig. 4(e)]. This study demonstrates the capillaries within the laminar region [Fig. 4(h) and 4(k)] conform to the pattern of the connective tissue septa that compose the laminar supportive architecture of LC [Fig. 4(i) and 4(l)]; the appearance corresponds well with scanning electron microscopy findings following corrosion casting of the disc vasculature.25,26 However, the scattering properties of the ONH tissue cause a progressive signal loss as the imaging depth increases. As a result, there is lower imaging contrast compared to the contrast at shallower depths as is apparent when comparing Fig. 4(h) and 4(k). Of special value, the high resolution and high sensitivity of the OMAG imaging permits visualization of the vasculature of the scleral rim [identified by the arrows in Fig. 4(g)] underlying the nerve fiber bundles entering the ONH around the entire ONH circumference. The scleral rim tissue is itself highly vascularized [see arrows in Fig. 4(h)], a property not easily appreciated when examining histologic material in which the circulation is devoid of blood. Finally, this study demonstrates the ability of OMAG to visualize the larger blood vessels lying within the scleral rim periphery adjacent to the deeper region of the LC [arrows in Fig. 4(k)]. Due to the limited imaging depth associated with use of an 850 nm light source, the current system is not able to image the retro-laminar region posterior to the LC. In the attachment we provide real time video files to permit detailed scrutiny of the sequential en face images of 3-D ONH tissue organization (Microstructure.avi) and microvasculature (Microvascular.avi). The videos are organized to play in en face frames with en face slices starting at the top surface, and then progressing to the deeper structures of the ONH. In reviewing sequential frames, an observation common to these subjects was that the laminar beams were not organized parallel to one another but rather appeared to be organized as a continuous spiral, a LC tissue organization not previously reported. Results from this 3-D OMAG dataset provide detailed information about blood flow both within the ONH tissue volumes and within individual ONH blood vessels. Furthermore, total intravascular volume within the 3-D tissue volume may be quantified. With proper clinical studies, OMAG thus may be a useful tool for the study of mechanisms associated with physiologic regulation of ONH blood flow, effects of pharmacologic agents and vascular components of pathologic processes associated with ONH disease states. The absence of effective imaging tools has until now made the assessment of the vascular components of ONH disease processes problematic. Disease entities that would benefit greatly from an improved understanding of associated vascular dysfunction include especially glaucoma, but also papilledema, idiopathic, and inflammatory forms of optic neuritis, as well as ischemic optic neuropathies. Clinically, OMAG can be used for diagnosis of vascular aspects of these disease processes. Perhaps more importantly, the technique offers promise as a sensitive tool to monitor progression of ONH disease processes and responses to treatment. Of particular clinical interest, the OMAG technique examines a dynamic real-time functional property; that is, the technique only images vessels that are actively transporting red blood cells. The imaging technology is noncontact, noninvasive, capable of quantification, and uses currently accepted levels of energy,23 a combination of attributes that suggests it could be easily developed into a practical clinical device. Previous methods, such as AO-SLO,11 have been limited to a small field of view, and superficial depths (). Although promising, AO-OCT13 is only capable of providing microstructural, not functional information about the dynamics of the vasculature of the ONH. With an ability to provide a large field of view, OMAG is superior in visualizing complex morphological features and deeper blood vessel networks (as great as in this study) within the ONH. Besides the capability of qualitatively evaluating the structural and vasculature information of the ONH, the imaging results delivered by the OMAG system could also be used to quantitatively examine the status of the LC as illustrated by the results presented in Fig. 5. The porous structure of the LC can be easily appreciated in Fig. 5(a), an enface image extracted at a depth 400 μm below the ONH surface. Since elevated IOP may lead to distortion of the LC structures, the shape of the LC pores may be used as an indicator of the LC status.12 For example, a higher IOP may compress the LC resulting in the reduction of the LC pore area4 or laminar pore registration between adjacent laminar beams. To quantitatively evaluate the distribution of the pore sizes, the LC region in Fig. 5(a) was first manually selected (marked by the white circle). The pore areas were then isolated [as demonstrated in Fig. 5(b)] by the use of a binarization method proposed in Ref. 27. Figure 5(c) is the merged image, which overlays the binarized pore area image (red color) onto the LC en-face structure image (white color). Based on Fig. 5(b), two parameters, i.e., the pore area and elongation ratio (the ratio of major to minor axes of an ellipse that fits the pore), can be evaluated, using the method proposed in Ref. 12. In this case, the average pore area was calculated to be with a standard deviation of 1405, and the average elongation ratio was 1.72 with a standard deviation of 0.29. These results are comparable with those reported,12 demonstrating the usefulness of the OMAG imaging of the ONH as a potential examination tool in future assessment of glaucoma. The current study used an OCT/OMAG system that employed a light source with a central wavelength of , which provided an imaging depth into the ONH. This imaging depth limitation prevents our assessment of the microstructure and microcirculation within the retro-lamina region, which lies posterior to the lamina cribrosa. However, reports have demonstrated that a 1-μm OCT system is capable of providing much enhanced imaging depth of the posterior segment of the eye.28,29 Thus, we expect that if powered by a 1-µm light source, the OMAG imaging system would be capable of providing enhanced resolution and depth assessment of both the morphological and functional vascular status of the ONH in humans in vivo. However, one point that should be mentioned is that the imaging performance of the system might deteriorate if the patient’s ocular media are cloudy (e.g., corneal opacity or cataract). In conclusion, we have demonstrated the capability of the OMAG system to image the human ONH, including the lamina cribrosa. With a spatial resolution of afforded by the high-resolution optical scanning probe, we have shown that it is possible for OMAG to provide comprehensive assessment (qualitative as well as quantitative) of the microstructures that support, and the functioning microvasculature that perfuses the ONH. Promising future applications of OMAG include clinical assessment of the health of the ONH, and the extent of structural as well as vascular involvement in disease conditions such as glaucoma, papilledema, and inflammatory as well as ischemic neuropathies. The potential ability to monitor ongoing dynamic changes in the ONH vasculature in human subjects may be permitted by this noninvasive technology. The technology thus offers a potential clinical tool to assess disease progression, resolution and responses to treatment in glaucoma as well as in a range of other ONH disease processes. AcknowledgmentsThis research was supported in part by research grants from the National Institutes of Health (R01HL093140, and R01EB009682) and the W.H. Coulter Foundation Translational Research Partnership Program. Dr. Wang is a recipient of Research to Prevent Blindness Innovative Research Award. The content is solely the responsibility of the authors and does not necessarily represent the official views of grant-giving bodies. ReferencesH. A. QuigleyA. T. Broman,
“The number of people with glaucoma worldwide in 2010 and 2020,”
Br. J. Ophthalmol., 90
(3), 262
–267
(2006). http://dx.doi.org/10.1136/bjo.2005.081224 BJOPAL 0007-1161 Google Scholar
J. M. Tielschet al.,
“Racial variations in the prevalence of primary open-angle glaucoma: the Baltimore eye survey,”
JAMA, 266
(3), 369
–374
(1991). http://dx.doi.org/10.1001/jama.1991.03470030069026 JAMAAP 0098-7484 Google Scholar
G. R. Howellet al.,
“Axons of retinal ganglion cells are insulted in the optic nerve early in DBA/2J glaucoma,”
J. Cell Biol., 179
(7), 1523
–1537
(2007). http://dx.doi.org/10.1083/jcb.200706181 JCLBA3 0021-9525 Google Scholar
C. F. Burgoyne,
“A biomechanical paradigm for axonal insult within the optic nerve head in aging and glaucoma,”
Exp. Eye Res., 93
(2), 120
–132
(2011). http://dx.doi.org/10.1016/j.exer.2010.09.005 EXERA6 0014-4835 Google Scholar
R. L. RadiusD. R. Anderson,
“Breakdown of the normal optic nerve head blood-brain barrier following acute elevation of intraocular pressure in experimental animals,”
Invest. Ophthalmol. Vis. Sci., 19
(3), 244
–255
(1980). IOVSDA 0146-0404 Google Scholar
H. A. Quigleyet al.,
“The mechanism of optic nerve damage in experimental acute intraocular pressure elevation,”
Invest. Ophthalmol. Vis. Sci., 19
(5), 505
–517
(1980). IOVSDA 0146-0404 Google Scholar
J. KerrP. NelsonC. A. O’Brien,
“Comparison of ocular blood flow in untreated primary open-angle glaucoma and ocular hypertension,”
Am. J. Ophthalmol., 126
(1), 42
–51
(1998). http://dx.doi.org/10.1016/S0002-9394(98)00074-9 AJOPAA 0002-9394 Google Scholar
A. Harriset al.,
“The role of optic nerve blood flow in the pathogenesis of glaucoma,”
Ophthalmol. Clin. N Am., 18
(3), 345
–353
(2005). Google Scholar
D. SchmidlaG. GarhoferaL. Schmetterer,
“The complex interaction between ocular perfusion pressure and ocular blood flow—relevance for glaucoma,”
Exp. Eye Res., 93
(2), 141
–145
(2011). http://dx.doi.org/10.1016/j.exer.2010.09.002 EXERA6 0014-4835 Google Scholar
J. CaprioliA. L. Coleman,
“Blood flow in glaucoma discussion. blood pressure, perfusion pressure, and glaucoma,”
Am. J. Ophthalmol., 149
(5), 704
–712
(2010). http://dx.doi.org/10.1016/j.ajo.2010.01.018 AJOPAA 0002-9394 Google Scholar
A. S. Vilupuruet al.,
“Adaptive optics scanning laser ophthalmoscopy for in vivo imaging of lamina cribrosa,”
J. Opt. Soc. Am. A. Opt. Image Sci. Vis., 24
(5), 1417
–1425
(2007). http://dx.doi.org/10.1364/JOSAA.24.001417 JOAOD6 0740-3232 Google Scholar
K. M. Iverset al.,
“Reproducibility of measuring lamina cribrosa pore geometry in human and nonhuman primates with in vivo adaptive optics imaging,”
Invest. Ophthalmol. Vis. Sci., 52
(8), 5473
–5480
(2011). http://dx.doi.org/10.1167/iovs.11-7347 IOVSDA 0146-0404 Google Scholar
C. Tortiet al.,
“Adaptive optics optical coherence tomography at 120,000 depth scans/s for non-invasive cellular phenotyping of the living human retina,”
Opt. Express, 17
(22), 19382
–19400
(2009). http://dx.doi.org/10.1364/OE.17.019382 OPEXFF 1094-4087 Google Scholar
R. K. Wanget al.,
“Three dimensional optical angiography,”
Opt. Express, 15
(7), 4083
–4097
(2007). http://dx.doi.org/10.1364/OE.15.004083 OPEXFF 1094-4087 Google Scholar
R. K. WangS. Hurst,
“Mapping of cerebrovascular blood perfusion in mice with skin and cranium intact by optical micro-angiography at 1300 nm wavelength,”
Opt. Express, 15
(18), 11402
–11412
(2007). http://dx.doi.org/10.1364/OE.15.011402 OPEXFF 1094-4087 Google Scholar
L. AnJ. QinR. K. Wang,
“Ultrahigh sensitive optical microangiography for in vivo imaging of microcirculations within human skin tissue beds,”
Opt. Express, 18
(8), 8220
–8228
(2010). http://dx.doi.org/10.1364/OE.18.008220 OPEXFF 1094-4087 Google Scholar
L. Anet al.,
“High speed spectral domain optical coherence tomography for retinal imaging at 500,000 A-lines per second,”
Biomed. Opt. Express, 2
(10), 2770
–2783
(2011). http://dx.doi.org/10.1364/BOE.2.002770 BOEICL 2156-7085 Google Scholar
R. K. Wanget al.,
“Depth-resolved imaging of capillary networks in retina and choroid using ultrahigh sensitive optical microangiography,”
Opt. Lett., 35
(9), 1467
–1469
(2010). http://dx.doi.org/10.1364/OL.35.001467 OPLEDP 0146-9592 Google Scholar
J. Qinet al.,
“In vivo volumetric imaging of microcirculation within human skin under psoriatic conditions using optical microangiography,”
Lasers Surg. Med., 43
(2), 122
–129
(2011). http://dx.doi.org/10.1002/lsm.v43.2 LSMEDI 0196-8092 Google Scholar
Y. L. Jiaet al.,
“In vivo optical imaging of revascularization after brain trauma in mice,”
Microvasc. Res., 81
(1), 73
–80
(2011). http://dx.doi.org/10.1016/j.mvr.2010.11.003 MIVRA6 0026-2862 Google Scholar
H. M. Subhashet al.,
“Volumetric in vivo imaging of microvascular perfusion within the intact cochlea in mice by ultrahigh sensitive-optical microangiography,”
IEEE Trans. Med. Imaging, 30
(2), 224
–230
(2011). http://dx.doi.org/10.1109/TMI.2010.2072934 ITMID4 0278-0062 Google Scholar
Y. JungZ. W. ZhiR. K. Wang,
“3-D optical imaging of microvascular network within intact lymph node in vivo,”
J. Biomed. Opt., 15
(5), 050501
(2010). http://dx.doi.org/10.1117/1.3496301 JBOPFO 1083-3668 Google Scholar
S. L. Jiaoet al.,
“Simultaneous acquisition of sectional and fundus ophthalmic images with spectral-domain optical coherence tomography,”
Opt. Express, 13
(2), 444
–452
(2005). http://dx.doi.org/10.1364/OPEX.13.000444 OPEXFF 1094-4087 Google Scholar
E. Ondaet al.,
“Microvasculature of the human optic nerv,”
Am. J. Ophthalmol., 120
(1), 92
–102
(1995). AJOPAA 0002-9394 Google Scholar
D. Y. ZhaoG. A. Cioffi,
“Anterior optic nerve microvascular changes in human glaucomatous optic neuropathy,”
Eye, 14
(Pt 3B), 445
–449
(2000). http://dx.doi.org/10.1038/eye.2000.129 12ZYAS 0950-222X Google Scholar
R. Reifet al.,
“Quantifying optical microangiography images obtained from a spectral domain optical coherence tomography system,”
Int. J. Biomed. Imaging, 2012 509783
(2012). http://dx.doi.org/10.1155/2012/509783 IJBIBD 1687-4196 Google Scholar
R. K. WangL. An,
“Multifunctional imaging of human retina and choroid with 1050 nm spectral domain optical coherence tomography at 92 kHz line scan rate,”
J. Biomed. Opt., 16
(5), 050503
(2011). http://dx.doi.org/10.1117/1.3582159 JBOPFO 1083-3668 Google Scholar
D. M. de Bruinet al.,
“In vivo three-dimensional imaging of neovascular age-related macular degeneration using optical frequency domain imaging at 1050 nm,”
Invest. Ophthalmol. Vis. Sci., 49
(10), 4545
–4552
(2008). http://dx.doi.org/10.1167/iovs.07-1553 IOVSDA 0146-0404 Google Scholar
|


