|
|
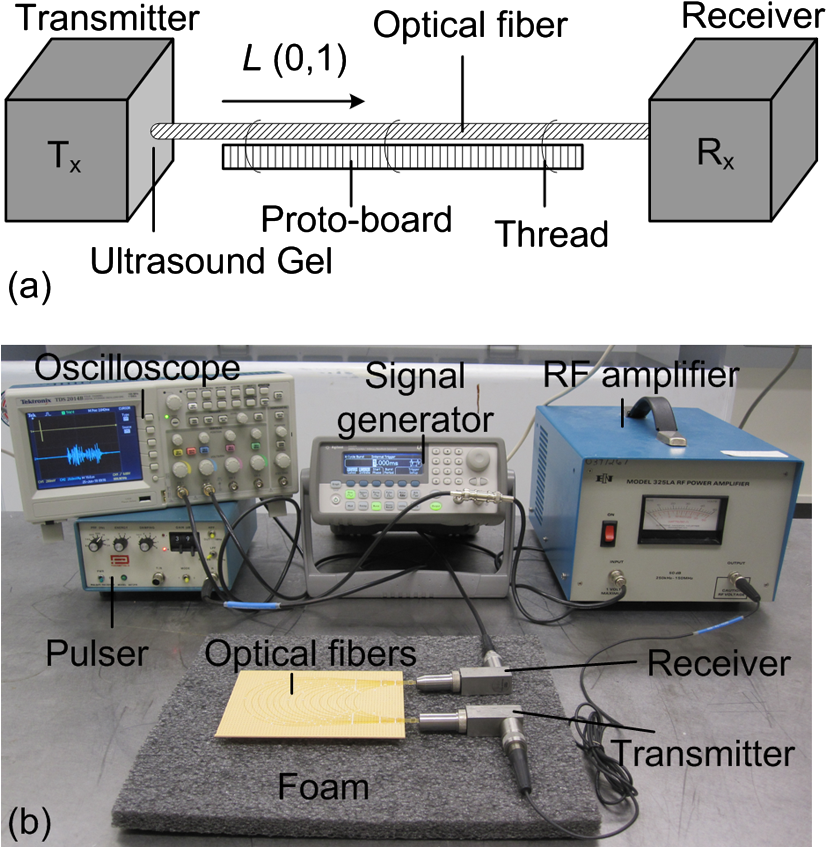
1.IntroductionPhotoacoustic tomography (PAT) has emerged as a hybrid biomedical imaging technique which combines strong endogenous and exogenous optical absorption contrast and high ultrasonic resolution in a single modality.1–3 In PAT, a short-pulsed laser irradiates the biological tissue, and photoacoustic (PA) waves are generated via thermoelastic expansion. These PA waves propagate in the medium and are then detected by a single-element ultrasonic transducer or an ultrasonic transducer array. The amplitudes of the initial PA waves, the multiplication between local fluence, and the optical absorption coefficients of targets represent the optical absorption distribution of the tissue. Thus, PAT overcomes the fundamental limitations of pure optical imaging (shallow imaging depth for high resolution, or poor spatial resolution beyond the transport mean free path) and pure ultrasonic imaging (weak contrast for detecting early stage cancers and speckle artifacts).4–9 It is capable of high-resolution structural,10,11 functional,11–14 and molecular imaging.15–20 By scaling the ultrasonic frequency, the spatial resolution and imaging depth can be tailored for particular imaging applications. There are two main types of PAT systems.21 The first is photoacoustic microscopy (PAM), which utilizes direct point-by-point detection of 1-D depth-resolved images and raster mechanical scanning to form a 3-D image. The second type is photoacoustic computed tomography (PACT), which uses ultrasonic transducer arrays for parallel detection and reconstruction algorithms for real-time image generation.22–25 PAM does not require the use of a mathematical algorithm to generate an image, but it requires raster scanning with a single-element focused transducer. Consequently, the imaging speed of PAM depends largely on the laser repetition rate and the speed of the mechanical scanning. By contrast, PACT can be implemented using an ultrasound array system; hence, the imaging speed is dramatically improved without raster mechanical scanning. For example, Gamelin et al.23 used a full-ring ultrasonic transducer array consisting of 512 elements to collect two-dimensional (2-D) images at a frame rate of 0.9 Hz, with a 10-Hz laser pulse repetition rate. The data acquisition (DAQ) electronics were composed of 512 low-noise preamplifiers. With 8:1 multiplexing, eight laser pulses were required to capture a complete 512-element data set. In addition, linear ultrasound transducer arrays with either 48 or 128 elements have been used in PACT.23,25 Generally, the imaging speed of PACT depends on the number of transducer elements in the array. However, as the number of transducer elements increases, the construction and operation of the ultrasound receiving systems becomes more challenging and costly. Therefore, new solutions are needed to reduce or even completely eliminate the dependence on massive ultrasonic transducer arrays and extensive DAQ electronics. Depending on the penetration depth (from a few mm to cm) and the acoustic velocity in the target tissue (), the typical propagation time of a PA wave in the tissue medium is on the order of microseconds (μs) [Fig. 1(a)]. On the other hand, the pulse repetition rate of the pulsed-laser systems used in PAT is in the kilohertz range, so the time interval between two successively generated PA waves will be on the order of milliseconds (ms). In current PACT systems, all the generated PA signals propagate and reach the ultrasonic transducers nearly simultaneously. This simultaneity inevitably leads to a parallel detection scheme, which requires multiple receiving channels (including ultrasonic transducers and DAQ electronics). However, by using parallel acoustic delay lines (PADLs) to introduce specific acoustic time delays [Fig. 1(b)], the PA signals in different channels can be forced to arrive at the ultrasonic transducers at different times, and will be completely distinguishable in the time domain even after being mixed into one channel [Fig. 1(c)]. Ultimately, this technique opens the possibility of detecting and processing multiple channels of time-delayed PA signals in a serial manner, using a single-element transducer and single-channel DAQ electronics. Because the PA signals have a shorter propagation time (μs) than the laser pulse repetition time (ms), this approach is potentially able to merge a large number of receiving channels, and thus leads to significant reductions in the complexity and cost of ultrasonic receiving systems. Fig. 1(a) PA signals without time delays (in current PACT systems); (b) PA signals with proper time delays; and (c) multiple channels of time‐delayed PA signals mixed into one single channel. 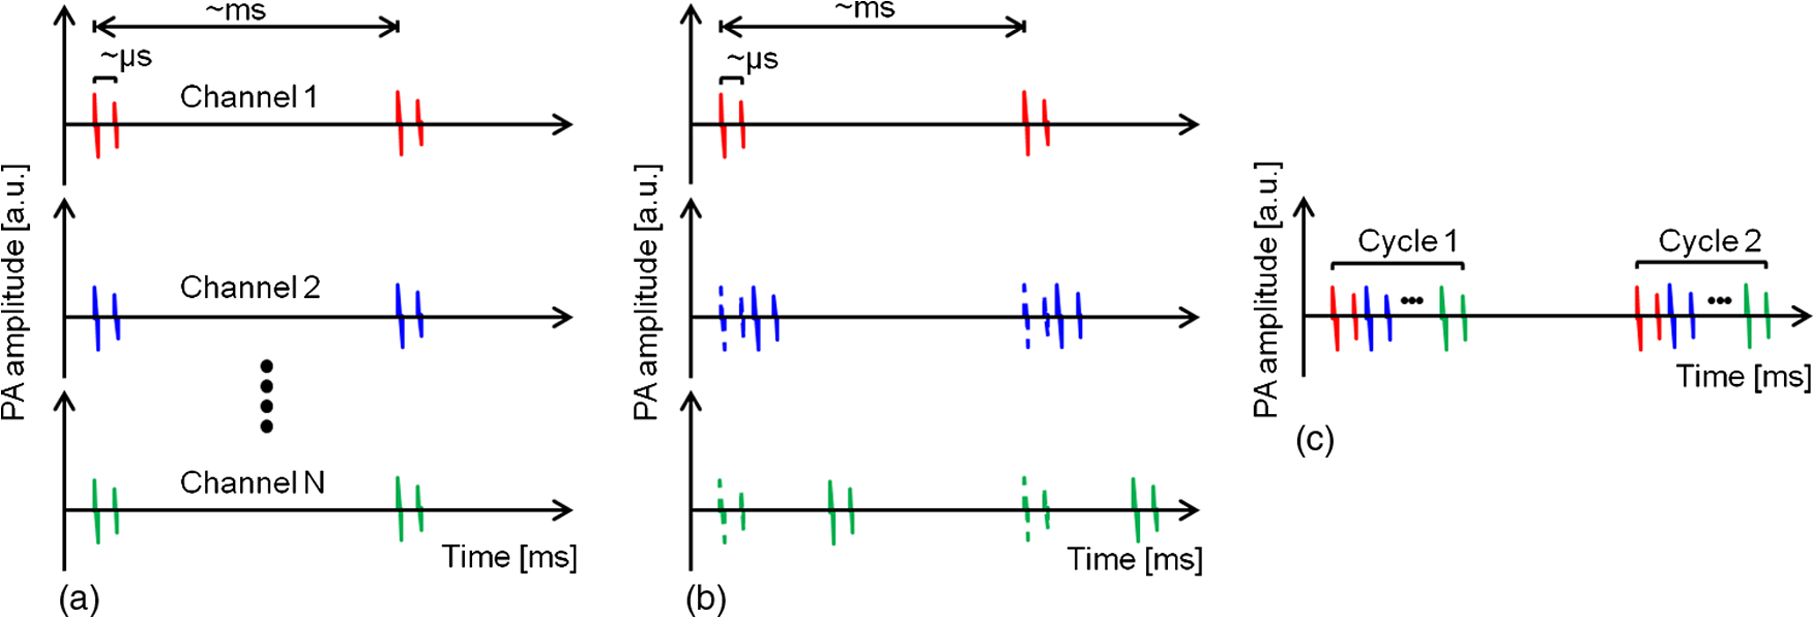 In this paper, we report, for the first time to our knowledge, the development and application of a novel PADL technique for PAT. The PADLs are made of low-loss and flexible optical fibers. We experimentally characterized the acoustic properties of the optical fibers and verified the feasibility of using them as acoustic waveguides. Based on these results, the optical fibers were used to construct multi-channel PADLs where each channel independently carried PA waves with a specific time delay. We built a prototype PADL-PAT system using 16 optical-fiber PADLs, 2 ultrasound transducers, and 2 channels of DAQ electronics. The PADL-PAT system successfully imaged an optically absorbing object positioned in an optically scattering medium. 2.Optical-Fiber Acoustic WaveguidesVarious materials, including liquid mercury,26 solid quartz crystals,27 metallic wires,28 and flexible optical fibers,29,30 have been used to construct ultrasonic delay lines. Given the acoustic velocity in these media, we can control the acoustic time delay from μs to ms by varying the propagation length of the material without causing excessive acoustic attenuation.31 To construct the delay line for this work, we selected optical fibers due their broad availability, low cost, and low acoustic attenuation. 2.1.Propagation Modes in Optical FibersPA signals propagate in longitudinal modes. However, for wire-type cylindrical acoustic delay lines, all of the sustained longitudinal modes are dispersive, which means that the time delay is dependent on the frequency of the transmitted signal. This dispersion can generate signal distortion in the time domain, which is not desirable for PAT since the time-of-arrival of the PA signals is used to retrieve spatial information for image reconstruction. To address this issue, the lowest-order longitudinal mode [] of the Pochhammer-Chree wave was used. It has been shown that if the diameter of the circular fiber () is much smaller than the ultrasound wavelength () both the higher-order longitudinal modes and the dispersion of the mode will be significantly suppressed. Typically, this condition is satisfied when () or () , where is the frequency of the ultrasonic wave, and is the acoustic velocity in a rod.28,32 A smaller ratio of () would further suppress higher order modes and the dispersion of the mode. Thus, once is small enough that the above inequality is satisfied for all detected wave components, high-fidelity transmission of the PA signal through the acoustic delay lines can be achieved. However, if is too small, it would be difficult to transmit sufficient PA signals via the fiber, and thus the PAT system would suffer from low signal-to-noise ratio (SNR) because of the narrow detector area. For PA signal detection at a 1 MHz center frequency, and based on previously reported acoustic velocity data for optical fibers (5000 to ),32,33 fibers with a total diameter of were selected for this work, which provided () . The silica-silica (all-silica) optical fibers used in this work have a pure silica core with 200 μm diameter, surrounded by a 20-μm-thick cladding layer made of fluorine doped silica, and an outer 25-μm-thick polyimide jacket layer (Optran WF from CeramOptec Industries Inc., MA). 2.2.Characterization MethodTo build an optical fiber-based delay line, the acoustic properties (i.e., attenuation, propagation velocity, and time delay) of silica optical fibers were characterized. The schematic and a photograph of the experimental setup are shown in Fig. 2. The optical fiber was loosely mounted onto a phenolic-based (acrylic) perforated board (proto-board) and the unnecessary contact between the fiber and surrounding structures was minimized to reduce acoustic reverberation. Two identical flat, longitudinal mode PZT ultrasound transducers with a center frequency of 1 MHz (Olympus NDT, V303) were used. The fiber tips were polished and carefully coupled to the transducer surface via a thin layer of ultrasound gel. This coupling also helped to filter out the unwanted shear, torsional, and extensional modes of the ultrasonic waves. Optical fibers with various lengths were tested for acoustic attenuation, ultrasound propagation velocity, and time delay. As shown in Fig. 2(b), an ultrasound pulse (1 μs width and amplitude) was generated by a signal generator, amplified by an RF amplifier, and applied to the transmitting transducer. Ultrasound pulses from the transmitting transducer propagated through the optical fiber and were detected by the receiving transducer. The received signals were amplified and displayed on an oscilloscope. 2.3.Acoustic Properties: Attenuation, Velocity, and Time DelayFigure 3(a) shows the detected ultrasound waveforms for six optical fibers of varying lengths, as well as the ultrasound pulse applied to the transmitting transducer. Distinct signals at an incremental time delay of were received for fibers of lengths ranging from 10 to 35 cm. For shorter fibers, the 1st echo signals resulting from acoustic reflection between the fiber and the surface of the receiving transducer are also displayed. The echoes were detected at a time corresponding to three traversals of the fiber length. The time delay of each fiber is plotted in Fig. 3(b). As the fiber length increases, the time delay increases linearly. Based on these measurements, the average acoustic velocity in silica optical fiber was found to be . Fig. 3(a) Plot showing acoustic waveforms propagating through optical fibers of different lengths ranging from 10 to 35 cm. (b) Plot of the time delay versus the corresponding fiber length. The average acoustic velocity in the silica fiber is . (c) Attenuation of acoustic signals through optical fibers of various lengths. The average attenuation is (). 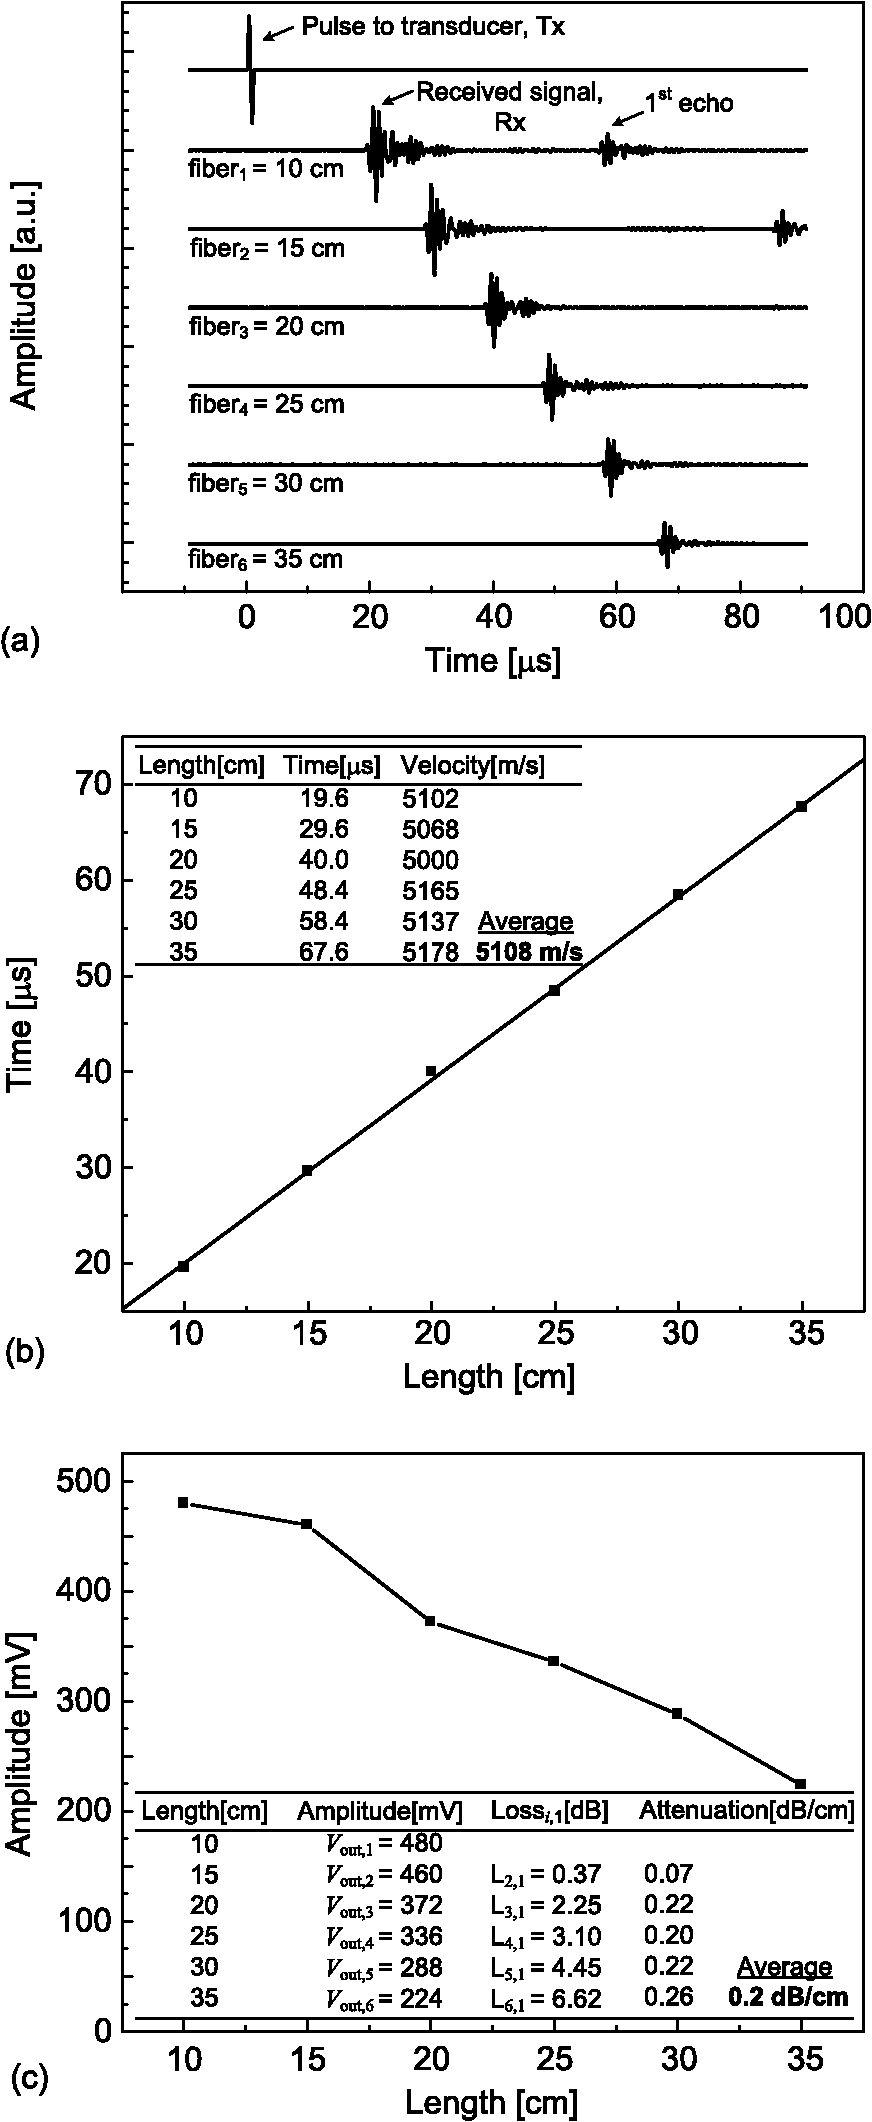 To determine the acoustic attenuation in the optical fibers, the amplitudes of the received ultrasound waves were also plotted [Fig. 3(c)]. The amplitudes can be used to calculate the acoustic loss (), which is defined by , where refers to the acoustic signal amplitude at the fiber input, and refers to the amplitude at the output. The acoustic attenuation constant can then be calculated by dividing the acoustic loss by the length of the optical fiber. However, it is difficult to directly measure . Therefore, losses of two different fibers (with finite length difference) were subtracted. Then, the loss over length is , where (the shorter fiber) was kept constant in all calculations, and corresponds to the output amplitudes of the remaining five fibers ( to ). Based on this approach, five data points for loss (i.e., to ) were obtained [inset in Fig. 3(c)], and the average attenuation per unit length or unit time delay was calculated as (i.e., ) at 1 MHz, which matches well with previously reported data.32 To analyze the frequency response of the optical fibers, a fast Fourier transform (FFT) operation was performed on their time-domain response [ultrasound waveforms in Fig. 3(a)] using the built-in FFT algorithm of MATLAB®. Power spectra of the six different optical fibers are plotted on the same chart for comparison [Fig. 4(a)]. Fig. 4(a) Frequency response (power spectra) of the six optical fibers with different lengths, showing a center frequency of . Inset shows the spectra spaced-out in -axis for visualization. (b) Frequency response of the transducer used in the experiments. 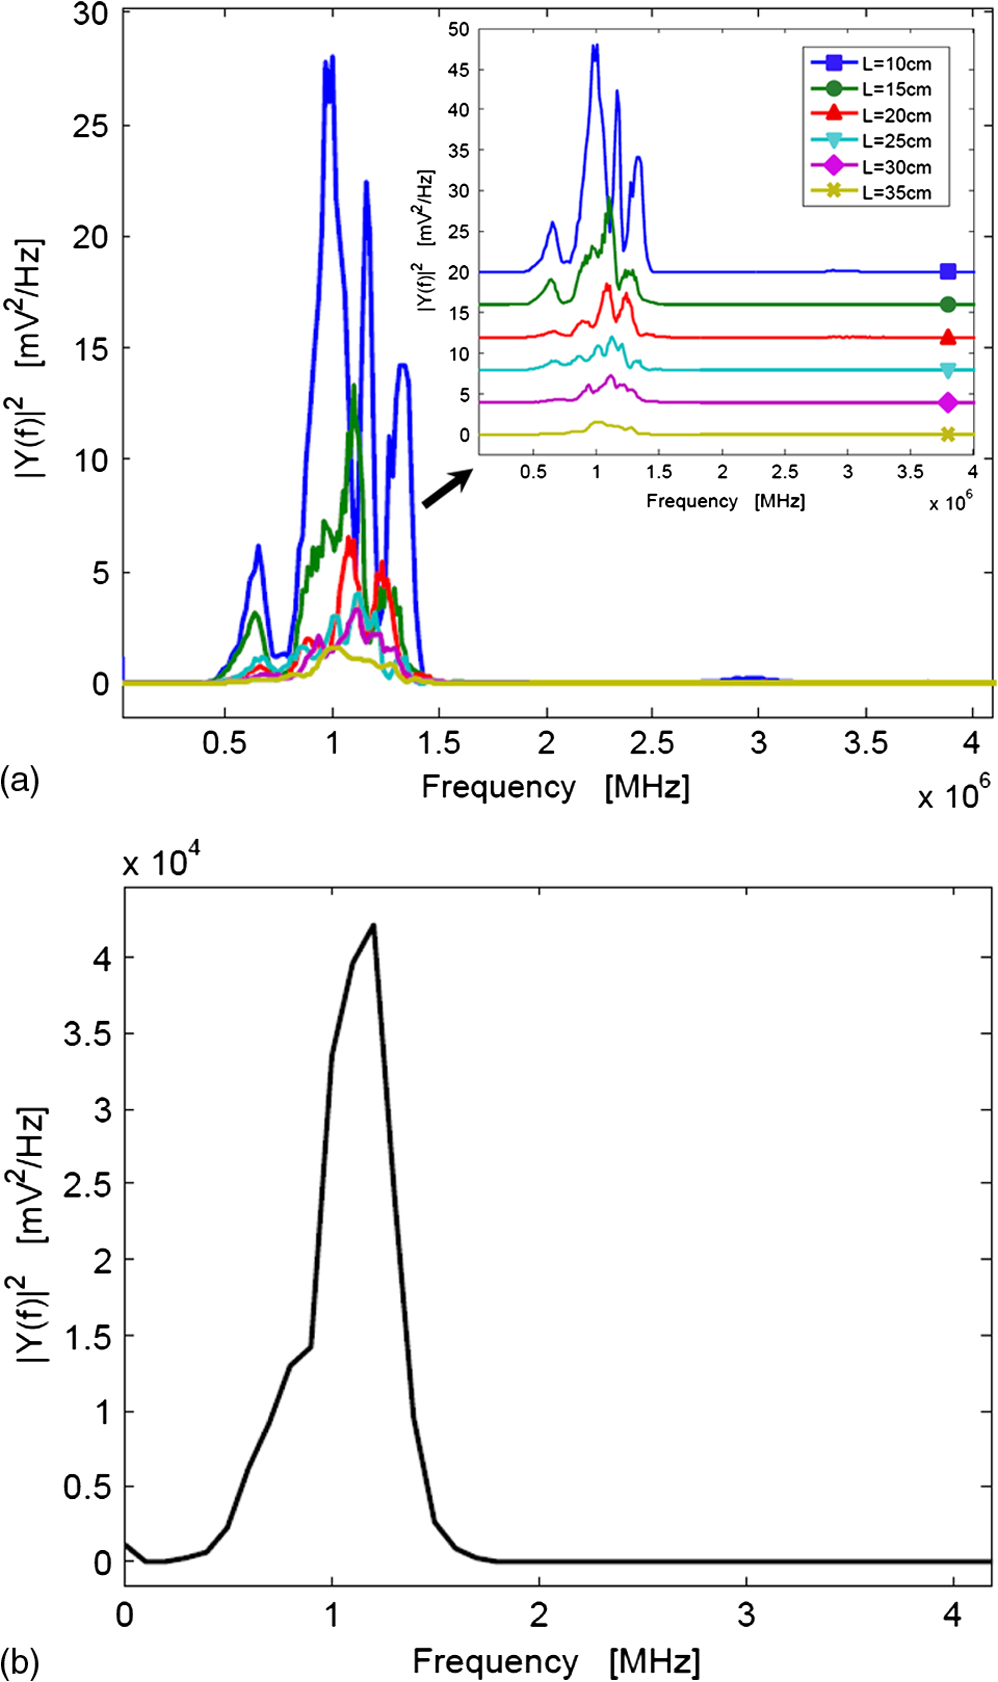 On average, the signals have a center frequency at and bandwidth of , with upper and lower frequency cutoffs at and , respectively. The same approach was used to obtain the frequency response of the transducer [Fig. 4(b)]; where, the transmitting and receiving transducers are directly coupled to each other with no delay lines in between. The spectrum shows that the transducer center frequency of is similar to datasheet specifications,34 which also matches with the received power spectra of the fibers [Fig. 4(a)]. 3.Parallel Acoustic Delay LinesThe optical-fiber PADLs were designed based on the measured acoustic properties of optical fibers. The following design parameters were also considered: (1) the number of fibers (i.e., the number of delay lines, ), (2) the length of each fiber (to determine the time delay), and (3) the parallel arrangement of fibers and the pitch between fibers. As increases, the construction and handling of the PADLs becomes difficult due to the longer fiber lengths. In this work, was selected as 8 to ensure a compact design and an adequate field-of-view (FOV), which is also related to the fiber diameter, pitch, and target size in PA imaging. When the fiber lengths were determined, the following two design criteria were considered. First, the time delay between each fiber (i.e., channel spacing) should be long enough to prevent possible signal overlaps from adjacent channels. Based on the duration () of the ultrasonic signals arriving at the receiving transducer, an incremental time delay () between adjacent delay lines is required to avoid signal overlapping. The second criterion concerning fiber lengths is to select the proper arrival time for reflected signals (1st echo) in the shortest fiber (1st fiber). To prevent possible interference between echoes and the original signals propagating in neighboring fibers, the fiber with the longest time-delay (nth fiber) should be designed so that its signal reaches the receiving transducer before the 1st fiber’s echo does. Denoting as the incremental time delay between two neighboring fibers, and as the time delay of the 1st fiber, the signal in the th fiber will be received at , while the 1st fiber’s echo will be received at . Then, to prevent interference, the following inequality must hold: . Therefore, for an 8-fiber delay line and 12-μs incremental time delay, should be longer than 42 μs. Based on this result, the 1st and 8th fibers were designed to provide time delays of 44 and 224 μs, respectively, which creates a 4-μs gap between the arrival of the 1st fiber’s echo and the signal in the 8th fiber. Table 1 summarizes the time delays (timing of signals and echoes) for the 8-channel optical-fiber PADL system, along with the corresponding fiber lengths. Table 1Time delays and optical fiber lengths for PADLs.
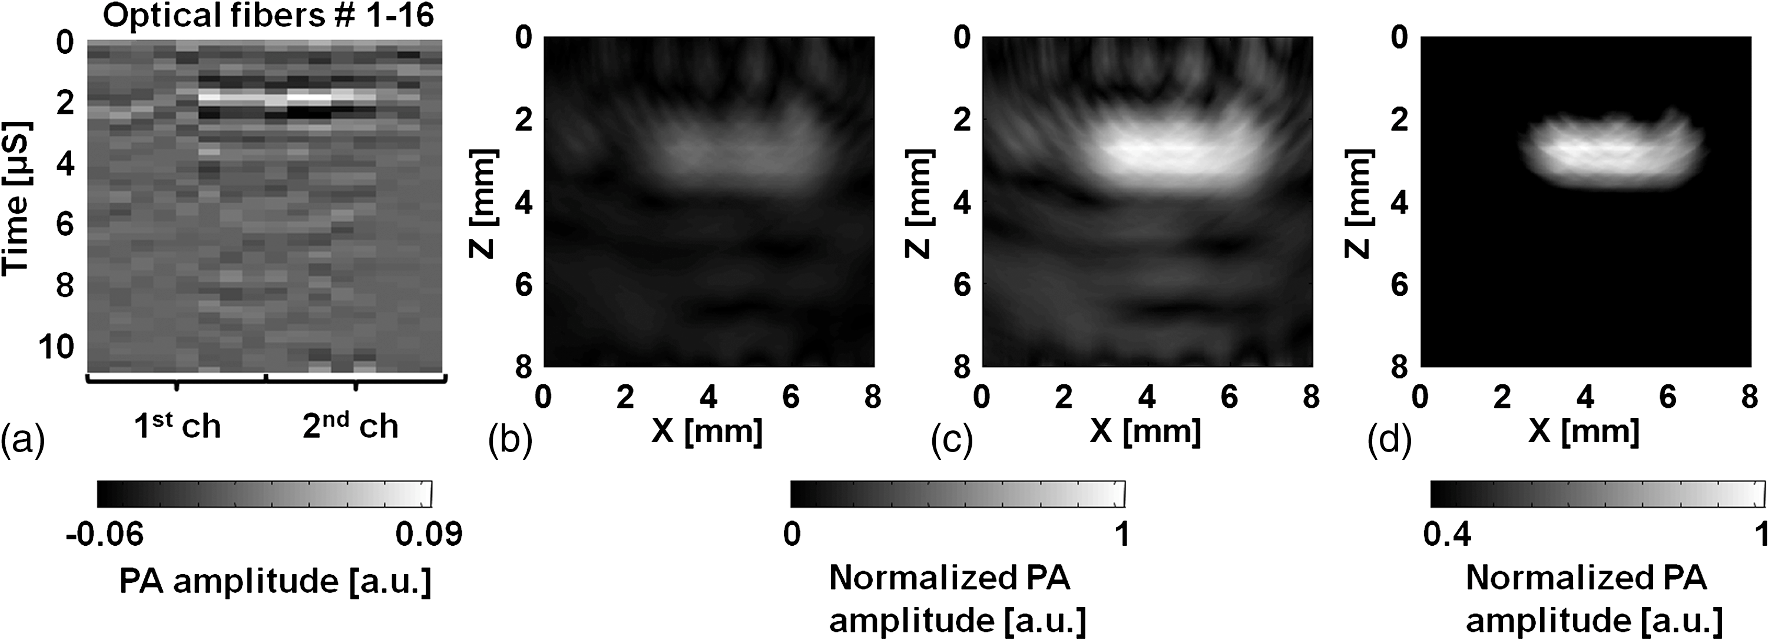
The incremental time delay between fibers is 12 μs, and the acoustic velocity in silica optical fibers is ∼5108 m/s. In ultrasound array systems, it is common to arrange the transducer elements with , where is the pitch and is the wavelength. Based on the frequency (1 MHz) of our ultrasound transducers, the fiber-to-fiber spacing would be in the range of 400 to 500 μm. To arrange the optical-fiber PADLs, -wide trenches in parallel (pitch ) were made in a low-loss acoustic material (lucite) [Fig. 5(a)]. The fibers were loosely placed in trenches, which allowed for side-by-side arrangement of fiber endings at the input and output ports with the correct pitch and minimal attenuation. A total of sixteen fibers are housed in a common input port for PA signal detection, and separated into two output ports for time-delayed read-out [Fig. 5(c)]. The selected geometrical dimensions, including the fiber diameter and spacing, as well as the number of fibers provide an effective FOV of . The possible increase in field-of-view due to ultrasound acceptance angle is neglected, since that effect is small compared to the size of the delay line input port which is the dominant factor here. Fig. 5(a) Schematic of the parallel arrangement of fiber endings in equally spaced trenches. (b) Optical microscopic image showing polished tips of fibers. (c) Picture of the PADL array having a common input and two output channels. Inset shows the picture of equally spaced Lucite grooves housing the fiber endings.  4.Photoacoustic Imaging with PADLs4.1.Photoacoustic Imaging ExperimentFigure 6 shows the PA experimental setup. The light was delivered from a tunable OPO laser (Surelite OPO PLUS; Continuum; with a wavelength tunability of 410 to 2500 nm) pumped by a Q-switched Nd:YAG laser (SLII-10; Continuum) with a 5-nanosecond pulse duration and a 10-Hz pulse repetition rate. A light wavelength of 800 nm was used. The first two lenses collimated the laser beam, and the cylindrically focused light beam, horizontally parallel to the PADLs, illuminated the sample surface. This obliquely incident dark-field light illumination, which shined above the interface between the delay lines and the tissue phantom, helped reduce the generation of unwanted surface signals at the interface. The incident laser pulse energy was less than , far below the ANSI safety limit of at this wavelength. Fig. 6PA experimental setup using 16 channels of optical-fiber PADLs with two DAQ channels. Each DAQ channel interfaces with 8 optical-fiber PADLs.  Generated PA waves were detected by the PADLs, which were divided into two channels. For each channel, eight distinct PA waves propagating via the optical fibers were time-delayed and serially detected by a single-element unfocused ultrasound transducer with a center frequency of 1 MHz (Olympus NDT, V303). The PA signals were amplified and received by an oscilloscope. To enhance the coupling efficiency and minimize unwanted ultrasound reverberation, ultrasound gel was applied at the interfaces between the optical fibers and the ultrasound transducer surface. A standard PAT reconstruction algorithm was employed to reconstruct the PA image, and the Hilbert transformation was taken in the axial direction for envelope detection.35 4.2.Photoacoustic ImageTo investigate the potential for cross-sectional imaging, an optically scattering tissue phantom ( along the , , and axes, respectively) containing an optically absorptive object ( along the , , and axes, respectively) was used [Fig. 7(a)]. The target was positioned at a depth of 3 mm from the sample surface. The phantom was made of 10% gelatin by weight and 1% intra-lipid by volume, and its reduced scattering coefficient was . The absorption coefficient of the object was . The A-scan PA signals received from the two channels are shown in Fig. 7(b) and 7(c). Each A-scan sequentially recorded PA signals detected by each fiber. In theory, the PA signals from each fiber can be distinguished by calculating the fiber length differences and the acoustic velocity in the fiber. However, even minor measurement errors of these two parameters may cause inaccurate time delays and severely distort the image reconstruction. To address this issue, the starting points of the fibers were directly measured by painting the fiber tips with black ink, which also generated PA signals upon laser illumination. Thus the peaks of the PA signals from the ink on the fiber tips can be treated as the starting points and help indicate the actual PA signals corresponding to the imaged target. Fig. 7Reconstructed PA image of an optically absorptive target embedded in an optically scattering medium. (a) Photograph. (b) Raw A-scan data received by the first channel. (c) Raw A-scan data received by the second channel. 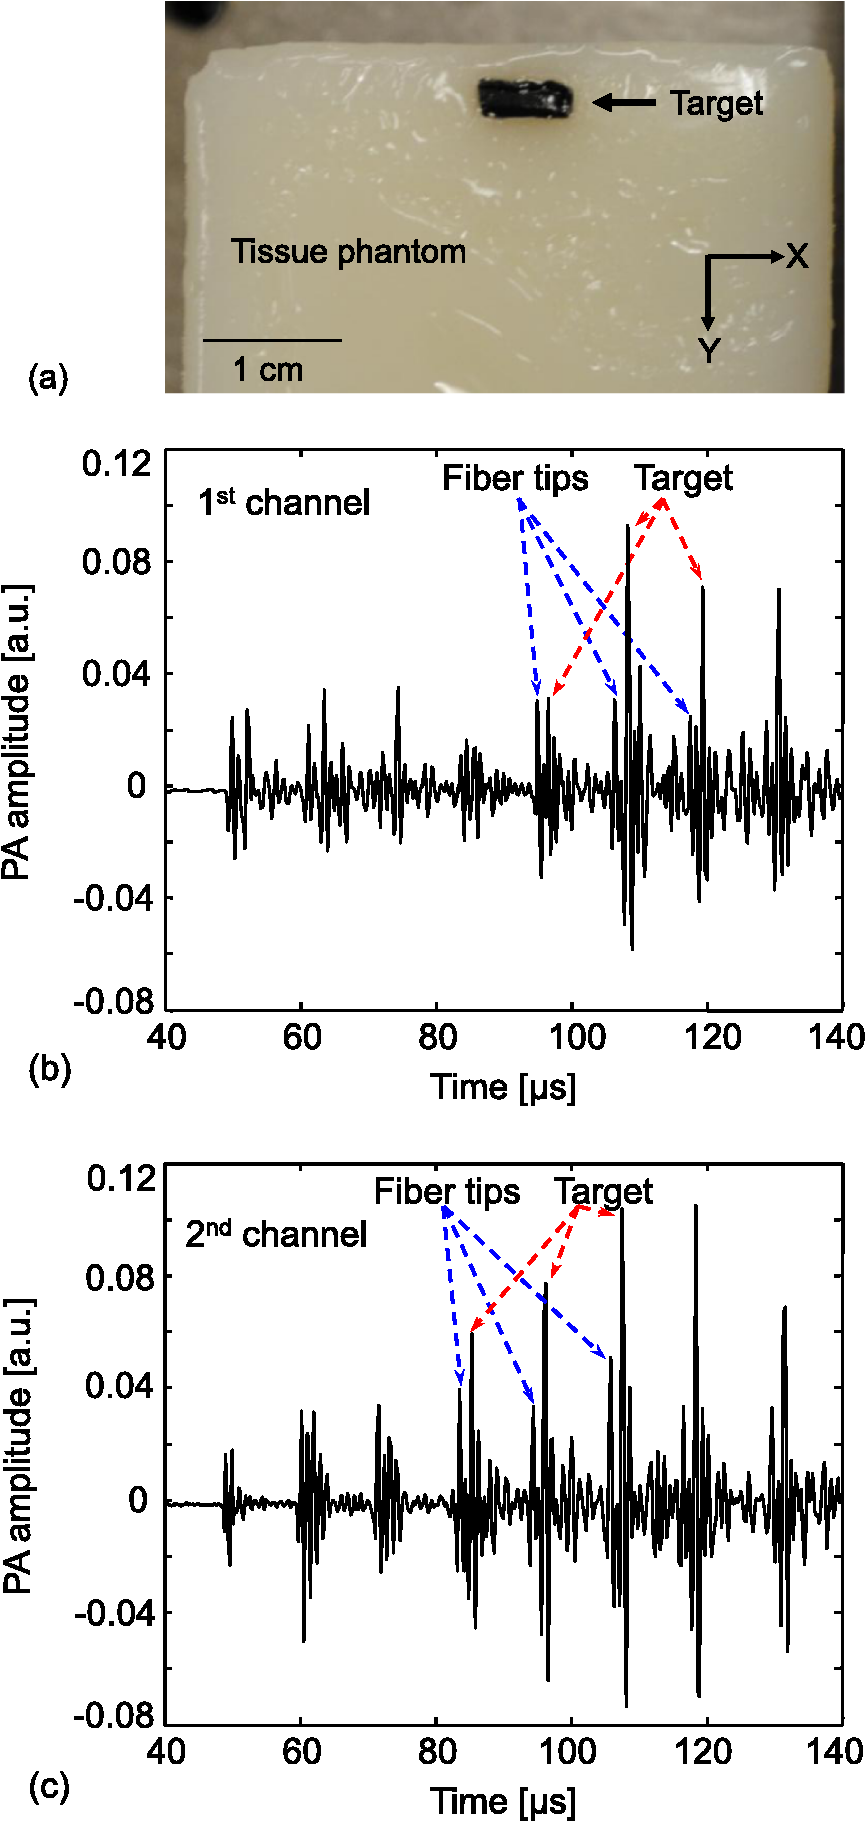 The PA signals were averaged 100 times, so the imaging speed for one PA image was 10 s. A-scans from both ultrasonic transducers were reshaped and combined into one data set, as shown in Fig. 8(a). The reconstructed PA images without and with compensation of the acoustic attenuation () in each fiber are shown in Fig. 8(b) and 8(c), respectively, which match well with the photograph in Fig. 7(a). The image contrast, defined as the ratio of the difference in PA signals measured from the target and background to that acquired from the background, is estimated to be ; and the contrast-noise-ratio is 10.8. The spatial resolution, defined as the one-way distance across the 10% and 90% points between the maximum and minimum of the edge spread function, is . The PA image contrast may be further enhanced by using a signal threshold of 40%, as shown in Fig. 8(d). 5.ConclusionIn this work, we have developed parallel-acoustic-delay-line (PADL)-based PAT, where multiple channels of PA signals are time-delayed to reduce the complexity of the ultrasonic receiving systems. To provide the needed time-delay, the performance of silica optical fibers serving as acoustic waveguides was experimentally characterized and a 16-channel PADL array was constructed. The feasibility of PADL-PAT was qualitatively demonstrated by conducting PA imaging of a tissue phantom housing an optically absorptive object. By using the PADLs, only two transducers and two channels of DAQ electronics were needed for the PA imaging. In contrast, a conventional PACT would require a 16-element ultrasonic transducer array and 16 channels of DAQ electronics. In this case, hardware reduction was achieved with the PADL approach. To fully develop and optimize the PADL-PAT system for preclinical and clinical applications, the following studies need to be performed in the future: 1. the analysis of the coupling efficiency of acoustic waves between the medium and the fiber delay lines; 2. quantitative measurements of PA amplitudes by varying the absorption coefficients of the objects, imaging depths, and laser fluence; 3. the analysis of the response function of each delay line; and 4. development of a hardware system to efficiently isolate the PA echo signals between delay lines. Once fully developed and optimized, the PADL approach could be applied to enhance the clinical applications of real-time 2D or even three-dimensional (3-D) PA and ultrasound imaging with significantly reduced system cost. AcknowledgmentsThis work was supported in part by grants from the National Institutes of Health (R01 EB000712, R01 EB008085, R01 CA134539, U54 CA136398, and R01 CA157277). L. V. Wang has a financial interest in Microphotoacoustics, Inc. and in Endra, Inc., which, however, did not support this work. C. Kim and M. Jeon were supported by the University at Buffalo faculty start-up fund. C.-C. Chang and J. Zou were supported in part by a grant from the National Institutes of Health (U54 CA136398) and a grant from the National Science Foundation (CMMI-1131758). ReferencesA. A. OraevskyA. A. Karabutov, Biomedical Photonics Handbook, 3401
–3434 CRC Press, Boca Raton, FL
(2003). Google Scholar
C. KimC. FavazzaL. V. Wang,
“In vivo photoacoustic tomography of chemicals: high-resolution functional and molecular optical imaging at new depths,”
Chem. Rev., 110
(5), 2756
–2782
(2010). http://dx.doi.org/10.1021/cr900266s CHREAY 0009-2665 Google Scholar
L. V. Wang, Photoacoustic Imaging and Spectroscopy, CRC Press, Boca Raton, FL
(2009). Google Scholar
M. -L. Liet al.,
“Simultaneous molecular and hypoxia imaging of brain tumors in vivo using spectroscopic photoacoustic tomography,”
Proc. IEEE, 96
(3), 481
–489
(2008). http://dx.doi.org/10.1109/JPROC.2007.913515 IEEPAD 0018-9219 Google Scholar
T. WilsonC. Sheppard, Theory and Practice of Scanning Optical Microscopy, Academic Press, London
(1984). Google Scholar
D. A. Sipkinset al.,
“In vivo imaging of specialized bone marrow endothelial microdomains for tumour engraftment,”
Nature, 435
(7044), 969
–973
(2005). http://dx.doi.org/10.1038/nature03703 NATUAS 0028-0836 Google Scholar
W. DenkJ. H. StricklerW. W. Webb,
“Two-photon laser scanning fluorescence microscopy,”
Science, 248
(4951), 73
–76
(1990). http://dx.doi.org/10.1126/science.2321027 SCIEAS 0036-8075 Google Scholar
P. T. C. Soet al.,
“Two-photon excitation fluorescence microscopy,”
Ann. Rev. Biomed. Eng., 2
(1), 399
–429
(2000). http://dx.doi.org/10.1146/annurev.bioeng.2.1.399 ARBEF7 1523-9829 Google Scholar
Z. GuoL. LiL. V. Wang,
“On the speckle-free nature of photoacoustic tomography,”
Med. Phys., 36
(9), 4084
–4088
(2009). http://dx.doi.org/10.1118/1.3187231 MPHYA6 0094-2405 Google Scholar
H. F. Zhanget al.,
“Functional photoacoustic microscopy for high-resolution and noninvasive in vivo imaging,”
Nat. Biotechnol., 24
(7), 848
–851
(2006). http://dx.doi.org/10.1038/nbt1220 NABIF9 1087-0156 Google Scholar
X. Wanget al.,
“Non-invasive laser-induced photoacoustic tomography for structural and functional imaging of the brain in vivo,”
Nat. Biotechnol., 21
(7), 803
–806
(2003). http://dx.doi.org/10.1038/nbt839 NABIF9 1087-0156 Google Scholar
R. I. Siphantoet al.,
“Serial noninvasive photoacoustic imaging of neovascularization in tumor angiogenesis,”
Opt. Express, 13
(1), 89
–95
(2005). http://dx.doi.org/10.1364/OPEX.13.000089 OPEXFF 1094-4087 Google Scholar
J. Lauferet al.,
“Quantitative spatially resolved measurement of tissue chromophore concentrations using photoacoustic spectroscopy: application to the measurement of blood oxygenation and hemoglobin concentration,”
Phys. Med. Biol., 52
(1), 141
–168
(2007). http://dx.doi.org/10.1088/0031-9155/52/1/010 PHMBA7 0031-9155 Google Scholar
S. Yanget al.,
“Functional imaging of cerebrovascular activities in small animals using high-resolution photoacoustic tomography,”
Med. Phys., 34
(8), 3294
–3301
(2007). http://dx.doi.org/10.1118/1.2757088 MPHYA6 0094-2405 Google Scholar
L. Liet al.,
“Photoacoustic imaging of lacZ gene expression in vivo,”
J. Biomed. Opt., 12
(2), 020504
(2007). http://dx.doi.org/10.1117/1.2717531 JBOPFO 1083-3668 Google Scholar
A. De La Zerdaet al.,
“Carbon nanotubes as photoacoustic molecular imaging agents in living mice,”
Nat. Nanotechnol., 3
(9), 557
–562
(2008). http://dx.doi.org/10.1038/nnano.2008.231 1748-3387 Google Scholar
J. A. Coplandet al.,
“Bioconjugated gold nanoparticles as a molecular based contrast agent: implications for imaging of deep tumors using optoacoustic tomography,”
Mol. Imaging Biol., 6
(5), 341
–349
(2004). http://dx.doi.org/10.1016/j.mibio.2004.06.002 1536-1632 Google Scholar
S. Mallidiet al.,
“Molecular specific optoacoustic imaging with plasmonic nanoparticles,”
Opt. Express, 15
(11), 6583
–6588
(2007). http://dx.doi.org/10.1364/OE.15.006583 OPEXFF 1094-4087 Google Scholar
D. RazanskyV. Ntziachristos,
“Hybrid photoacoustic fluorescence molecular tomography using finite element- based inversion,”
Med. Phys., 34
(11), 4293
–4301
(2007). http://dx.doi.org/10.1118/1.2786866 MPHYA6 0094-2405 Google Scholar
C. Kimet al.,
“In vivo molecular photoacoustic tomography of melanomas targeted by bio-conjugated gold nanocages,”
ACS Nano, 4
(8), 4559
–4564
(2010). http://dx.doi.org/10.1021/nn100736c 1936-0851 Google Scholar
L. V. Wang,
“Multiscale photoacoustic microscopy and computed tomography,”
Nat. Photon., 3
(9), 503
–509
(2009). http://dx.doi.org/10.1038/nphoton.2009.157 1749-4885 Google Scholar
M. P. Fronheiseret al.,
“Real-time optoacoustic monitoring and three-dimensional mapping of a human arm vasculature,”
J. Biomed. Opt., 15
(2), 021305
(2010). http://dx.doi.org/10.1117/1.3370336 JBOPFO 1083-3668 Google Scholar
J. Gamelinet al.,
“A real-time photoacoustic tomography system for small animals,”
Opt. Express, 17
(13), 10489
–10498
(2009). http://dx.doi.org/10.1364/OE.17.010489 OPEXFF 1094-4087 Google Scholar
L. Songet al.,
“High-speed dynamic 3-D photoacoustic imaging of sentinel lymph node in a murine model using an ultrasound array,”
Med. Phys., 36
(8), 3724
–3729
(2009). http://dx.doi.org/10.1118/1.3168598 MPHYA6 0094-2405 Google Scholar
C. Kimet al.,
“Handheld array-based photoacoustic probe for guiding needle biopsy of sentinel lymph nodes,”
J. Biomed. Opt., 15
(4), 046010
(2010). http://dx.doi.org/10.1117/1.3469829 JBOPFO 1083-3668 Google Scholar
I. L. Auerbachet al.,
“Mercury delay line memory using a pulse rate of several megacycles,”
Proc. IRE, 37
(8), 855
–861
(1949). http://dx.doi.org/10.1109/JRPROC.1949.229683 PIREAE 0096-8390 Google Scholar
D. L. Arenberg,
“Ultrasonic solid delay lines,”
J. Acoust. Soc. Am., 20
(1), 1
–26
(1948). http://dx.doi.org/10.1121/1.1906343 JASMAN 0001-4966 Google Scholar
J. E. May,
“Wire-type dispersive ultrasonic delay lines,”
IRE Trans. Ultrason. Eng., 7
(2), 44
–52
(1960). http://dx.doi.org/10.1109/T-PGUE.1960.29263 IRUEAF 0096-1019 Google Scholar
G. D. BoydL. A. ColdrenR. N. Thurston,
“Acoustic clad fiber delay lines,”
IEEE Trans. Son. Ultrason., 24
(4), 246
–252
(1977). http://dx.doi.org/10.1109/T-SU.1977.30939 IESUAU 0018-9537 Google Scholar
T. MoriyaZ. HuY. Tanahashi,
“Development of flexible acoustic transmission line for intravascular ultrasonography,”
in IEEE Ultrason. Symp.,
1227
–1230
(2000). Google Scholar
J. S. Palfreeman,
“Acoustic delay lines-a survey of types and uses,”
Ultrasonics, 3
(1), 1
–8
(1965). http://dx.doi.org/10.1016/0041-624X(65)90232-5 ULTRA3 0041-624X Google Scholar
I. L. Gelles,
“Optical fiber ultrasonic delay lines,”
J. Acoust. Soc. Am., 39
(6), 1111
–1119
(1966). http://dx.doi.org/10.1121/1.1909998 JASMAN 0001-4966 Google Scholar
E. A. LindgrenM. RosenK. E. Amin,
“Ultrasonic characterization of ceramic fibres at ambient and elevated temperatures,”
Ultrasonics, 32
(6), 411
–419
(1994). http://dx.doi.org/10.1016/0041-624X(94)90059-0 ULTRA3 0041-624X Google Scholar
Panametrics Ultrasonics Transducers Data Sheet,
(2006). Google Scholar
M. XuL. V. Wang,
“Universal back-projection algorithm for photoacoustic-computed tomography,”
Phys. Rev. E, 71
(1), 016706
(2005). http://dx.doi.org/10.1103/PhysRevE.71.016706 PLEEE8 1063-651X Google Scholar
|