|
|
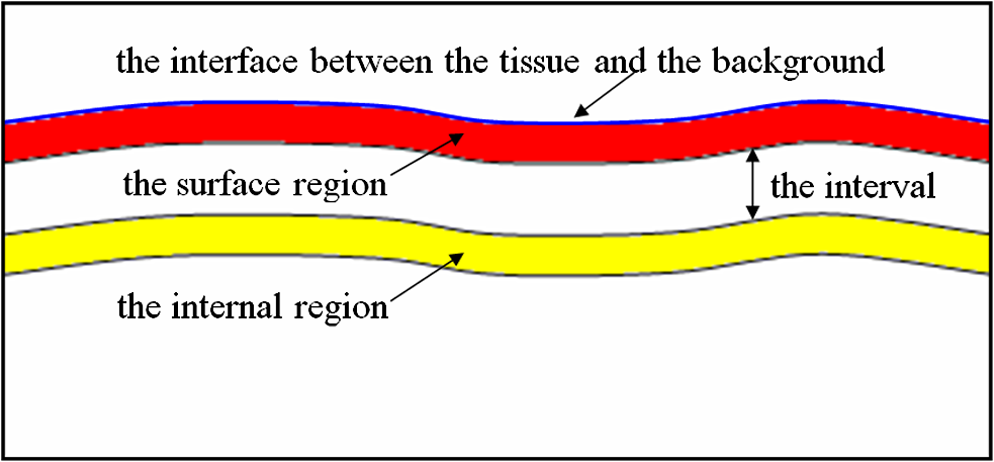
1.IntroductionAs the integumentary system, skin performs all kinds of functions, such as protection, heat regulation, control of evaporation, and excretion. Skin acts as the anatomical barrier from pathogens and damage between the internal and external environment and acts as the water resistant barrier so that essential nutrients cannot be washed out of the body. As the largest organ of human being, there are more than 2000 kinds of skin diseases. The exact diagnosis for a certain skin disease is important for its therapy. The advantage of conventional histopathology is high resolution, but it requires a pathological slice with an in vitro tissue specimen, whose processing is complicated and causes patients suffering. Therefore, studies of nondestructive, noninvasive, and in vivo detection technologies are of great concern. Various kinds of detection technologies are being studied, such as optical coherence tomography (OCT),1,2 confocal microscopy,3,4 nonlinear microscopy,5 laser spectroscopic methods,6 and ultrasound imaging. Compared with ultrasound imaging, optical detection technologies have excellent advantages in efficiency, cost, and resolution. However, owing to strong multiple scatterings in skin, the penetration intensity of light is markedly restricted. It is the main reason that optical technologies cannot be widely used in clinical applications,7,8 and that histopathology is still the dominant method in dermatology. The optical clearing technique, named by V. V. Tuchin,9 is a method by introducing some biocompatible chemical agents, called optical clearing agents (OCAs), to reduce multiple scattering and increase the optical penetration intensity in bio-tissue. It is found that hydrophilic agents, such as polyethylene glycol (PEG),9 glucose,10,11 glycerol,12–26 propylene glycol (PG),19 and dextran,27 can reduce the scattering and enhance light penetration in bio-tissue. However, it is a hard and slow process for these hydrophilic agents to go through the stratum corneum. In order to enhance the penetration of OCAs into the dermis, multiple methods have been carried out, such as micro-needles,28 photo-irradiation,29 and ultrasound.30 The agents with high concentration can also achieve good osmosis effects, but it may do some harm to the tissue. In addition, studies showed that a noninvasive way of incorporating a permeation enhancer could improve the osmosis effect in the stratum corneum. Some lipophilic agents can be added in OCAs to improve the delivery of agents in skin so as to achieve a better optical clearing effect, such as polypropylene glycol-based polymers (PPG),20 dimethyl sulfoxide (DMSO),22 oleic acid,22 azone,23 and thiazone.31,32 From the experimental results in vivo, human finger, and in vitro, skin of rat, we found that liquid paraffin can enhance the percutaneous penetration of glycerol and takes synergistically optical clearing effects with glycerol.33 In addition, adding liquid paraffin in glycerol can reduce water loss of tissue with elapsed time. Until now, studies are almost always based on healthy skin. For clinical applications, the ultimate goal of the optical clearing technique is to detect diseases, so optical clearing on diseased skins is investigated in this paper. Considering the excellent characteristics of liquid paraffin introduced in Refs. 33 and 34, such as appropriate refractive index, being lipophilic, capability of preserving moisture, and some medicinal values, we believe that it will have greater potential to be used in disease detection than other agents. Therefore, we have applied this mixture to some of the most familiar and typical skin diseases in clinics, such as fibroma, pigmented nevus, seborrheic keratosis, sebaceous cyst, hemangioma, etc. It is found that this agent is effective for some of them, but ineffective for others. Different diseased skins have different structures and compositions, so we think that the optical clearing technique has selectivity and may not be suitable for all kinds of skin diseases. 2.Materials and Methods2.1.Preparation of Samples and Chemical AgentsSamples of skin diseases were obtained from Department of Dermatology, Tianjin Medical University General Hospital, China. There are three samples of fibroma, five samples of pigmented nevus, four samples of seborrheic keratosis, two samples of hemangioma, and two samples of epidermoid cyst. All of them were cut from different parts of different patients. The samples were kept in physiological saline solution during transportation and storage to avoid dehydration in the air. According to Ref. 33, when liquid paraffin is mixed with anhydrous glycerol by volume ratio , the mixed solution displays the best optical clearing effect for in vitro samples. In addition, it can keep the structure of the tissue from deforming, which means it can balance between dehydration and moisture retention over a long time. Therefore, the same concentration mixed solution is used in our experiment. 2.2.Experimental SystemThe fiber-based OCT system consists of a broadband light source which has a central wavelength around 1550 nm, whose lateral resolution is , and axial resolution is in bio-tissue. Samples are placed on a translation platform. In order to maintain the identical sampling in the whole scanning process, the sample is nearly perpendicularly irradiated and the returned light is also collected perpendicularly. 2.3.Evaluation of the Optical Clearing EffectImages collected by the OCT system can be directly used to evaluate the optical clearing effect. In addition, some parameters have been used to evaluate it quantitatively.11,33,35–37 The optical clearing effect of OCAs can be revealed by the contrast variation of the internal tissue in OCT images. Intensity ratio of regions (RIR)33 is used in our paper to calculate quantitatively the contrast of the internal tissue and the surface. It is defined as follows, where and are the number of pixels in the internal and surface regions, respectively, and is the gray level in the OCT image. Pixels whose gray levels are larger than a certain threshold can be considered as the interface pixels between the tissue and the background. A region with a given thickness below the interface pixels is selected as the surface region. Under the surface region, a region with the same thickness is selected as the internal region. The larger the RIR is, the higher the relative intensity value between the internal and the surface is. The improvement of contrast is evaluated by calculating the ratio of RIR of OCT images with and without the agent. The larger the ratio of RIR is, the better the enhanced result is.A sketch map about the regions is given in Fig. 1. The blue curve on the surface represents the interface between the tissue and the background, and the red region and the yellow region represent the surface region and the internal region, respectively. From Fig. 1, we can see this method need not select the most flat region on the surface of the tissue to calculate and can avoid the effect of surface curvature. Of course, considering the effect of the focus depth, the results will be more accurate by using the flat region. 2.4.Measurement MethodThe experiment was carried out at 22°C room temperature. During the scanning process, the sample was put onto the culture dish directly and the lower part of the sample was soaked in the physiological saline solution to simulate the organism’s in vivo environment.12,38 The culture dish was placed on a translation platform. In order to calculate the ratio of RIR, three OCT images without the agent were first collected for each sample and the average of their RIR was regarded as the benchmark. Then, the agent was applied on the surface of the sample. OCT images were collected every 5 min in the next 40 min. In order to evaluate the optical clearing effect exactly, the distance between the OCT probe and the sample platform remained unchanged while collecting all OCT images for a certain sample. 3.ResultsConsidering the large surface curvature of hemangioma, we evaluated the optical clearing effect directly based on their OCT images before and after application of the OCA. For the two samples, we saw similar optical clearing effects after 10 min by application of the combined liquid paraffin and glycerol mixture. Figure 2 is of two OCT images of a sample of hemangioma. Figure 2(a) is the original image without any agent. Figure 2(b) is the image after about 15 min with the mixture on the same area. It can be seen that the imaging depth and contrast is improved effectively and the layered structure became more distinguishable after the agent diffused into the tissue. Fig. 2OCT images of hemangioma. (a) OCT image without the agent and (b) OCT image after application of the agent on the same area. 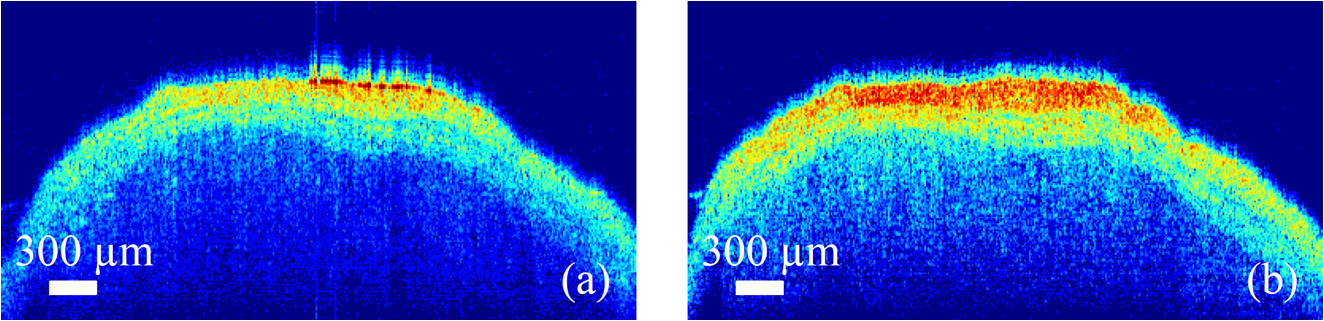 Figure 3 is a group of interesting OCT images we found during our experiments. The sample is epidermoid cyst. Figure 3(a) is the original image without the agent. Figure 3(b) to 3(f) are the images after the application of the agent on the same area in 5, 10, 15, 20, and 25 min, respectively. Before applying the agent, we can hardly see anything under the epidermis. However, after applying the agent from 5 to 10 min, a structure is clearly emerged in the dermis, which is similar to a cyst. The cystiform structure is indicated with a white arrow in each image of Fig. 3. It is shown that this kind of cystiform structure keeps away from the surface gradually with elapsed time from Fig. 3(c) to 3(f). We consider that the contents of the cyst are dehydrated with glycerol permeating, leading to the shrinkage of the cyst. From these results, we can conclude that the liquid paraffin glycerol mixed solution can really enhance the penetration of light. In addition, the skin surfaces are at nearly the same longitudinal position in Fig. 3(b) to 3(f), which indicates the moisture retention of liquid paraffin works as described in Ref. 33. From this result, it is further proven that liquid paraffin, as a kind of lipophilic agent, enhances the percutaneous penetration of glycerol and take synergistically optical clearing effect with glycerol. Fig. 3A group of OCT images of epidermoid cyst. (a) OCT image without the agent, and (b) 5 min, (c) 10 min, (d) 15 min, (e) 20 min, and (f) 25 min OCT images after application of the agent on the same area, respectively. The cyst is pointed out with a white arrow in each figure. 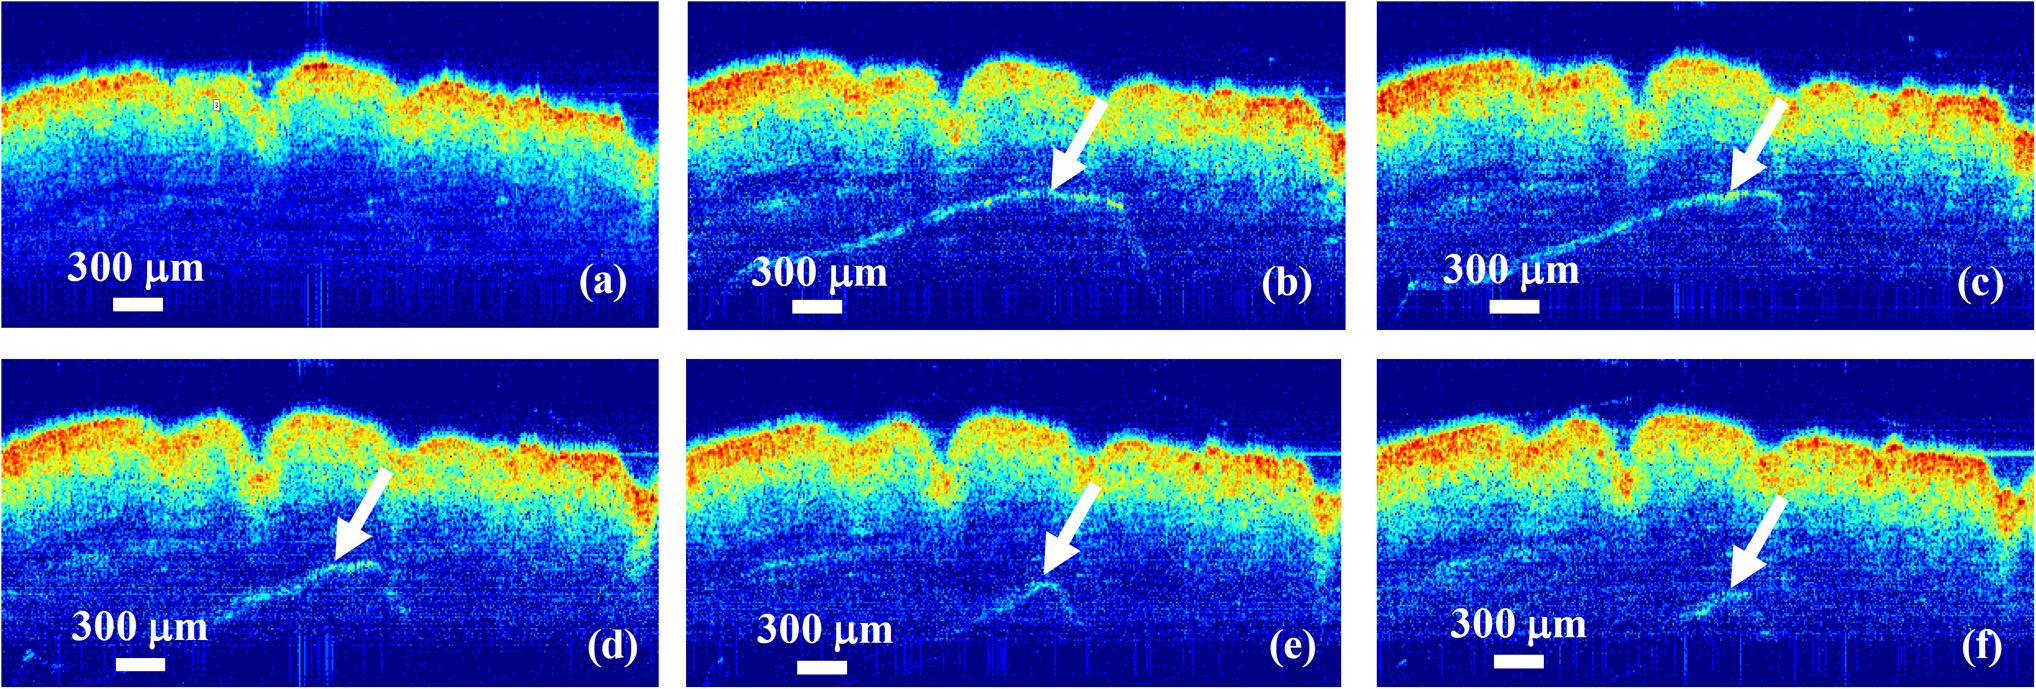 From Figs. 2 to 3 we see the contrast improvement of images after applying the combined liquid paraffin and glycerol mixture on these diseased skins. In order to evaluate its adaptability of this kind of combined mixture to skin diseases, we further scanned more skin disease specimens. The statistical results of the optical clearing evaluation of fibroma, pigmented nevus, and seborrheic keratosis are given in this paper. Figures 4 to 6 show the ratios of RIR with time elapsed after applying the agent on the surface of the specimen. Fig. 4Ratios of RIR of fibroma with time elapsed: (a) is the result at the 500 μm interval and (b) is the result at the 700 μm interval. Bars on the curve depict the maximum and minimum of RIR among the samples. 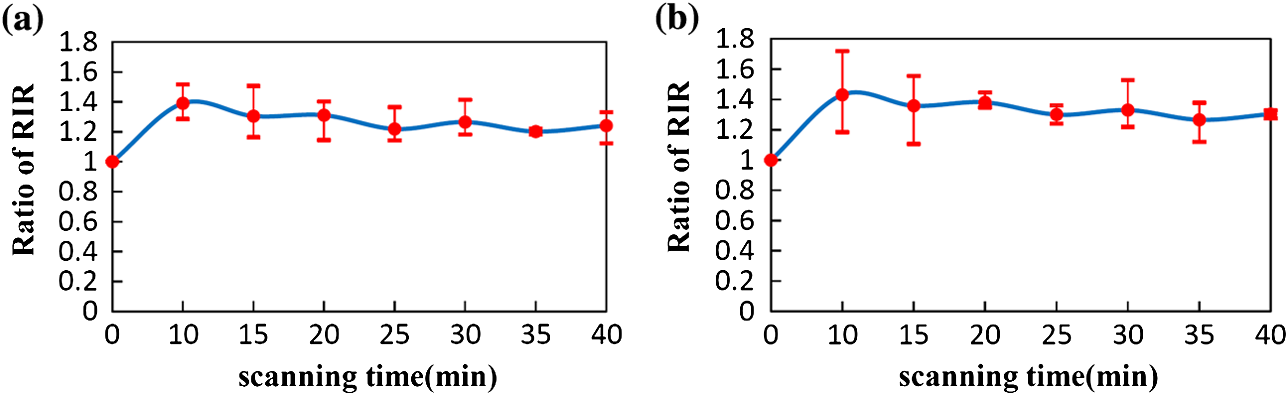 Fig. 5Ratios of RIR of pigmented nevus with time elapsed: (a) is the result at the 500 μm interval and (b) is the result at the 700 μm interval. Bars on the curve depict the maximum and minimum of RIR among the samples.  Fig. 6Ratios of RIR of seborrheic keratosis with time elapsed: (a) is the result at the 500 μm interval and (b) is the results at the 700 μm interval. Bars on the curve depict the maximum and minimum of RIR among the samples. 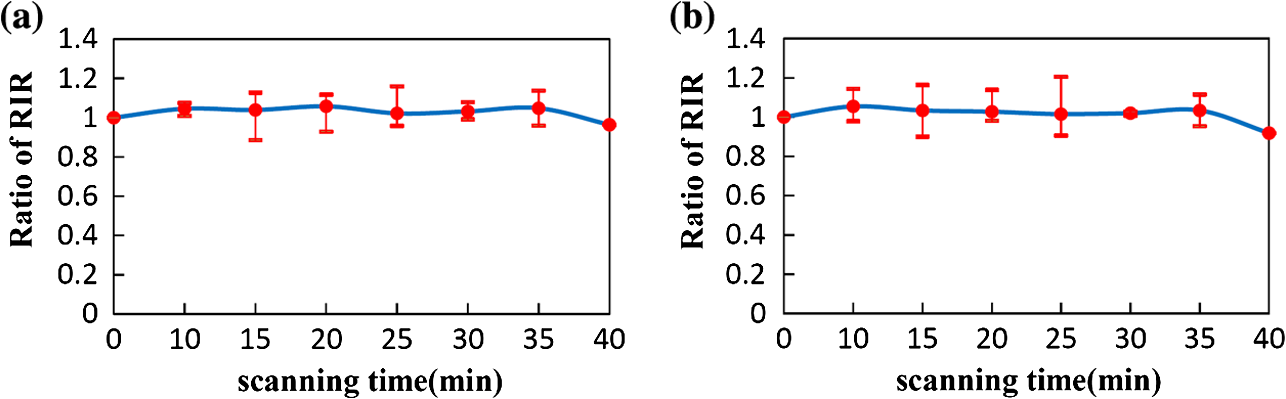 For each sample, OCT images every 5 min after applying the agent were collected. Their RIRs were calculated and divided by their benchmark to obtain the ratio of RIR with elapsed time. For all samples of each kind of diseased skin, their average ratio of RIR at the same time is calculated. It is shown with a solid curve in Figs. 4 to 6. The bars on the curve show the maximum and minimum ratios of RIR, which correspond to the best and worst optical clearing effects for a kind of skin diseases. Two intervals between the internal and surface regions, 500 and 700 μm, are selected to evaluate the enhancement of image contrast at different depths, which are shown in figure parts (a) and (b) in Figs. 4 to 6, respectively. The thickness and width of these two regions are both selected as 50 μm and 1 mm in calculating the RIRs, respectively. According to the scanning condition, and are both equal to 500. The values of the starting time 0 in Figs. 4 to 6 represent the normalized benchmark. From Fig. 4 it can be seen that after applying the agent, the ratios of RIR of fibroma with elapsed time are all larger than 1, which means that the liquid paraffin glycerol mixed solution has optical clearing effects for fibroma. However, from Figs. 5 and 6, it can be seen that after applying the agent, the average ratios of RIR of pigmented nevus and seborrheic keratosis are around 1, which indicates that the agent has little effect on their optical clearing. 4.DiscussionsThe optical clearing technique is a method by introducing some biocompatible chemical reagents to reduce multiple scattering and increase the optical penetration intensity in bio-tissue. At present, there are some typical hypotheses of the mechanism of the optical clearing technique, such as dehydration,39 index matching,40 and the effect of anti-reflection film. When the OCA permeates into the tissue, interstitial fluid is partly replaced by the OCA. Due to the stickiness and diffusion coefficient of the OCA, the speed of water leaving the cells is greater than that of OCA entering into the tissue space, so the cells are dehydrated. With the water flowing out of the cells, the intracellular and extracellular dehydration makes the cell matrix arrange more closely, leading to index matching between the scattering particles and the basement material. After applying the liquid paraffin glycerol mixed solutions on different skin diseases, we obtain different results of the optical clearing. We think that this is due to different structures and compositions with different kinds of bio-tissue, while the agent penetrates into the bio-tissue, the mechanism and effect of optical clearing will be different. A fibroma is a benign, tumor-like growth made up mostly of fibrous or connective tissue. After applying the agent, the thickness of dermis and diameter of collagen fibril decrease, and correspondingly the collagen fiber becomes more regular,21 which induce the skin of fibromas transparent and improve the penetration of light. An epidermoid cyst is a benign cyst usually found on the skin. The cyst develops out of the ectodermal tissue. Histologically, it is made of a thin layer of squamous epithelium, so it should have the same optical clearing mechanism as the healthy skin. A hemangioma is usually a benign tumor, swelling, or growth of the endothelial cells that line blood vessels and is characterized by an increased number of normal or abnormal vessels filled with blood. The refractive indices of glycerol and liquid paraffin are both about 1.47, and it is known that glycerol will induce tissue dehydration when it permeates, so we think after applying the agent, dehydration and index matching27 are the main mechanisms of its optical clearing. Pigmented nevus is a kind of common skin lesion. They are benign proliferations of melanocytes located at different skin layers. Because of the dense arrangement of the pigmented nevus cells, the agent can hardly permeate into the dermis, so it is almost ineffective for the pigmented nevus. Seborrheic keratosis is a kind of benign verrucous tumor, which occurs most frequently on the face, head, or trunk for aged persons. The surface of the papules is keratotic and often papillary or granular, resembling clay adhered to the skin. They can resemble warts, though they have no viral origins. Because the epidermis of seborrheic keratosis is hyperkeratotic, the agent can hardly permeate into the dermis, so it is almost ineffective for it. We applied this mixture to some of the familiar and benign skin diseases in clinics, and the most familiar and typical ones in clinics are given to show the optical clearing effect in this paper. From these results, we can see the liquid paraffin glycerol mixed solution is effective for some of them, but ineffective for others, which reveals that the optical clearing technique has selectivity and may not be suitable for all kinds of skin diseases. For the numbers of samples for each kind tissue, further investigation should be carried out in the future. More detailed theoretical study and experiments, such as the selection of OCAs and experiment conditions, should be further done if the optical clearing technique can be used in clinics. In addition, in order to study the mechanism of optical clearing of skin diseases in detail, the experimental data of their optical parameters, such as index of refraction, absorption coefficient, and scattering coefficient, are strongly required. 5.ConclusionIt is concluded from the experimental results that the liquid paraffin glycerol mixed solution can improve the penetration of light for some skin diseases in vitro. Little effect for two skin diseases implies that the optical clearing technique may not be suitable for all kinds of skin diseases. More detailed studies, including the characteristics of diseased skins and the mechanism of their optical clearing, should be carried out in the future. AcknowledgmentsThe authors acknowledge the support from the National Natural Science Foundation of China (Grant Nos. 60637020 and 60677012) and the Tianjin Foundation of Natural Science (No. 09JCZDJC18300). ReferencesJ. Welzel,
“Optical coherence tomography in dermatology: a review,”
Skin Res. Technol., 7
(1), 1
–9
(2001). http://dx.doi.org/10.1034/j.1600-0846.2001.007001001.x SRTEFN 0909-752X Google Scholar
J. WelzelM. BruhnsH. H. Wolff,
“Optical coherence tomography in contact dermatitis and psoriasis,”
Arch. Dermatol. Res., 295
(2), 50
–55
(2003). http://dx.doi.org/10.1007/s00403-003-0390-y ADREDL 0340-3696 Google Scholar
K. J. Busamet al.,
“Detection of clinically amelanotic malignant melanoma and assessment of its margins by in vivo confocal scanning laser microscopy,”
Arch. Dermatol., 137
(7), 923
–929
(2001). ARDEAC 0003-987X Google Scholar
A. L. BranzanM. LandthalerR.-M. Szeimies,
“In vivo confocal scanning laser microscopy in dermatology,”
Lasers Med. Sci., 22
(2), 73
–82
(2007). http://dx.doi.org/10.1007/s10103-006-0416-8 LMSCEZ 1435-604X Google Scholar
G. CoxC. J. R. Sheppard,
“Practical limits of resolution in confocal and non-linear microscopy,”
Microsc. Res. Tech., 63
(1), 18
–22
(2004). http://dx.doi.org/10.1002/(ISSN)1097-0029 MRTEEO 1059-910X Google Scholar
L. E. MeyerJ. Lademann,
“Application of laser spectroscopic methods for in vivo diagnostics in dermatology,”
Laser Phys. Lett., 4
(10), 754
–760
(2007). http://dx.doi.org/10.1002/(ISSN)1612-202X 1612-2011 Google Scholar
V. V. Tuchin,
“Optical clearing of tissues and blood using the immersion method,”
J. Phys. D: Appl. Phys., 38
(15), 2497
–2518
(2005). http://dx.doi.org/10.1088/0022-3727/38/15/001 JPAPBE 0022-3727 Google Scholar
E. A. GeninaA. N. BashkatovV. V. Tuchin,
“Tissue optical immersion clearing,”
Expert Rev. Med. Dev., 7
(6), 825
–842
(2010). http://dx.doi.org/10.1586/erd.10.50 1743-4440 Google Scholar
V. V. Tuchinet al.,
“Light propagation in tissues with controlled optical properties,”
J. Biomed. Opt., 2
(4), 401
–417
(1997). http://dx.doi.org/10.1117/12.281502 JBOPFO 1083-3668 Google Scholar
A. N. Bashkatovet al.,
“Optical clearing of skin tissue produced by application of glucose solution: in vivo study,”
Proc. SPIE, 6163 616313
(2006). http://dx.doi.org/10.1117/12.697313 PSISDG 0277-786X Google Scholar
E. A. Geninaet al.,
“Optical clearing of the eye sclera in vivo caused by glucose,”
Quantum Electron., 36
(12), 1119
–1124
(2006). http://dx.doi.org/10.1070/QE2006v036n12ABEH013337 QUELEZ 1063-7818 Google Scholar
G. Vargaset al.,
“Use of an agent to reduce scattering in skin,”
Lasers. Surg. Med., 24
(2), 133
–141
(1999). http://dx.doi.org/10.1002/(ISSN)1096-9101 LSMEDI 0196-8092 Google Scholar
R. K. Wanget al.,
“Concurrent enhancement of imaging depth and contrast for optical coherence tomography by hyperosmotic agents,”
J. Opt. Soc. Am. B, 18
(7), 948
–953
(2001). http://dx.doi.org/10.1364/JOSAB.18.000948 JOBPDE 0740-3224 Google Scholar
J. W. FluhrR. DarlenskiC. Surber,
“Glycerol and the skin: holistic approach to its origin and functions,”
Br. J. Dermatol., 159
(1), 23
–34
(2008). http://dx.doi.org/10.1111/j.1365-2133.2008.08643.x BJDEAZ 1365-2133 Google Scholar
C. G. Rylanderet al.,
“Dehydration mechanism of optical clearing in tissue,”
J. Biomed. Opt., 11
(4), 041117
(2006). http://dx.doi.org/10.1117/1.2343208 JBOPFO 1083-3668 Google Scholar
A. T. Yehet al.,
“Reversible dissociation of collagen in tissues,”
J. Invest. Dermatol., 121
(6), 1332
–1335
(2003). http://dx.doi.org/10.1046/j.1523-1747.2003.12634.x JIDEAE 0022-202X Google Scholar
J. Hirshburget al.,
“Collagen solubility correlates with skin optical clearing,”
J. Biomed. Opt., 11
(4), 040501
(2006). http://dx.doi.org/10.1117/1.2220527 JBOPFO 1083-3668 Google Scholar
J. Hirshburget al.,
“Correlation between collagen solubility and skin optical clearing using sugars,”
Lasers Surg. Med., 39
(2), 140
–144
(2007). http://dx.doi.org/10.1002/(ISSN)1096-9101 LSMEDI 0196-8092 Google Scholar
X. XuQ. Zhu,
“Feasibility of sonophoretic delivery for effective skin optical clearing,”
IEEE Trans. Biomed. Eng., 55
(4), 1432
–1437
(2008). http://dx.doi.org/10.1109/TBME.2007.912416 IEBEAX 0018-9294 Google Scholar
M. H. Khanet al.,
“Optical clearing of in vivo human skin: implications for light-based diagnostic imaging and therapeutics,”
Lasers Surg. Med., 34
(2), 83
–85
(2004). http://dx.doi.org/10.1002/(ISSN)1096-9101 LSMEDI 0196-8092 Google Scholar
X. Wenet al.,
“In vivo skin optical clearing by glycerol solutions: mechanism,”
J. Biophoton., 3
(1–2), 44
–52
(2010). http://dx.doi.org/10.1002/jbio.200910080 JBOIBX 1864-063X Google Scholar
J. JiangR. K. Wang,
“Comparing the synergistic effects of oleic acid and dimethyl sulfoxide as vehicles for optical clearing of skin tissue in vitro,”
Phys. Med. Biol., 49
(23), 5283
–5294
(2004). http://dx.doi.org/10.1088/0031-9155/49/23/006 PHMBA7 0031-9155 Google Scholar
X. XuQ. Zhu,
“Evaluation of skin optical clearing enhancement with azone as a penetration enhancer,”
Opt. Commun., 279
(1), 223
–228
(2007). http://dx.doi.org/10.1016/j.optcom.2007.06.055 OPCOB8 0030-4018 Google Scholar
X. XuR. K. Wang,
“The role of water desorption on optical clearing of biotissue: studied with near infrared reflectance spectroscopy,”
Med. Phys., 30
(6), 1246
–1253
(2003). http://dx.doi.org/10.1118/1.1576228 MPHYA6 0094-2405 Google Scholar
X. XuR. K. Wang,
“Synergistic effect of hyperosmotic agents of dimethyl sulfoxide and glycerol on optical clearing of gastric tissue studied with near infrared spectroscopy,”
Phys. Med. Biol., 49
(3), 457
–468
(2004). http://dx.doi.org/10.1088/0031-9155/49/3/008 PHMBA7 0031-9155 Google Scholar
Z. Maoet al.,
“Influence of alcohols on the optical clearing effect of skin in vitro,”
J. Biomed. Opt., 13
(2), 021104
(2008). http://dx.doi.org/10.1117/1.2892684 JBOPFO 1083-3668 Google Scholar
M. Brezinskiet al.,
“Index matching to improve optical coherence tomography imaging through blood,”
Circulation, 103
(15), 1999
–2003
(2001). http://dx.doi.org/10.1161/01.CIR.103.15.1999 CIRCAZ 0009-7322 Google Scholar
J. Yoonet al.,
“Enhancement of optical skin clearing efficacy using a microneedle roller,”
J. Biomed. Opt., 13
(2), 021103
(2008). http://dx.doi.org/10.1117/1.2907483 JBOPFO 1083-3668 Google Scholar
C. Liuet al.,
“Enhancement of skin optical clearing efficacy using photo-irradiation,”
Lasers Surg. Med., 42
(2), 132
–140
(2010). http://dx.doi.org/10.1002/lsm.v42:2 LSMEDI 0196-8092 Google Scholar
H. Zhonget al.,
“In vitro study of ultrasound and different-concentration glycerol–induced changes in human skin optical attenuation assessed with optical coherence tomography,”
J. Biomed. Opt., 15
(3), 036012
(2010). http://dx.doi.org/10.1117/1.3432750 JBOPFO 1083-3668 Google Scholar
D. Zhuet al.,
“Imaging dermal blood flow through the intact rat skin with an optical clearing method,”
J. Biomed. Opt., 15
(2), 026008
(2010). http://dx.doi.org/10.1117/1.3369739 JBOPFO 1083-3668 Google Scholar
X. Wenet al.,
“Enhanced optical clearing of skin in vivo and optical coherence tomography in-depth imaging,”
J. Biomed. Opt., 17
(6), 066022
(2012). http://dx.doi.org/10.1117/1.JBO.17.6.066022 JBOPFO 1083-3668 Google Scholar
J. Wanget al.,
“Evaluation of optical clearing with the combined liquid paraffin and glycerol mixture,”
Biomed. Opt. Express, 2
(8), 2329
–2338
(2011). http://dx.doi.org/10.1364/BOE.2.002329 BOEICL 2156-7085 Google Scholar
F. Sharifet al.,
“Liquid paraffin: a reappraisal of its role in the treatment of constipation,”
Arch. Dis. Child., 85
(2), 121
–124
(2001). http://dx.doi.org/10.1136/adc.85.2.121 ADCHAK 0003-9888 Google Scholar
M. G. Ghosnet al.,
“Differential permeability rate and percent clearing of glucose in different regions in rabbit sclera,”
J. Biomed. Opt., 13
(2), 021110
(2008). http://dx.doi.org/10.1117/1.2907699 JBOPFO 1083-3668 Google Scholar
M. G. Ghosnet al.,
“Permeability of hyperosmotic agent in normal and atherosclerotic vascular tissues,”
J. Biomed. Opt., 13
(1), 010505
(2008). http://dx.doi.org/10.1117/1.2870153 JBOPFO 1083-3668 Google Scholar
M. G. Ghosnet al.,
“Permeation of human plasma lipoproteins in human carotid endarterectomy tissues: measurement by optical coherence tomography,”
J. Lipid Res., 52
(7), 1429
–1434
(2011). http://dx.doi.org/10.1194/jlr.D015255 JLPRAW 0022-2275 Google Scholar
M. G. GhosnV. V. TuchinK. V. Larin,
“Depth-resolved monitoring of glucose diffusion in tissues by using optical coherence tomography,”
Opt. Lett., 31
(15), 2314
–2316
(2006). http://dx.doi.org/10.1364/OL.31.002314 OPLEDP 0146-9592 Google Scholar
T. Yuet al.,
“Quantitative analysis of dehydration in porcine skin for assessing mechanism of optical clearing,”
J. Biomed. Opt., 16
(9), 095002
(2011). http://dx.doi.org/10.1117/1.3621515 JBOPFO 1083-3668 Google Scholar
X. Wenet al.,
“Controlling the scattering of intralipid by using optical clearing agents,”
Phys. Med. Biol., 54
(22), 6917
–6930
(2009). http://dx.doi.org/10.1088/0031-9155/54/22/011 PHMBA7 0031-9155 Google Scholar
|