
|
|
1.IntroductionThe upper airway defined as from the nose to the carina serves important roles in respiration, consumption of nutrients, and phonation. Obstruction of the upper airway can adversely affect breathing and gas exchange especially during rest and can lead to obstructive sleep apnea (OSA) which affects an estimated 12 to 18 million Americans from every age group.1,2 Current diagnostic studies of upper airway obstruction include polysomnograms3 and imaging. However, full sleep studies are unable to provide information on upper-airway structure and anatomy that is very useful for understanding of the pathogenesis of upper airway obstruction, and they cannot identify the obstruction sites in patients, which is important for choosing the appropriate treatment, especially surgical intervention. Imaging modalities such as computed tomography (CT), X-ray cephalometry and magnetic resonance imaging (MRI) have been used to acquire structural information about the airway.4–6 However CT and X-ray cephalometry are limited especially for sustained time intervals due to ionizing radiation dosage. MRI can provide high signal-to-noise ratio images but typically requires sedation to prevent motion artifacts due to the length of the procedure time. Optical coherence tomography (OCT) is an imaging modality using nonionizing near infrared light to perform high resolution (), cross-sectional imaging of biological tissues.7 The development of an offshoot of conventional OCT known as anatomic or long-range OCT (LR-OCT) has allowed for the studying of upper-airway lumens with dimensions up to 30 to 40 mm.8,9 However, these studies were limited with low imaging speeds of 1 to 5 Hz, which precludes their use for real-time, dynamic monitoring and large three-dimensional (3-D) volume imaging over the entire upper airway. Fourier domain swept source OCT (SSOCT) exhibits both higher sensitivity and imaging speed; however, the imaging range is limited by the coherence length of the laser source. Furthermore, the inability to differentiate between positive and negative frequency terms resulting from the Fourier transform of the OCT signal results in a further reduction in imaging range. Previous studies have reported on full-range OCT imaging by utilizing an electro-optic modulator (EOM) or acousto-optic modulator (AOM), which provides a frequency shift in the interferometer signal and prevents the superposition of the positive and negative terms.10–12 In this paper, we present a full-range SSOCT system utilizing an AOM phase shifter combined with a fast-scanning endoscopic probe to acquire high-speed in vivo anatomical and structural image sets of the adult human upper airway with diameter of up to 30 mm. From these image sets, 3-D models were reconstructed. 2.Materials and MethodsThe full-range OCT system design is depicted in Fig 1(a). Output light from a 1310 nm swept source laser (26 mW average power, 50 kHz A-scan rate, 102 nm FWHM bandwidth, 5 mm coherence length in air, Axsun Technologies, Billerica, Massachusetts) is split by a 90-10 coupler into the sample and reference arms, respectively. In the reference arm, an AOM (Brimrose Corp., Sparks, Massachusetts) is used to generate a carrier frequency of 100 MHz. Since AOMs typically exhibit a fair amount of insertion loss, no modulator is used in the sample arm in order to maximize the sampled signal. Sampling is achieved using a 12 bit data acquisition card (Alazar Technologies Inc., Pointe-Claire, Quebec). A voltage-controlled oscillator (Mini-Circuits, Brooklyn, New York) is used to provide a 467 MHz sampling clock, allowing complete coverage of the entire wavelength sweep in 4096 points to optimize subsequent FFT calculations. A 1.2 mm proximal scanning endoscopic OCT probe was developed for 3-D imaging as shown in Fig. 1(b). Rotational scanning is accomplished by using a fiber optic rotary joint (Princetel Inc., Pennington, New Jersey) coupled with a rotational motor (Animatics, Santa Clara, California). Torque from the motor is translated from the proximal to the distal end of the probe by a triple wound commercial torque coil with an outer diameter (OD) of 0.965 mm (Asahi Intecc, Santa Ana, California). In order to achieve long-range imaging, the probe was designed to have an extended working distance of 20 mm. Focusing of the light is accomplished via a gradient index (GRIN) lens (0.23 pitch, 1 mm OD, GoFoton, Somerset, New Jersey) together with a precisely measured spacer made from no-core fiber. The no-core fiber was first spliced and then cleaved to leave a 280 µm portion at the end of standard single-mode fiber. The fiber and GRIN lens were attached with ultraviolet (UV) glue before placement within a custom-designed metal housing for protection. During imaging, the probe was proximally rotated within a protective fluorinatedethylenepropylne (FEP) sheath (1.8 mm OD, Zeus Inc., Orangeburg, South Carolina) at a rate of 25 frames per second. A dual motor linear stage (Zaber Technologies Inc., Vancouver, British Columbia) was used for linear translation, allowing for helical scanning over 20 cm in the span of 40 s. The axial resolution of the system was 10 µm in tissue and the lateral resolution at the focal point of the probe was 112 µm, which is mainly a tradeoff with extending the working distance of the probe. Processing of the OCT data follows the same algorithm described in Ref. 10. Dispersion caused by the AOM is removed computationally by multiplying each A-scan by the negative phase values obtained at a zero optical path length difference between the sample and reference arms. Our OCT software package is written entirely in C++ and features a multithreaded design for data acquisition, image processing, and display, which allows for maximizing computational throughput. The entire OCT algorithm is processed on a commercial graphical processing unit (Nvidia, Santa Clara, California) using Nvidia’s CUDA package. 3.Results and ValidationThe point spread function (PSF) versus imaging range graph shown in Fig. 2 was acquired by using a partial reflector at various distances and normalizing by the measured power. The system features a 6 dB sensitivity roll off at 9.5 mm total offset and a 10 dB roll off at 14 mm, which is in line with the expected imaging range given the removal of the mirror image. To test the imaging capabilities of our system, we constructed a phantom model from existing CT scans of an adult human. The slices were aligned and segmented to form a mold of the upper airway. From this mold, a full scale silicone phantom model was created. Comparisons between CT slice and acquired OCT images were highly correlated as expected and are shown in Fig. 3. Fig. 2Sensitivity of the system as the function of depth showing 9.5 mm imaging range for 6 dB roll off and 14 mm imaging range for 10 dB roll off.  Fig. 3Correlation between OCT scans in (a), (c), (e), (g) and CT scans in (b), (d), (f), (h) of the model upper airway. Vocal folds (VF), epiglottis (E), base of tongue (BT), soft palate (SP) are labeled.  In vivo adult human airway imaging was performed on five test subjects (UCI IRB 2003-3025). The sheath and probe were inserted into one nostril while a laryngoscope was inserted into the other to provide guidance of the probe and record the starting pullback position. Acquired OCT data is shown in Fig. 4 with an image size of 43 mm by 43 mm. Anatomical structures such as the epiglottis, base of tongue, the emergence of the soft palate, and adenoidal tissue can be clearly identified in Fig. 4(a)–4(d), respectively, by their distinct topographical characteristics and locations. Progressing from the hypopharynx to the nasopharynx, the epiglottis emerges as a ridge obscuring the anterior section of the pharynx. The base of tongue appears on the anterior wall, superior to the epiglottis, exhibiting an irregular topographic structure in contrast to the smooth surface of other tissue in the pharynx. The soft palate appears as a slight outward projection into the airway immediately above the base of the tongue. The adenoidal tissue lies on the posterior wall of the nasopharynx and exhibits similar structure to the base of tongue. Construction of 3-D data sets from the OCT images utilized a combination of commercial software packages. Although the upper airway is composed of many bends, the acquired OCT images assume a linear pullback. Previous reports have demonstrated the feasibility for position tracking in airway phantoms.9 However; these systems are generally still too large in size for in vivo applications. For preliminary modeling purposes, we utilized the acquired laryngoscope video as a guideline to reconstruct the airway bend with the software package COMSOL. Segmentation of the OCT slices was performed using the 3-D package MIMICS after which intra-frame interpolation was performed to enclose any gaps within the data set. A preliminary reconstructed 3-D isosurface model is shown in Fig. 4(e)–4(f). Fig. 4In vivo OCT images of human upper airway covering hypopharynx (a), oropharynx (b) and (c), and nasopharynx (d). 3-D rendering profile view (e) and front-on view (f) from in vivo data. Epiglottis (E), base of tongue (BT), soft palate (SP), adenoidal tissue (AT), right nasal cavity (NC) are labeled. 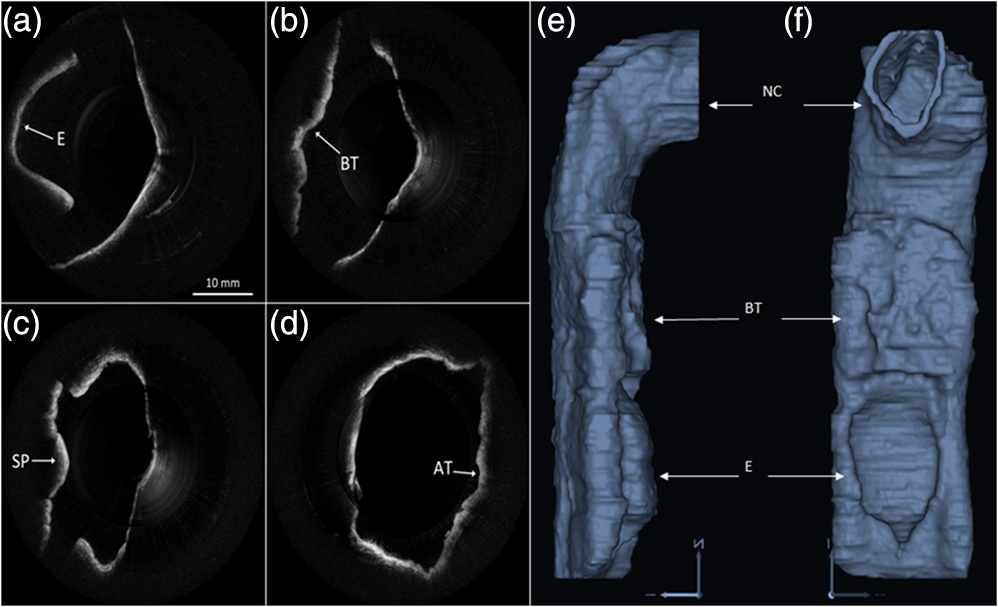 4.ConclusionWe have demonstrated a full-range OCT system for in vivo endoscopic imaging of the human upper airway. Imaging of upper airways with diameter of up to 3 cm was achieved in fully cognizant test subjects with minimal discomfort. Image acquisition from the bottom of the larynx up to the nasal cavity was achieved in 40 s with a frame rate of 25 frames per second. Three-dimensional models were created from the acquired OCT data sets. In the future, we plan to perform numerical simulations such as computational fluid dynamics on models in order to help physicians identify and quantify regions of airway obstruction and determine the best course of therapy. AcknowledgmentsWe would like to thank Dr. Amy Yau, Dr. Jennifer Lin, Mr. Danny Chou, Mr. Zhonglie Piao, Ms. Shanshan Liang and Mr. Emon Heidari for their assistance during the development and imaging process. Funding sources were the NIH (K25-HL102055, R01-HL103764, R01-HL105215, R01-EB10090, P41-EB015890), TRDRP 19KT-0034, AFOSR, and The Beckman Laser Institute Endowment. Zhongping Chen has a financial interest in OCT Medical Imaging Inc., which, however, did not provide support for this research. ReferencesC. Marcuset al.,
“Developmental Aspects of the Upper Airway, Report from an NHLBI Workshop March 5-6, 2009,”
Proc. Am. Thoracic Soc., 6
(6), 513
–520
(2009). http://dx.doi.org/10.1513/pats.200905-024CB PATSBB 1546-3222 Google Scholar
U.S. Department of Health and Human Services, “Your guide to healthy sleep,”
http://www.nhlbi.nih.gov/health/public/sleep/healthy_sleep.pdf Google Scholar
S. P. Patilet al.,
“Adult obstructive sleep apnea: pathophysiology and diagnosis,”
Chest, 132
(1), 325
–337
(2007). http://dx.doi.org/10.1378/chest.07-0040 CHETBF 0012-3692 Google Scholar
Z. Abramsonet al.,
“Age-related changes of the upper airway assessed by 3-dimensional computed tomography,”
J. Craniofac. Surg., 20
(5), 657
–663
(2009). http://dx.doi.org/10.1097/SCS.0b013e318193d521 JSURE8 1049-2275 Google Scholar
B. deBerry-BorowieckiA. KukwaR. H. Blanks,
“Cephalometric analysis for diagnosis and treatment of obstructive sleep apnea,”
Laryngoscope, 98
(2), 226
–234
(1988). http://dx.doi.org/10.1288/00005537-198802000-00021 LARYA8 0023-852X Google Scholar
R. Arens,
“Linear dimensions of the upper-airway structure during development: assessment by magnetic resonance imaging,”
Am. J. Respir. Crit. Care Med., 165
(1), 117
–122
(2002). AJCMED 1073-449X Google Scholar
D. Huanget al.,
“Optical coherence tomography,”
Science, 254
(5035), 1178
–1181
(1991). http://dx.doi.org/10.1126/science.1957169 SCIEAS 0036-8075 Google Scholar
J. Armstronget al.,
“In vivo size and shape measurement of the human upper airway using endoscopic long-range optical coherence tomography,”
Opt. Express, 11
(15), 1817
–1826
(2003). http://dx.doi.org/10.1364/OE.11.001817 OPEXFF 1094-4087 Google Scholar
B. Lauet al.,
“Imaging true 3-D endoscopic anatomy by incorporating magnetic tracking with optical coherence tomography: proof-of-principle for airways,”
Opt. Express, 18
(26), 27173
–27180
(2010). http://dx.doi.org/10.1364/OE.18.027173 OPEXFF 1094-4087 Google Scholar
J. ZhangJ. NelsonZ. Chen,
“Removal of a mirror image and enhancement of the signal-to-noise ratio in Fourier-domain optical coherence tomography by use of an electro-optical phase modulator,”
Opt. Lett., 30
(2), 147
–149
(2005). http://dx.doi.org/10.1364/OL.30.000147 OPLEDP 0146-9592 Google Scholar
S. Yunet al.,
“Removing the depth-degeneracy in optical frequency domain imaging with frequency shifting,”
Opt. Express, 12
(20), 4822
–4828
(2004). http://dx.doi.org/10.1364/OPEX.12.004822 OPEXFF 1094-4087 Google Scholar
A. DavisM. ChomaJ. Izatt,
“Heterodyne swept-source optical coherence tomography for complete complex conjugate ambiguity removal,”
J. Biomed. Opt., 10
(6), 064005
–064006
(2005). http://dx.doi.org/10.1117/1.2136147 JBOPFO 1083-3668 Google Scholar
|


