
|
|
1.IntroductionBrain tumors represent 85% to 90% of the tumors found in the primary central nervous system tumors. In 2011, 22,910 new cases were diagnosed, and 13,700 deaths from brain and other nervous system cancers were reported in the United States. This statistical data indicated that race and sex factored into the incidence of primary brain cancers, where it was found that whites have a higher incidence than blacks, and mortality is higher in males than in females.1 The brain and the spinal cord comprise the primary central nervous system (CNS). The primary origin in brain cancer is from brain neoplasm cells, with the secondary origin being the metastatic cancerous cells travelling from other organs through the blood. Gliomas comprised of glioblastoma multiforme, astrocytoma, oligodendroglioma and ependymoma, are the main primary brain tumors occurring in over 70% of brain cancer cases. Malignant gliomas are the most aggressive, lethal and incurable, and meningiomas are common primary brain tumors comprising approximately 27% of brain cancer cases. Meningeal tumors are formed in the meanings—the thin layers of tissue that covers the brain and spinal cord. Types of meningioma tumors range from benign, grade I, with slow growing, and to grades II and III, which are rare, but rapidly growing.2 The conventional biomedical method for the analysis and diagnosis of brain tissue lesions is to extract a tissue sample, followed by histopathological examination and analysis based on the morphology of the biopsy specimens. Although this has been the procedure for the detection of human tumor lesions, conventional histopathology has disadvantages: the process is invasive; detection is not performed in situ, the long specimen processing time, and the varying levels of precision of the pathologist’s eye in the reading and analysis of the specimens. Other than histochemical analysis, in situ methods for the examination of brain tumors are including magnetic resonance imaging (MRI), x-ray scans, computed tomography (CT) images, ultrasound sonography (US), and positron emission tomography (PET), which are performed before and after surgery to determine the location and form of the lesions. However, to clearly identify tumor margins, visual inspection and palpation of tissues are needed. In early diagnosis, histochemical analysis by a pathologist results in a 90% detection rate from brain tissue biopsies. While CT and MRI imaging are predicative for locating intracranial tumors, the accuracy of these imaging methods for diagnosis is inferior to histochemical analysis, with a diagnostic accuracy of 66% and 63%, respectively, according to a 1995 report.3,4 Optical methods provide an accurate real-time diagnosis during surgery and offer advantages over current conventional methods. The optical spectroscopy technique was used first by Alfano et al. for detecting human pre and early cancer stages in vivo in a number of organ sites, in many different types of cancers.5–9 In 1987, Alfano et al. using 457 and 480 nm excitations, first reported Raman spectra collected from human breast tissue.6 Later in 1991, a detailed investigation of Raman spectroscopy probed the vibrational states7 of spectra collected from normal breast and cancerous breast tissues using a near infrared (NIR) excitation at a wavelength of 1064 nm. Since then, the field of optical biopsy (OB) has grown. Now OB is widely used as a characterization method for biological research and biomedical diagnosis, including the detection of cancer lesions. Most recently, progress has been achieved in situ using a method based on optical spectroscopic diagnosis without the removal of the tissue in the analysis of breast, precancerous cervical and gastric cancer tissues.10–15 Optical biopsy techniques have emerged as promising powerful techniques for in vitro and in situ diagnosis with high accuracy in situ, real-time margin assessment for surgical resection of gross malignant brain tumors, and for many medical treatments and testing procedures. The optical biopsy approach is based on the analyses of the changes in biochemical component composition on the molecular level from the native fluorescence profiles, Stokes shift emission spectral intensities,13 the Raman frequency peaks (molecular fingerprints), and the intensity ratios presented in the signal spectra collected from cells and tissues. Pathologic alterations of cells and tissues are accompanied by fundamental changes in cellular biochemistry, which can be analyzed by using Raman spectroscopy.6–8 Raman and fluorescence spectroscopies could soon be added to the mix of armamentarium diagnostic tools for the medical community for clinical analysis. Raman spectroscopic technique has been successfully applied in the diagnosis of cancers such as those of the skin, breast, esophagus, colorectal, gynecological (GYN)-cervix, and the urogenital tract and provides information about the molecular composition, molecular structures, and molecular interactions in a tissue.16,17 Recently, several Raman studies have constituted a basis for subsequent studies to develop classification models for the diagnosis of human brain tumors.18–22 The resonance effect in resonance Raman (RR) spectroscopy occurs when the energy of the excitation laser is adjusted such that it and/or the scattered photos approach the energy of an electronic transition of the molecule to an excited state. As the energy of the excitation approaches an optical transition energy level, the vibrational resonance effect occurs that greatly enhances the scattering, and thus the peak intensities in the Raman spectra increase by as much as 1000-fold. The peaks from nonresonance-enhanced molecules seemingly disappear under the intensity of the resonance-enhanced spectral peaks. Chromophores, and other large conjugated molecules, experience stretching and bending vibrations that can be enhanced by the excitation laser and the RR spectra collected from them exhibit-enhanced peaks. Since cells and tissues contain so many large biomolecules with multiple vibrations, the many advantages of RR spectroscopy for biomedical diagnosis over conventional Raman include the spectra collected from resonance enhanced molecules can be detected at molecular concentrations less than 1.0 nM and the activity of particular molecular species can be targeted preferentially. Specific biomolecules in the cell and organelles contain fluorophores, such as flavins, NADH, collagens, elastin, carotenoid and the heme proteins, such as the mitochondrial cytochromes. This study focuses on RR spectra from of six types of brain tissues in vitro using confocal micro-Raman system with an excitation wavelength of 532 nm over a spectral scan region of 500 to and investigates the potential of RR spectroscopy for distinguishing between normal brain tissues and malignant brain tissues. 2.Materials and Methods2.1.Tissue SpecimensHuman glioblastoma multiforme tumor diagnosed as malignancy stage grade IV, acoustic neuroma benign, pituitary adenoma benign and malignant meningioma diagnosed as malignancy stage grade III, benign minigioma by postoperative histopathology and immunohistochemistry analysis and normal meningeal brain tissues were obtained from the General Hospital of the Air Force, Beijing, China. The malignancy stages are according to the World Health Organization (WHO) standard. The experimental procedures were approved by the committee of the General Hospital of the Air Force, Beijing, China. The tissue specimens came from patients from 27 to 56 years old, 70% of them were over 50 years, and 29% of the human brain tissues were from female patients. Specimens were not chemically treated prior to the spectroscopic studies. The tissue specimens arrived frozen and kept under snap-frozen condition, uncut, and in irregular shapes. They were thawed to ambient room temperature for the spectroscopic studies. Most specimens were measured within 36 h post-surgery. Specimens of random shapes were mounted on a quartz plate for Raman spectral measurement. 2.2.Acquisition of RR Spectra of Brain TissuesThe RR spectra were collected using a multichannel modular triple Raman system (JY-HR800 France) with confocal laser micro-Raman spectrometer at the 532-nm excitation wavelength. The excitation light beam was directly shining on the surface of specimen. The exposure time was 60 s for one scan region, and for the full region (four local regions), the scan time was . The average size of the samples was approximately . A microscope objective lenswas used for focusing the laser beam and collection of the scattered signals. The spot diameter of the focused laser beam on the sample position is about 1 μm. The solid-state diode laser (532 nm) from Coherent Company-Verdi-2 with 3.5 mW was used as an excitation source. The laser power on the sample was kept with 0.9 mW. All measurements were taken at room temperature. The final spectral resolution was in the range of interest (200 to ). A total of 43 Raman spectra were acquired from seven subjects using the confocal micro-Raman system. In the inhomogeneous lesion, the spectral collection needs at least seven scan sites for each local area—e.g., fat part (yellow), hemorrhage area (red), and regular parts—were measured carefully. The results of spectroscopic measurements were then analyzed and compared to the pathology and immunohistochemistry report. 2.3.Analysis Method of Support Vector MachineSince RR spectra are sampled into a higher-dimensional space, training of a classifier might be suffered from the “curse of dimensionality.” By the principal component analysis (PCA), the spectral data can be project onto the subspace spanned by a small number of principal components (PCs), thus significantly reducing dimensionality while reserving most power of data. Specifically, the matrix of Raman spectral data of all samples are decomposed into where is the diagonal matrix of nonnegative singular values in the descending order, and are the matrices of column and row singular vectors. is the power of data in the dimension of the ’th singular vector. Column singular vectors , or most significant PCs, are chosen such that most power of the data are located in the subspace spanned by them. The power usage of the selected PCs is defined as the ratio of power located in the subspace to the total power of data, which can be calculated byA support vector machine (SVM) with a linear kernel can be expressed as which is a hyperplane. The data projected onto the subspace are used to train the SVM classifier by specifying and . The sensitivity and specificity in classifying the spectral data are then calculated. If the distance of the classifier to the origin was adjusted while maintaining the normal direction , the sensitivity and specificity correspondingly change, forming the receiver-operating characteristic (ROC). The closer to one the area under the curve (AUC) of ROC is, the better the performance is.3.Results and DiscussionFive types of brain tumors and normal meningeal brain tissues were investigated by RR spectroscopic method within the scan region 500 to using a 532-nm excitation wavelength. The resonance enhanced Raman modes were observed, and the differences of RR spectra were found between cancer and normal meningeal tissues. 3.1.RR Spectra of Glioblastoma Multiforme Grade IV, Acoustic Neuroma, and Pituitary AdenomaFigure 1 shows the RR spectra of glioblastoma multiforme tumor tissue diagnosed as grade IV (top), benign human acoustic neuroma lesion (center), and benign human pituitary adenoma lesion (bottom) that were collected in vitro using the confocal micro-Raman system with an excitation wavelength of 532 nm within a scan region from 500 to . In all of the three RR spectra in Fig. 1 at the top, center, and bottom plots, the amide I, amide II, and amide III peaks were clearly enhanced. The amide II band near exhibited intense resonance enhancement at excitation 532 nm, possibly duo to the amide II mode in active at this excitation wavelength. The results showed that for the amides (amide I near , amide III near ) have demonstrated selectively enhanced by the excited wavelength at 532-nm amide electronic transition, while the amide I and amide III show less enhancement from this transition. Fig. 1The RR spectra recorded from three types of brain tissues. The top of Raman spectrum was from glioblastoma multiforme, grade IV tissue. The center of Raman spectrum was from acoustic neuroma benign tissue, and the bottom of Raman spectrum was from pituitary adenoma benign tissues.  Typically, glioblastoma cells display somatic gene alterations, which products have a negative impact on the cellular regulatory processes of growth; the cells’ response to extracellular signals; and cell-cycle control. The RR spectra collected from the gliomas showed in the top of Fig. 1. The Raman spectrum of glioblastoma multiforme grade IV tissue (Fig. 1, top) displayed a total of 22 peaks, 10 of which demonstrated strong enhanced modes at 752, 1004, 1172, 1337, 1358 1547, 1587, 1606, 2896, and . Characteristic enhanced Raman peaks at 1547 (amide II), 1587, 1606, and were assignable to proteins and collagen types I and IV showing the enhancement comparison with the previous reports.23–26 The RR spectra collected from the benign acoustic neuroma (vestibular schwannomas) lesion (Fig. 1, center), which is a noncancerous lesion that develops on the nerve that connects the ear to the brain and usually grows slowly. RR spectra collected from benign acoustic neuroma tissue displayed 18 resonance-enhanced peaks, with 12 strong enhanced peaks at 648, 757, 1004, 1155, 1338, 1357, 1551 cm, 1585, 1607, 1639, 2888, and . Displayed at the bottom of Fig. 1 is a typical RR spectrum from the benign pituitary adenoma lesion. A pituitary tumor is an abnormal growth in the pituitary gland, the part of the brain where hormones are regulated and the body’s balance of hormones are controlled. These lesions are most noncancerous (benign). The RR spectra were measured from pituitary adenoma benign tissue. Thirteen Raman peaks were observed in which nine distinct vibrational modes at 750, 1005, 1130, 1173, 1543, 1585, 1667, 2882, and were clearly enhanced. The RR spectra of amide I band of 1645 to observed in the spectra that may be assigned to active pituitary adenoma tissue.27–29 3.2.RR Spectra of Cancer, Benign, and Normal Meningeal Brain TissuesThe RR spectra from three types of the meningeal brain tissues are represented in Fig. 2. The RR spectra from the malignant menigioma grade III (top, cancer), the benign menigioma (center), and the normal (bottom) menigngeal tissues were measured within the region from 500 to using a confocal micro-Raman system. Table 1 lists the position of Raman spectra in wavenumbers of the observed peaks and their assignments.18,20,30–33 The RR spectra with the relative enhanced peaks at 750, 1004, 1156, 1358, 1548, 1587, 1605, and and the broad peaks near to were observed in cancerous tissue (Fig. 2, top). When comparing the spectra collected from the malignant meningioma tissue with that collected from the benign lesions (Fig. 2, center) and the normal meningeal (Fig. 2, bottom) tissues, the RR spectra give a higher signal to noise ratio and more intense enhancement, as has been previously reported.14,16,18,21,25 Fig. 2The RR spectra recorded from three types of meningeal tissues. The Raman spectra showed from top to bottom as the Raman spectrum of malignant meningioma tissue: grade III (a); the Raman spectrum of meningioma benign tissue (b); and Raman spectrum of normal meningeal tissue (c).  Table 1Raman band frequencies and assignments of Brain Tissue.
We identified an enhancement mode of amide II. In the RR spectra, the excitation wavelength of 532 nm makes the amide II mode active. Amide II is one of the nine amide bands of protein, which was resonance enhanced in the three types of meningeal tissues (usually the amide II band is weak or absent in the nonRR system) was shown in Fig. 2. The amide I and amide III bands show fewer enhancements from this transition or explained in less active. Near is assigned to the phenyl ring-breathing mode of phenylalanine. The spectral peak intensities were normalized to the intensity near the peak, assigned to the breathing mode of phenylalanine, for calculation and comparisons amongst peak intensities (Fig. 2), due to the relative stability of intensity and position of the peak due to different environments. A clear and obvious increased in the intensity ratios of (arising from cytochrome c/mitochondria) to (arising from phenelalanine and tyrosine) were calculated from Fig. 2 as 0.97:0.89:0.88, which displayed the differences between the cancer, benign and normal meningeal tissues. This phenomenon may propose that the differences (increased the intensity in cancer of Raman peak at ) arise during the cancer cells transformations, the cytochrome c might be released from the mitochondrial membrane since the cancer cells cause of the mutation of the mitochondria in the cancer tissue. Methyl () symmetric stretching was observed as a strong band in Raman at . The peak intensity ratio of (methyl bond ) to (methylene bond ), and the width of board profile range between 2850 and were calculated for the three types of the meningeal tissues from the spectra displayed in Fig. 2. An increased in the width (border) of board profile in the range between 2800 and was observed for malignant meningeoam. The ratios of the width (border) of board profile at cancer: benign: normal were found to be , respectively. A decrease in the methyl to methylene intensity ratios was calculated from Fig. 2 to be , for the spectra collected from the cancerous, benign and normal meningeal tissues, respectively, which suggests the changes of the molecular conformation order. It is supposed that the cancer cells are an abnormal mass in which the cells grow faster with multiple uncontrollably and invading control normal cells. The growth of a tumor also takes up more space within the skull and interferes with normal brain activity. This may cause disorder in tumors as the observed variation in the ratio. Normal tissue cells have a higher molecular conformation order coefficient than tumors. Normal tissue cells should exhibit a more stable biochemistry and metabolism than will tumor cells.20,34–36 3.3.RR Spectral Data Analysis of Cancer, Benign and Normal Meningeal Brain Tissues by SVM MethodThe statistical analyses of the RR data collected from the tissues using the PCA, SVM, and ROC methods37,38 yielded a diagnostic sensitivity of 90.9% and specificity of 100% for ROC using two PCs, when compared with the histopathology and immunohistochemical analysis (the “gold standard”) for the classification amongst the spectra of malignant meningioma brain tissue; meningeal benign lesions, and normal meningeal tissues. Direct comparisons between the spectra data collected are displayed in Fig. 3 and in Table 2. In Fig. 3, the separating lines were calculated using the SVM algorithm, that yields a diagnostic sensitivity of 90.9% and a specificity of 100% for classifying the spectra collected from cancerous tissues from the spectra from benign and normal brain tissue. Table 2 illustrates how the performance of the SVM classifier is improved as the power of data samples located in the subspace spanned by the selected PCs increases. The identifications are shown to be effective for the Raman spectral diagnosis and classification of brain tissues. Fig. 3The scatterplot of the posterior probability of classification for the malignant, benign, and normal brain tissues were using PC1 and PC4 as diagnostically significant components. The separating lines were calculated using SVM algorithm, which yields a diagnostic sensitivity of 90.9% and specificity of 100% for identifying cancer from benign and normal brain tissue. 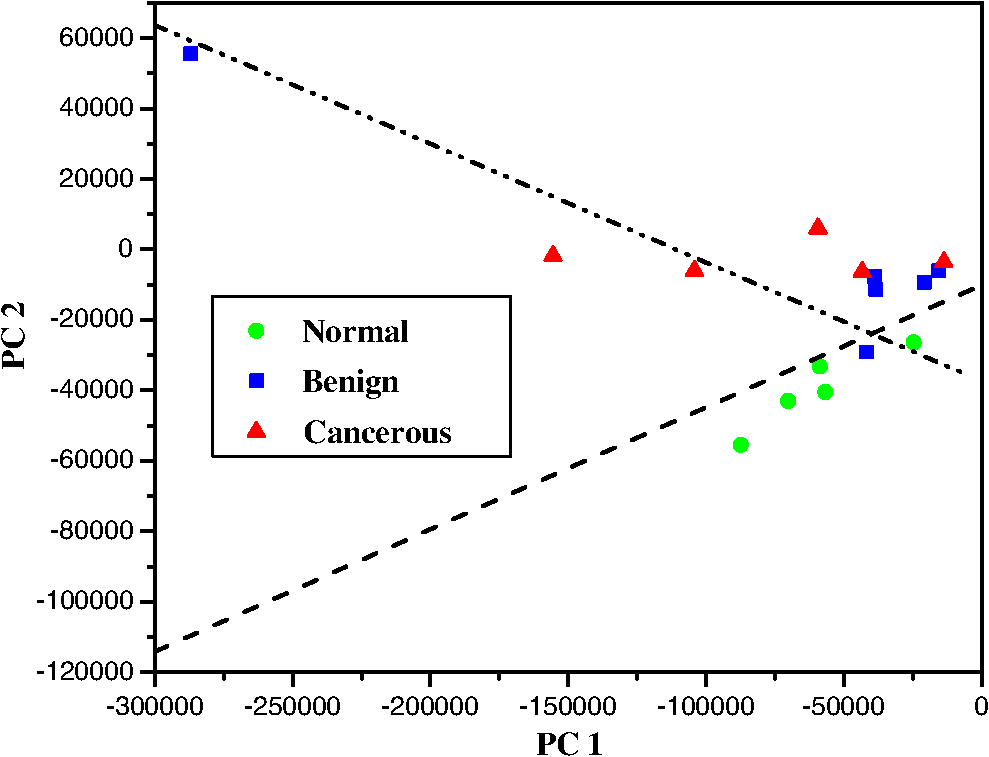 Table 2Performance in classifications.
4.ConclusionThe results presented here demonstrate the potential of RR spectroscopy to successfully discriminate among normal brain tissues, cancerous brain tumors, and benign brain lesions using the excitation wavelength of 532 nm. The RR spectra from different types of brain tissues within spectral region 500 to were collected using confocal micro-Raman system. The RR characteristic spectra of proteins (amides) and type I and type IV collagen yielded enhanced peaks at 1088 and were found in the spectra collected from malignant meningioma tumor, diagnosed as grade III brain tissues. The first characteristic mode, an intense enhancement of amide II at might be used as an indicator of RR frequency using excitation wavelength at 532 nm. In the high frequency region between 2500 and , bands due to symmetric stretch vibration, the peaks intensity ratio of methyl to methylene groups may suggest as a statistical method (a disorder or order molecular conformation coefficient) to distinguish the spectra collected from malignant meningioma from normal meninges brain tissues. Normal meningeal brain tissue has a higher order coefficient compared with malignant meningioma meningeal tissue. The statistical analysis method of the RR data in preliminary yielded a diagnostic sensitivity of 90.9% and specificity of 100% for ROC when two PCs was used for classification of three types meningeal brain tissues. The identifications demonstrated to be effective for the RR spectroscopy and shows potentials as a method for the diagnosis and classification of brain lesions in clinical use in the future. The differences in increased peak intensity in mode , increased width (border) of board profile in range between 2800 and , and the lower molecular conformation order coefficient [the ratio of methyl to methylene bond ()] in the RR spectra were observed from cancerous tissues, which has the potential to reveal an important mechanism in the process of human brain carcinogenesis. In addition, these in vitro results indicate that RR spectroscopy could be used as a new technique as a tool for the guidance of stereotactic brain biopsy in real-time. AcknowledgmentsThis research is supported in part by the General Hospital of the Air Force, China, and U.S. Army Medical Research and Material Command (USAMRMC) under grant of # 81XWH-11-1-0335 (CUNY RF # 47204-00-1). We are also grateful to Mr. C. Y. Zhang, Professor R. C. Zuzolo and Mr. M. Z. Fan for their assistance in all the experiments and critical suggestions for concerning the manuscript. ReferencesM. MehtaM. A. VogelbaumS. Chang,
“Neoplasms of the central nervous system,”
Cancer: Principles and Practice of Oncology, 1700
–1749 9th ed.Lippincott Williams & Wilkins, Philadelphia, Pa
(2011). Google Scholar
G. Sze,
“Diseases of the intracranial meninges: MR imaging features,”
Am. J. Roentgenol., 160
(4), 727
–733
(1993). AJROAM 0092-5381 Google Scholar
S. H. T. ZahirM. R. SadrabadiF. Dehghani,
“Evaluation of diagnostic value of CT scan and MRI in brain tumors and comparison with biopsy,”
Iranian J. Ped. Hema. Onco., 1
(4), 121
–125
(2011). Google Scholar
F. H. Gilleset al.,
“Limitations of the World Health Organization classification of childhood supratentorial astrocytic tumors. Children Brain Tumor Consortium,”
Cancer, 88
(6), 1477
–83
(2000). http://dx.doi.org/10.1002/(ISSN)1097-0142 60IXAH 0008-543X Google Scholar
R. R. Alfanoet al.,
“Laser induced fluorescence spectroscopy from native cancerous and normal tissue,”
IEEE J. Quant. Electron., 20
(12), 1507
–1511
(1984). http://dx.doi.org/10.1109/JQE.1984.1072322 IEJQA7 0018-9197 Google Scholar
R. R. Alfanoet al.,
“Fluorescence spectra from cancerous and normal human breast and lung tissues,”
IEEE J. Quant. Electron QE, 23
(10), 1806
(1987). http://dx.doi.org/10.1109/JQE.1987.1073234 IEJQA7 0018-9197 Google Scholar
R. R. Alfanoet al.,
“Human breast tissues studied by IR Fourier transform Raman spectroscopy,”
Lasers Life Sci., 4
(1), 23
–8
(1991). LLSCES 0886-0467 Google Scholar
C.-H. Liuet al.,
“Raman, fluorescence, and time-resolved light scattering as optical diagnostic techniques to separate diseased and normal biomedical media,”
J. Photochem. Photobiol. B, 16
(2), 187
–209
(1992). http://dx.doi.org/10.1016/1011-1344(92)80008-J JPPBEG 1011-1344 Google Scholar
Y. Puet al.,
“Changes of collagen and NADH in human cancerous and normal prostate tissues studied using fluoroscence spectroscopy with selective excitation wavelength,”
J. Biomed. Opt., 15
(4), 047008
(2010). http://dx.doi.org/10.1117/1.3463479 JBOPFO 1083-3668 Google Scholar
A. S. Hakaet al.,
“In vivo margin assessment during partial mastectomy breast surgery using Raman spectroscopy,”
Cancer Res., 66
(6), 3317
–3322
(2006). http://dx.doi.org/10.1158/0008-5472.CAN-05-2815 CNREA8 0008-5472 Google Scholar
A. Mahadevan-JansenR. Richarda-Kortum,
“Raman spectroscopy for cancer detection: a review,”
in Proc. 19 Int. Conf. IEEE/EMBS,
2722
–2728
(1997). Google Scholar
S. Duraipandianet al.,
“Real-time Raman spectroscopy for in vivo, online gastric cancer iagnosis during clinical endoscopic examination,”
J. Biomed. Opt., 17
(8), 081418
(2012). http://dx.doi.org/10.1117/1.JBO.17.8.081418 JBOPFO 1083-3668 Google Scholar
Y. Puet al.,
“Stokes shift spectroscopy highlights differences of cancerous and normal human tissues,”
Opt. Lett., 37
(16), 3360
–3362
(2012). http://dx.doi.org/10.1364/OL.37.003360 OPLEDP 0146-9592 Google Scholar
Y. Puet al.,
“Time-resolved spectral wing emission kinetics and optical imaging of human cancerous and normal prostate tissues,”
Opt. Commun., 282
(21), 4308
–4314
(2009). http://dx.doi.org/10.1016/j.optcom.2009.07.034 OPCOB8 0030-4018 Google Scholar
M. F. Kircheret al.,
“A brain tumor molecular imaging strategy using a new triple-modality MRI-photoacoustic-Raman nanoparticle,”
Nat. Med., 18
(5), 829
–834
(2012). http://dx.doi.org/10.1038/nm.2721 NAMEFI 1078-8956 Google Scholar
S. Koljenovićet al.,
“Detection of meningioma in dura mater by Raman spectroscopy,”
Anal. Chem., 77
(24), 7958
–7965
(2005). http://dx.doi.org/10.1021/ac0512599 ANCHAM 0003-2700 Google Scholar
H. Abramczyket al.,
“Raman ‘optical biopsy’ of human breast cancer,”
Progr. Biophys. Molec. Biol., 108
(1–2), 74
–81
(2012). http://dx.doi.org/10.1016/j.pbiomolbio.2011.10.004 PBIMAC 0079-6107 Google Scholar
C. Krafftet al.,
“Near infrared Raman spectra of human brain lipids,”
Spectrochim. Acta, 61
(7), 1529
–1535
(2005). http://dx.doi.org/10.1016/j.saa.2004.11.017 SPACA5 0038-6987 Google Scholar
A. Mizunoet al.,
“Near infrared Fourier transform Raman spectroscopic study of human brain tissues and tumours,”
Raman Spectrosc., 25
(1), 25
–29
(1994). http://dx.doi.org/10.1002/jrs.v25:1 JRSPAF 0377-0486 Google Scholar
S. Koljenovicet al.,
“Discriminating vital tumor from necrotic tissue in human glioblastoma tissue samples by Raman spectroscopy,”
Lab. Invest., 82
(10), 1265
–1277
(2002). LAINAW 0023-6837 Google Scholar
C. Krafftet al.,
“Near infrared Raman spectroscopic mapping of native brain tissue and intracranial tumors,”
Analyst, 130
(7), 1070
–1077
(2005). http://dx.doi.org/10.1039/b419232j ANLYAG 0365-4885 Google Scholar
K. Gajjaret al.,
“Diagnostic segregation of human brain tumours using Fourier-transform infrared and/or Raman spectroscopy coupled with discriminant analysis,”
Anal. Methods,
(2012). http://dx.doi.org/10.1039/C2AY25544H AMNEGX 1759-9679 Google Scholar
H. R. DongM. BlaivasM. Wang,
“Collagen isoform distribution patterns in cerebral vessels in CADASIL,”
in Proc. Int. Stroke Conf.,
A3685
(2012). Google Scholar
T. T. Nguyenet al.,
“Characterization of type I and IV collagens by Raman microspectroscopy: Identification of spectral markers of the dermo-epidermal junction,”
Spectrosc.: Int. J., 27 421
–427
(2012). Google Scholar
M. Köhleret al.,
“Characterization of lipid extracts from brain tissue and tumors using Raman spectroscopy and mass spectrometry,”
Anal. Bioanal. Chem., 393
(5), 1513
–1520
(2009). http://dx.doi.org/10.1007/s00216-008-2592-9 ABCNBP 1618-2642 Google Scholar
K. Ogawaet al.,
“Distribution of collagen type IV in brain tumors: an immunohistochemical study,”
J. Neurooncol., 7
(4), 357
–66
(1989). http://dx.doi.org/10.1007/BF02147093 JNODD2 0167-594X Google Scholar
S. Y. LinM. J. LiW. T. Cheng,
“FT-IR and Raman vibrational microspectroscopies used for spectral biodiagnosis of human tissues,”
Spectroscopy, 21
(1), 1
–30
(2007). http://dx.doi.org/10.1155/2007/278765 SPIJDZ 0712-4813 Google Scholar
D. B. De Stephanoet al.,
“Pituitary adenomas. An immune-histochemical study of hormone production and chromogranin localization,”
Am. J. Pathol., 116
(3), 464
–472
(1984). AJPAA4 0002-9440 Google Scholar
L. S. Leeet al.,
“Nondestructive analysis of the protein conformational structure of the human pituitary adenomas by using a reflectance FT-IR microspectroscopy,”
Cancer Lett., 94
(1), 65
–69
(1995). http://dx.doi.org/10.1016/0304-3835(95)03825-H CALEDQ 0304-3835 Google Scholar
C.-H. Liuet al.,
“Optical spectroscopic characteristics of lactate and mitochondrion as new biomarkers in cancer diagnosis understanding Warburg effect,”
Proc. SPIE, 8220 822
(2012). http://dx.doi.org/10.1117/12.909249 PSISDG 0277-786X Google Scholar
A. T. Tu, Raman Spectroscopy in Biology: Principles and Applications, 355 John Wiley & Sons, Inc., New York
(1982). Google Scholar
S. Duraipandianet al.,
“Simultaneous fingerprint and high-wavenumber confocal raman spectroscopy enhances early detection of cervical precancer in vivo,”
Anal. Chem., 84
(14), 5913
–5919
(2012). http://dx.doi.org/10.1021/ac300394f ANCHAM 0003-2700 Google Scholar
C.-H. Liuet al.,
“Monitoring changes of proteins and lipids in laser welded aorta tissue using biochemical component analyses,”
Proc. SPIE, 7175 717504
(2009). http://dx.doi.org/10.1117/12.809309 PSISDG 0277-786X Google Scholar
J. E. Pembertonet al.,
“Raman spectroscopy of octadecylsilane stationary phase conformational order effect of solvent,”
J. Chromatography A, 913
(1–3), 243
–252
(2001). http://dx.doi.org/10.1016/S0021-9673(01)00569-6 JCRAEY 0021-9673 Google Scholar
A. J. Shelnuttet al.,
“Protein influences on porphyrin structure in cytochrome c: evidence from Raman difference spectroscopy,”
Biochemistry, 20
(22), 6485
–6497
(1981). http://dx.doi.org/10.1021/bi00525a030 MIRBD9 0144-0578 Google Scholar
J. S. VincentI. W. Levin,
“Raman spectroscopic studies of dimyristoylphosphatidic acid and its interactions with ferricytochrome c in cationic binary and ternary lipid-protein complexes,”
Biophys. J., 59
(5), 1007
–1021
(1991). http://dx.doi.org/10.1016/S0006-3495(91)82316-5 BIOJAU 0006-3495 Google Scholar
C. CortesV. N. Vapnik,
“Support-vector networks,”
Mach. Learn., 20 273
–297
(1995). http://dx.doi.org/10.1023/A:1022627411411 MALEEZ 0885-6125 Google Scholar
An Introduction to Support Vector Machines—and other Kernel-Based Learning Methods, Cambridge University Press, Cambridge, UK
(2005). Google Scholar
|
|||||||||||||||||||||||||||||||||||||||||||||||||||||||||||||||||||||||||||||||||||||||||||||||||||||||||||||||||||||||||||||||||||||||||||


