
|
|
1.IntroductionA cholecystectomy (i.e., surgical removal of the gallbladder) is one of the most commonly performed abdominal surgical procedures in the United States. Bile duct injury during a cholecystectomy is an iatrogenic accident that has a substantial impact on perioperative morbidity, mortality, long-term survival, and quality of life.1–4 Bile duct injury occurs in one out of 200 to 400 cholecystectomy operations, making it one of the leading sources of medical malpractice claims against surgeons.5 Previous surveys show that 34% to 49% of surgeons are expected to cause such an injury during their career.6,7 Known risk factors for bile duct injury include aberrant anatomy, inflammatory changes, severity of the illness, excessive intraoperative bleeding, and other local procedures such as hepatobiliary surgeries.8 Since the primary cause for error in 97% of laparoscopic bile duct cases is visual misperception,9 clear delineation of the biliary anatomy is important. However, this can be difficult, and inadvertent injuries still occur, despite adequate training and experience. Various methods have been explored to avoid bile duct injury. One common method is intraoperative cholangiography (IOC).5,10,11 IOC is based on fluoroscopic imaging of the biliary tree after the regional infusion of radiographic contrast through a cholangiogram catheter placed in the cystic duct under direct vision. Although prospective clinical trials have demonstrated its usefulness,12 the clinical effectiveness of IOC in preventing bile duct injury during cholecystectomy has not been fully validated.5,13 Other hurdles that prevent the routine clinical use of IOC include the added cost, the equipment size, the radiation hazard, the risk of IOC-induced bile duct injury, and the adverse effect of the contrast agent. Recently, fluorescent cholangiography was explored for intraoperative imaging of biliary anatomy.14,15 The technique was based on systemic injection of indocyanine green (ICG) and fluorescence imaging of the leaked ICG to the bile. The process takes at least 25 min16 and is not suitable for imaging other internal structures such as the ureter.17 Besides, quantitative analysis of ICG-induced absorption and fluorescence emission is difficult, due to odd optical characteristics contributed by molecular aggregation and protein interaction.18 In aqueous solution, the absorption and the emission peaks of ICG change with the dye concentration, due to molecular aggregation. In other solutions, such as plasma and human serum albumin, the nonspecific binding of ICG with both lipophilic and hydrophilic molecular species makes its absorption and emission spectra significantly different from those of the aqueous solution. Furthermore, ICG degrades in the aqueous solution. The degradation rate, which we define as the rate at which fluorescence intensity declines in a given period, is accelerated by light exposure and elevated temperature.19 Finally, ICG has a short circulation half-life of around 2 to 4 min before it is taken up exclusively by hepatic parenchymal cells and secreted entirely into the bile.18 In summary, ICG in its original form is not appropriate for quantitative biomedical imaging applications. Encapsulating ICG in biodegradable micro- and nanoparticles may protect it from molecular interactions and enhance its fluorescence stability.20,21 Hyperspectral imaging and advanced imaging analysis methods such as co-registration and segmentation may be further integrated with fluorescence imaging to provide surgeons with complete information of the gross anatomy under surgery. This second modality serves to co-validate the image information obtained by the surgeon. Nearby tissue contaminated by contrast agent can be safely excluded from the operative region of interest using a hyperspectral image of tissue. Operative imaging of the other tubules such as ureters would also greatly benefit from such a system, as the softness and small size of the tissue would allow for diffusion of contrast media into surrounding tubules generating noise and operative uncertainty. The hyperspectral image would provide surgeons with background information on tissue type over which real-time imaging information from the contrast media can be overlaid. Considering that as many as 90% of bile duct injuries cannot be diagnosed during surgery11 and that the repair of these injuries adds significant cost and complexity,22 it is important to develop such low-cost and real-time imaging techniques for intraoperative identification of the biliary anatomy and for accurate assessment of bile duct injury. This paper reports the development of an ICG-loaded microballoon agent that can be injected in the gallbladder for intraoperative biliary imaging in cholecystectomy. ICG was loaded into a hollow poly[(D,L-lactide-co-glycolide)-co-PEG] diblock (PLGA-PEG) balloon by a modified double emulsion process. The particles are described using the term “microballoons” (also called “microbubbles” or “microcapsules”), because one of the constituent media encapsulates the other in a hollow core-shell structure.23 Spectroscopic measurements showed that the fluorescence characteristics and the degradation rate of ICG-loaded microballoons are superior to those of pure ICG. The clinical feasibility of using ICG-loaded microballoons for biliary imaging was demonstrated in both tissue-simulating phantoms and an ex vivo tissue model. Fluorescence and hyperspectral imaging tests in the ex vivo tissue model clearly demonstrated their surgical benefits. To the best of the authors’ knowledge, using ICG-loaded microballoons for dual-mode fluorescence and hyperspectral imaging of biliary anatomy has not been reported elsewhere. 2.Materials and Methods2.1.Fabrication of ICG-Loaded MicroballoonsICG was obtained from Sigma Aldrich (St. Louis, Missouri). Resomer® RGP d 50155 poly[(D,L-lactide-co-glycolide)-co-PEG] diblock (PLGA-PEG) was obtained from Envonik Industries (Piscataway, New Jersey). Ten percent Intralipid was obtained from Physician Sales & Services, Inc. (Leetsdale, Pennsylvania). Dichloromethane (), dimethyl sulfoxide (DMSO), lecithin, isopropanol, and polyvinyl alcohol (PVA) were obtained from Sigma Aldrich (St. Louis, Missouri). ICG was encapsulated in PLGA-PEG microballoons using a double emulsion process24 with modification. A 5-ml PLGA-PEG solution of (1.0% w/v), a 10-ml aqueous solution of PVA (0.6% w/v), a 0.5-ml aqueous solution of ICG (0.65 mM), and 1.0 ml of isopropanol were prepared in advance. The aqueous solution of ICG was added to the PLGA-PEG solution of and emulsified in an ice bath by a homogenizer (Omni International, Waterbury, Connecticut) at 20,000 rpm for 3 min. Then the first emulsion was added dropwise to the aqueous solution of PVA in an ice bath and emulsified for the second time at 500 rpm for 2 min. Isopropanol was added to the double emulsion and stirred for 1.5 h by a magnetic stirrer. After that, the mixture was centrifuged (5810R, Eppendorf, Hamburg, Germany) at 4000 rpm for 5 min. The supernatant was discarded, and the microballoon precipitate was freeze dried for 24 h. The freeze dried microballoons were washed with water and centrifuged at 4000 rpm for 5 min. The process was repeated three times until the free ICG was washed away. Then the washed microballoons were freeze dried once more for 24 h, harvested, and stored in a glass bottle at 0°C for further use. To prevent ICG photobleaching, the containers were covered by aluminum foils for the entire process. In comparison with our previous double emulsion process,25 this modified process increased the ICG encapsulation efficiency by a factor of two. The loading rate of ICG-loaded microballoons was characterized by a Cary 50 Bio UV-Vis spectrophotometer (Agilent Technologies, Santa Clara, California). The microballoons were dissolved in DMSO. The absorption spectrum was acquired and compared with the calibration standard in order to calculate the ICG concentration. The ICG loading rate was calculated by the formula 2.2.Fluorescence Characterization of ICG-Loaded MicroballoonsUnlike conventional fluorescence cholangiography where ICG was injected systemically and leaked into the bile, we propose a biliary imaging technique where aqueous suspension of ICG-loaded microballoons is directly injected in the gallbladder. Since ICG has a molecular structure with both hydrophilic and lipophilic characteristics, its fluorescence emission may vary with surrounding water and protein compositions significantly.18 We hypothesize that encapsulating ICG in PLGA-PEG microballoons will protect ICG from molecular interactions with bile juice, provide a stable fluorescence spectrum, and achieve a slower degradation rate for biliary imaging. In order to test this hypothesis, a bile-simulating liquid was prepared by dissolving lecithin in diethyl ether and then adding water to the concentration of . Aliquots of varying amounts of ICG-loaded microballoons were mixed with the liquid. The suspensions were illuminated by a 782-nm laser source, and the fluorescence spectra were measured by a USB4000 fluorescent spectrometer (Ocean Optics, Dunedin, Florida). As the control, pure ICG was dissolved in the bile-simulating liquid at various concentrations, and the fluorescence spectra were compared with those of ICG-loaded microballoons. We also hypothesize that ICG-loaded microballoons will retain higher fluorescence intensity over a surgically relevant time span in comparison with the ICG solution. In order to test this hypothesis, we prepared both an aqueous solution of ICG and an aqueous suspension of ICG-loaded microballoons. Care was taken to ensure the comparable fluorescence intensities among the samples. Both samples were stored in a dimly lit and room temperature environment, with their fluorescence spectra acquired periodically for up to 30 h. The degradation rates of ICG and ICG-loaded microballoons were calculated based on the exponential curve fitting of the peak fluorescence intensities. 2.3.Fluorescence Imaging in a Bile Duct Simulating PhantomThe technical feasibility of using ICG-loaded microballoons for contrast enhanced biliary fluorescence imaging was tested in a bile duct-simulating phantom. To design the phantom structure, we considered the biliary anatomy that simulates the correct and the incorrect surgical scenarios.26 To determine the phantom recipe, we considered the optical properties for typical biological tissues27 and the common materials for tissue-simulating phantoms.28 Since it is hard to obtain previously published data for biliary scattering and absorption characteristics, we used rough estimations based on literature and previous experiences. To prepare the phantom, a solution of agar-agar powder at 2.5% w/v was heated to 95°C and maintained above 50°C in order to prevent gelling. After the solution was cooled to below 60°C, Intralipid was added dropwise to attain a reduced scattering coefficient of , as measured at 690 nm by an Oxiplex tissue spectrophotometer (ISS Inc., Urbana Champaign, Illinois). We also fabricated three sets of the bile duct simulators and embedded them 7 mm deep in the agar gel phantom. The first set of the bile duct simulators included the cylinders of agar gel mixture with the following different absorbing contrast agents:
The second set was an assembly of agar gel cylinders simulating the surgical scenario where the cystic duct was correctly clamped. The third set was an assembly of agar gel cylinders simulating the incorrect surgical scenario where the common bile duct was accidently clamped. In addition to the above bile duct simulators, several agar gel slabs (each 3 mm thick) were cast to simulate the fat and ligament tissues surrounding the biliary structure. These slabs were fabricated by mixing Intralipid with agar gel in order to reach a reduced scattering coefficient of , as measured at 690 nm by an Oxiplex tissue spectrophotometer (ISS Inc., Urbana Champaign, Illinois). Fluorescent and visible light images of the bile duct-simulating phantom were acquired by a Da Vinci surgical robot imaging system (Intuitive Surgical, Inc, Sunnyvale, California) with and without the placement of the agar gel slabs on the top. 2.4.Dual-Mode Fluorescence and Hyperspectral Imaging of Biliary Structure in an Ex Vivo ModelThe dual-mode biliary imaging technique was demonstrated in an ex vivo porcine tissue model consisting of gallbladder, cystic duct, common hepatic duct, common bile duct, duodenum, and liver tissue. The tissue samples were freshly collected from euthanized domestic pigs at the OSU experimental animal surgical services. Hyperspectral images were acquired using an ORCA ER deep cooling NIR CCD camera (Hamamatsu, Bridgewater, New Jersey) and a Varispec SNIR liquid crystal tunable filter (Cambridge Research and Instrumentation Inc., Cambridge, Massachusetts), with the illumination of an OSL1 high-intensity halogen light source (Thorlabs, Newton, New Jersey). Fluorescence images of the biliary structure were acquired by the same charge coupled device (CCD) camera through a 808-nm EdgeBasic long pass filter (IDEX Corp., Lake Forest, Illinois) after regional injection of a 5-ml aqueous suspension of ICG-loaded microballoons () into the gallbladder. The tissue was illuminated by a 785-nm diode laser system (Laserglow Technologies, Toronto, Ontario). The hyperspectral and fluorescence images were analyzed and fused using the image segmentation algorithm described next. The technical feasibility of using ICG-loaded microballoons to identify potential bile duct injury was demonstrated in the same porcine tissue model. Surgical clips were attached at different locations of the biliary system to simulate different surgical scenarios. In one scenario, cystic duct was clamped to simulate the correct cholecystectomy procedure. In the other scenario, common bile duct was clamped to simulate the incorrect procedure that may result in potential bile duct injury. In both surgical scenarios, ICG-loaded microballoons were injected into gall bladder. Flow of bile juice through peristalsis was simulated ex vivo by the application of gentle compression on gall bladder. Fluorescence images were captured at an excitation wavelength of 785 nm and an emission wavelength of 808 nm. Potential bile duct injury was identified based on the flow pattern of the ICG-loaded microballoons after injection. 2.5.Hyperspectral and Fluorescence Image ProcessingA hyperspectral sensor collects a wide range of the spectral reflectance information at consecutive wavelengths ranging from visible to infrared bands. These additional spectral bands provide detailed information compared to a color image with only red-green-blue (RGB) bands. Typically, hyperspectral images are used in remote sensing to classify, for example, types of vegetation that otherwise look similar in the RGB space.29 Hyperspectral signatures have also been used to control food safety by utilizing the spectral properties of the chemicals.30 We have previously applied the hyperspectral imaging techniques for chronic wound assessment.31,32 In this paper, we used hyperspectral imaging to segment the bile duct region employing spectral properties and label the organs to assist the operator. In this experiment, the hyperspectral and the fluorescence images were acquired from the ex vivo porcine tissue model. Different tissue types were classified based on their characteristic reflectance spectra. The acquired hyperspectral data cubes consisted of 50 spectral bands sampled at a wavelength step of 2 nm from 650 to 750 nm. The bands recorded the spectral reflectance properties of liver, duodenum, gallbladder and ligament tissue. Our algorithm treated each pixel in the hyperspectral image as a 50-dimensional vector that encoded the spectral signature of the molecular structure within the tissues. Considering that a biliary system consists of a matrix of multiple tissue chromophores with characteristic absorption spectra, an unmixing process was used to separate the hyperspectral signature into a mixture of known molecule signatures.33 In addition to estimating the mixture molecules, the unmixing process also computed the portion of each molecule for each pixel. In hyperspectral image analysis, the portion was referred to as the abundance, and the pure molecules were called the end-members. Considering that we do not have the standard spectral signatures of the pure molecules, we manually chose the end-members from one of the acquired hyperspectral images. The manually selected end-members are marked as candidates and are chosen from liver, gallbladder, duodenum, and connection tissue and the background regions. The candidate end-members are sorted into matrices that correspond to each region. These matrices are then subjected to principal component analysis (PCA), which in return provided us with three end-members per region that had the highest eigenvalues. This process in total provided us with 15 end-members, which are conjectured to model the spectral signatures of the regions of interest. In our algorithm, we suggest that the signature of a pixel was composed of a linear combination of end-members, and abundance could not be negative. This resulted in a linear mixture model for a pixel, , such that where is the signature of the th end-member, is its abundance, is the number of known end-members in our library, and is the model noise. The pixel observations, pixels, when formed into an matrix , resulted in the mixture model where is the abundance matrix, and is an matrix of end-members. Given the pixel signatures and the library signatures of the end-members, the abundance matrix was estimated using nonnegative least square adjustment.Using the above unmixing equations, the unmixing procedure provides a novel -dimensional descriptor for each pixel in the form of mixing parameters, and it reduces the bias in the original spectrum by eliminating the redundancy in the hyperspectral observations. The reduced bias increases the efficiency of the image segmentation process, due to the use of better semantic descriptors for each pixel. We have also observed the importance of the unmixing process when performing the image segmentation using conventional segmentation algorithms. When directly applied to the original sensor observations with the -bands, conventional segmentation methods could not delineate the biliary anatomy. In our implementation, we chose the unmixed descriptors for K-means clustering. Using the end-member library extracted as mentioned before, we set the number of clusters, , to 10 to model biliary anatomy and the variations in the background for the collected images. The segmentation results with 10 regions were further re-clustered into four segments of duodenum, ligament tissue, liver, and gallbladder. The segmented images were later superimposed with fluorescence biliary imaging to visualize the biliary anatomy and the surrounding tissue components. Before generating the superimposition, we processed the fluorescence image to enhance the observation. The raw fluorescence image showed that the histogram of the image was concentrated on the dark part of the spectrum. In order to improve the appearance, we rescaled the histograms whose values encompass the full spectrum. The new image was then used as an alpha map to introduce transparent visualization for fluorescent regions. Fluorescence imaging of the biliary anatomy was also superimposed with the grayscale background image to facilitate real-time image guidance in cholecystectomy. 3.ResultsICG-loaded microballoons were fabricated by a modified double emulsification process using both PLGA-PEG and PLGA as shell materials. The mean diameter of these microballoons was 1.34 microns with a standard deviation of 0.94 microns, as measured by a dynamic light scattering (DLS) system. Figure 1 compares the morphology of these two types of microballoons. Unlike conventional PLGA microballoons, which are shown in Fig. 1(b), PLGA-PEG microballoons, which are shown in Fig. 1(a), show a completely innovative surface structure. The formation of such a unique surface feature may be associated with the interaction of the hydrophilic PEG segments and the hydrophobic PLGA segments in aqueous phase during the emulsification process.34 Fig. 1SEM images of ICG-loaded microballoons with the following shell materials: (a) PLGA-PEG diblock, and (b) PLGA. ICG was encapsulated in both microballoons by a modified double emulsion process. The surface of PLGA-PEG microballoons shows a unique mushroom-like nanostructure, possibly owing to the interaction of the hydrophilic PEG segments and the hydrophobic PLGA segments in aqueous phase during the emulsification process.  Figure 2 plots the ICG loading rates for different ICG amounts used in the emulsification process. According to the figure, the ICG loading rate is proportional to the initial amount of ICG used in the process. Compared with the previous report,35 our loading rate is four times higher and can be further increased by optimizing the encapsulation process. The increased loading rate is possibly caused by switching the orders of washing and freeze drying in the double emulsification process and by forming the mushroom-like nanostructure on the surface of the microballoons for improved attachment of ICG. Fig. 2The loading rate of the ICG-loaded microballoons is linearly correlated with the initial ICG quantity in the modified double emulsion process. The loading rate is four times higher than that of our previous report (See Ref. 35) and can be further increased by optimizing the encapsulation process. The increased loading rate is possibly caused by the improvement of the encapsulation process and the formation of the nanostructures on the microballoon surface. 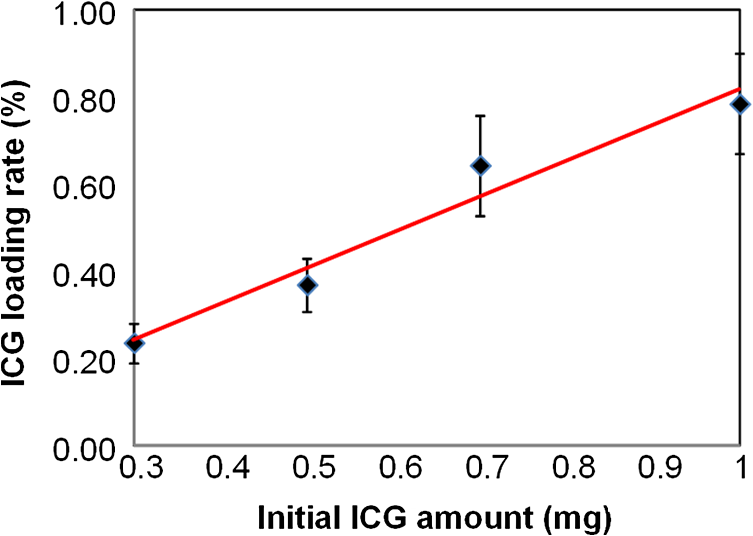 Figure 3 compares the fluorescence emission spectra of ICG-loaded microballoons versus ICG in the bile-simulating liquid at different concentrations. The initial concentrations were adjusted in order to achieve similar fluorescence intensities for the two ICG formulations. According to Fig. 3(a), the suspension of ICG-loaded microballoons shows a consistent fluorescence peak at 825 nm, independent of the changes in concentration. In comparison, the fluorescence peak of the ICG solution is shifted by 16 nm at different concentrations. Such a wavelength shift does not show a predictable pattern. It may be caused by the aggregation of ICG and the molecular interaction with lecithin. An interesting observation was that the effect of peak shift seemed directly related to the magnitude of change in concentration. The lowest peak displays the greatest shift from the highest peak compared to the intermediate peak. This can be reasoned as, at high concentrations, ICG will tend to dimerize, reducing its interaction with proteins.36 Studies also indicate that a combination of the effects of ICG binding to protein and ICG aggregation is largely responsible for the spectral change in emission.18 During operative use, both these effects compete against each other, impacting the ICG characteristics. However, ICG encapsulated within microballoons is restricted from protein binding and aggregation. These microballoons maintain their spectral characteristics and demonstrate almost no ability to shift their peak with changing concentration. These results open up the possibility of drawing quantitative correlations between ICG fluorescence and physiological properties, independent of the nuances and instability of the fluorophore’s chemistry. Fig. 3Fluorescence spectra of ICG loaded microballoons (a) and pure ICG (b) in a lecithin matrix at different concentrations. Initial samples (red lines) were measured to produce equivalent fluorescence intensities. Clear peak shift is observed with the varying dilutions (blue and green lines) in the case of pure ICG, despite similar starting fluorescence intensity. In comparison, the emission peak of ICG-loaded microballoons is constant at 825 nm.  The effect of time on the extinction of fluorescence intensity was tested at the physiologic temperature and pH levels for aqueous solutions of ICG and ICG-MBs, respectively. The test was triplicated, and the averaged fluorescence intensities were recorded from 0 to 30 h, as shown in Fig. 4. To ensure the comparability of the results, the extinction was measured relative to the starting fluorescence intensities of the two samples, starting at a maximum of 1.0 at 0 h to a minimum of 0.0 at 30 h. The data were fitted into the exponential extinction model with the half-life defined as , where is the initial fluorescence intensity, is the fluorescence intensity at time , and is an attenuation constant.Fig. 4Fluorescence intensity histories of the aqueous solution of pure ICG (red) and the aqueous suspension of ICG-loaded microballoons (green) in a dimly lit, physiological environment. The averaged fluorescence intensities measured at different time points were fitted into an exponential extinction model. ICG-loaded microballoons retain significantly higher fluorescence in surgically relevant time spans, with nearly double the intensity of pure ICG between 4 and 7 h. Based on the fitted model, the half-life for the aqueous solution of ICG is 1.47 h, whereas the half-life for the aqueous suspension of ICG-loaded microballoons is 2.321 h.  According to Fig. 4, the half-life for the aqueous solution of ICG is 1.47 h, whereas the half-life for the aqueous suspension of ICG-loaded microballoons is 2.321 h. This indicates a nearly 58% increase in half-life by encapsulating ICG inside microballoons. Furthermore, according to Fig. 4, the fluorescence intensity of ICG-loaded microballoons remains significantly higher than that of ICG solution—as much as double during most of the surgically crucial times. Without encapsulation, pure ICG suffers from the unhindered effects of quenching, photo bleaching, and aggregation over time. However, ICG-loaded microballoons have relative amounts of protection from the surrounding matrix and external optically degrading factors, as evidenced by the elongated half-life time in Fig. 4. Figure 5 illustrates multiple bile duct simulators embedded in an agar gel phantom. In Fig. 5(a), bile duct simulators dispersed with different types of contrast agents are aligned. Figure 5(b) and 5(c) simulates the correct surgical scenario where the cystic duct is clamped and the incorrect the incorrect surgical scenario where the common bile duct is accidentally clamped, respectively. Fig. 5Multiple bile duct simulators are embedded in an agar gel phantom. (a) Bile duct simulators are made of agar gel cylinders dispersed with three different contrast agents. “Dye”: the Dylon dark green fabric dye. “ICG”: the ICG solution. “ICG-MBs”: the mixture of ICG and microballoons. (b) Embedded agar gel cylinders simulating the correct surgical scenario. “CBD”: common bile duct. “CHD”: common hepatic duct. “CD”: cystic duct. “CT”: carlot’s triangle. (c) Embedded agar gel cylinders simulating the incorrect surgical scenario where the common bile duct is accidently clamped.  Fluorescence images of the above bile duct-simulating phantom were acquired by a Firefly™ fluorescence imaging module in a Da Vinci surgical robot system. Figure 6 shows the screen snapshots of the fluorescence imaging module. The snapshots represent the image fusion of the fluorescence emission (green color, illuminated by an excitation light) and the background reflectance (grayscale, illuminated by a broadband light). The diminishing fluorescence intensity from Fig. 6(a) to 6(c) is a result of adding multiple agar gel slabs on top of the phantom. According to the left image in Fig. 6(a), both the bile duct simulators dispersed with ICG-loaded microballoons, denoted as “ICG-MB” in Fig. 5(a) and the simulators filled with ICG, denoted as “ICG” in Fig. 5(a), show fluorescence emission. However, their fluorescence patterns are significantly different. For the “ICG-MB” simulators, fluorescence emission is observed within the embedment. For the “ICG” simulators, fluorescence emission is observed outside the boundary, leaving a region of no fluorescence within the embedment. We believe that such a big difference in the fluorescence pattern is associated with the scattering of fluorescence photons in the phantom. Since the bile duct simulators do not contain Intralipid, their scattering coefficients are much lower than that of the surrounding phantom material. For the “ICG” simulators, the fluorescence photons will not be scattered until they reach the highly scattered boundary, resulting in a pattern of fluorescence emission outside the embedment. In contrast, the fluorescence photons emitted in the “ICG-MB” simulators will be directly scattered by individual microballoons, resulting in a pattern of uniformly distributed fluorescence within the embedment. This phenomenon implies that ICG-MBs can replace ICG for fluorescence imaging of low scattering tumors, such as a cyst. Fig. 6A screen snapshot of the fluorescence images of the bile duct-simulating phantom acquired by a Firefly fluorescence imaging module in a Da Vinci surgical robot under the following test conditions: (a) bile duct simulators are embedded 7 mm deep inside an agar gel phantom; (b) a 3-mm-thick agar gel slab is placed on top of the phantom; (c) two 3-mm-thick agar gel slabs are placed on top of the phantom. Note that the scattering coefficient of the agar gel slabs is greater than that of the bile duct-simulating phantom to mimic fat and ligament tissues surrounding the bile ducts.  The middle and right images in Fig. 6(a) demonstrate that the simulated correct and incorrect surgical scenarios can be clearly identified by fluorescence imaging. Figure 6(b) shows that the simulated biliary structure can be identified by fluorescence imaging even when an agar gel slab is placed on the top of the phantom, simulating a tissue depth of 3 to 10 mm. As the second piece of agar gel slab is placed on the top of the phantom, the biliary structure is hard to identify by fluorescence imaging. Figure 7 shows the photographic and segmented images of the ex vivo biliary tissue after the hyperspectral and fluorescence imaging sessions. Hyperspectral image analysis was performed using a modified spectrum parsing and image reconstruction algorithm. As can be seen, different tissue types exhibited different spectral characteristics, due to tissue properties. Therefore, a segmentation of the whole porcine sample being imaged was possible based on tissue characteristics. The color-coded segments allow clear distinction between ligament tissue, gallbladder, liver, and duodenum. This segmented image is overlaid with a fluorescence image from the microballoon flow in the same tissue to add the real-time fluorescence flow of ICG-loaded microballoons on top of the background. Fig. 7(a) Photographic image of the biliary tissue structure. (b) Classification of the biliary tissue types based on hyperspectral imaging, superimposed with the fluorescence image of the ICG-loaded microballoons. The dual-mode image clearly identifies the biliary anatomy and its relative location with respect to the surrounding tissue components.  Figure 8 shows the fluorescence images of two surgical scenarios after regional injection of the ICG-loaded microballoons. The flow of bile juice results in characteristic distributions of microballoons based on the position of the surgical clamp. Figure 8(a) highlights the correct surgical scenario, where the cystic duct is clamped. Figure 8(b) shows a “Y” shaped fluorescence pattern, indicating the accidental occlusion of the common bile duct and the retrospect flow of ICG-loaded microballoons to the common hepatic duct. Fig. 8Ex vivo fluorescence images simulating the detection of different surgical scenarios: (a) the correct scenario, where the cystic duct is clamped; (b) an incorrrect scenario where the common bile duct is accidently clamped. GB: gall bladder. CBD: common bile duct. CHD: common hepatic duct. CD: cystic duct. Arrows indicate the clamping locations. 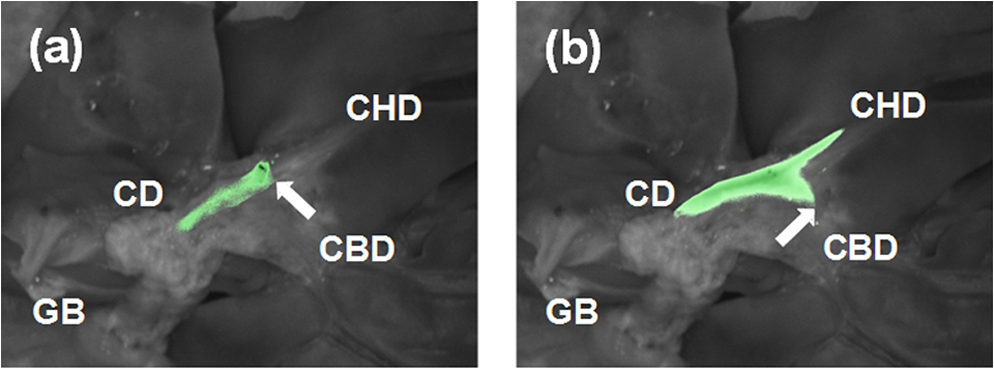 4.Discussions and ConclusionA dual-mode imaging technique has been developed for intraoperative bile duct imaging and bile duct injury identification in cholecystectomy. ICG was encapsulated into microballoons using a modified double emulsion technique. Compared to the emulsion-based encapsulation systems,21,35 we demonstrated a fourfold increase in the loading rate. Compared to lipid microbubbles, PLGA microballoons provide a solid and stable core-shell structure that is capable of loading multiple drugs and imaging agents.37 The microballoon agent is especially useful for image-guided cholecystectomy application, because it will be eventually discharged to the gastrointestinal tract, leaving no significant side effect to the patient. Of course, microballoons fabricated by emulsification processes have broad size distribution that limits their imaging applications. Other processes, such as co-axial electrospray, have been explored for the improved loading rate and particle size distribution.38 Once the inhomogeneity of the particle size is brought down, fluorescent microballoons might provide quantitative information, as well as qualitative information, in fluorescence imaging. The dual-mode imaging technique consists of successive steps of clamping the presumed cystic duct, injecting ICG-loaded microballoons into the gallbladder, and fluorescence and hyperspectral imaging to confirm the surgeon’s identification. Compared with IOC, this dual-mode imaging technique has the advantage of being a low-cost, real-time technique without any radiation hazard. It does not require a previous intravenous injection, as in fluoroscopy, and it has the potential to be used in other regions, such as the ureter. Compared with ultrasonography, this imaging technique combines the molecular sensitivity of fluorescence imaging and the tissue classification capability of hyperspectral imaging. Compared with pure ICG injections, this method allows for fluorescence imaging with consistent emission wavelength and up to 2 to 3 h’ working time after administration. ICG-loaded microballoons will also enable simultaneous ultrasound, photoacoustic, and fluorescence imaging.39,40 The dual-mode bile duct imaging technique has been demonstrated in both an agar gel phantom and an ex vivo porcine tissue model. Bolus injection of microballoons encapsulating highly absorbing contrast agents will also facilitate bile duct imaging using other modalities, such as ultrasonography25 and photoacoustic tomography.40 Hyperspectral imaging can facilitate situational awareness of the real-time information from the contrast media with respect to the surrounding anatomy. It will undercut errors from contrast agent contamination and provide clarification on the tissue type being fluoresced, which will be vital information in cases of robotic surgery. In addition to cholecystectomy, the dual-mode imaging technique can provide intraoperative guidance in many other surgical procedures, such as urinary tract imaging to reduce the incidence of ureteral injuries in gynecologic and colorectal surgeries as mentioned above. In conclusion, the hyperspectral and fluorescence dual-mode imaging technique has the capability to identify potential bile duct injury in cholecystectomy. Future research will include in vivo animal studies, investigation into a microballoon or microballoon technique that combines the strength of both our current techniques, and expansion into imaging for other surgical procedures, including those involving the ureters and the circulatory system, as the microballoons show potential in preventing ICG from interacting with blood albumins. AcknowledgmentsThis work was supported by the Center for Minimally Invasive Surgery (CMIS) at The Ohio State University (OSU), the National Center for Research Resources (Grant No: UL1RR025755), the National Institute of Standards and Technology (Grant No: 60NANB10D184), and the National Cancer Institute (Grant No: CA15977). The authors are grateful to Valerie Bergdall, Lori Mattox, and staff members at OSU University Laboratory Animal Resources (ULAR) for their assistance in ex vivo validation tests. The authors are also grateful to Dr. Mark Wendling, James Vargo, Lisa Yeater, and Rebecca Dettorre at CMIS for their helpful insights and experimental supports. ReferencesS. J. Savaderet al.,
“Laparoscopic cholecystectomy-related bile duct injuries: a health and financial disaster,”
Ann. Surg., 225
(3), 268
–273
(1997). http://dx.doi.org/10.1097/00000658-199703000-00005 ANSUA5 0003-4932 Google Scholar
D. R. Flumet al.,
“Bile duct injury during cholecystectomy and survival in medicare beneficiaries,”
JAMA, 290
(16), 2168
–2173
(2003). http://dx.doi.org/10.1001/jama.290.16.2168 JAMAAP 0098-7484 Google Scholar
D. Boermaet al.,
“Impaired quality of life 5 years after bile duct injury during laparoscopic cholecystectomy: a prospective analysis,”
Ann. Surg., 234
(6), 750
–757
(2001). http://dx.doi.org/10.1097/00000658-200112000-00006 ANSUA5 0003-4932 Google Scholar
G. B. Meltonet al.,
“Major bile duct injuries associated with laparoscopic cholecystectomy: effect of surgical repair on quality of life,”
Ann. Surg., 235
(6), 888
–895
(2002). http://dx.doi.org/10.1097/00000658-200206000-00018 ANSUA5 0003-4932 Google Scholar
N. N. MassarwehD. R. Flum,
“Role of intraoperative cholangiography in avoiding bile duct injury,”
J. Am. Coll. Surg., 204
(4), 656
–664
(2007). http://dx.doi.org/10.1016/j.jamcollsurg.2007.01.038 JACSEX 1072-7515 Google Scholar
S. B. Archeret al.,
“Bile duct injury during laparoscopic cholecystectomy: results of a national survey,”
Ann. Surg., 234
(4), 549
–558
(2001). http://dx.doi.org/10.1097/00000658-200110000-00014 ANSUA5 0003-4932 Google Scholar
J. R. Francoeuret al.,
“Surgeons’ anonymous response after bile duct injury during cholecystectomy,”
Am. J. Surg., 185
(5), 468
–475
(2003). http://dx.doi.org/10.1016/S0002-9610(03)00056-4 AJOOA7 0096-6347 Google Scholar
J. F. Gigot,
“Bile duct injury during laparoscopic cholecystectomy: risk factors, mechanisms, type, severity and immediate detection,”
Acta. Chir. Belg., 103
(2), 154
–160
(2003). ACBEAX 0001-5458 Google Scholar
L. W. Wayet al.,
“Causes and prevention of laparoscopic bile duct injuries: analysis of 252 cases from a human factors and cognitive psychology perspective,”
Ann. Surg., 237
(4), 460
–469
(2003). http://dx.doi.org/10.1097/01.SLA.0000060680.92690.E9 ANSUA5 0003-4932 Google Scholar
M. Birthet al.,
“Recognition of laparoscopic bile duct injuries by intraoperative ultrasonography,”
Surg. Endosc., 10
(8), 794
–797
(1996). http://dx.doi.org/10.1007/BF00189535 SUREEX 1432-2218 Google Scholar
M. A. Wahabet al.,
“Postcholecystectomy bile duct injuries: experience with 49 cases managed by different therapeutic modalities,”
Hepatogastroenterology, 43
(11), 1141
–1147
(1996). Google Scholar
M. Hauer-Jensenet al.,
“Prospective randomized study of routine intraoperative cholangiography during open cholecystectomy: long-term follow-up and multivariate analysis of predictors of choledocholithiasis,”
Surgery, 113
(3), 318
–323
(1993). SURGAZ 0039-6060 Google Scholar
L. T. Ladocsiet al.,
“Intraoperative cholangiography in laparoscopic cholecystectomy: a review of 734 consecutive cases,”
Am. Surg., 63
(2), 150
–156
(1997). AJOOA7 0096-6347 Google Scholar
T. Ishizawaet al.,
“Application of fluorescent cholangiography to single-incision laparoscopic cholecystectomy,”
Surg Endosc.,
(2011). SUREEX 1432-2218 Google Scholar
T. Aokiet al.,
“Intraoperative fluorescent imaging using indocyanine green for liver mapping and cholangiography,”
J. Hepatobiliary Pancreat. Sci., 17
(5), 590
–594
(2010). Google Scholar
J. L. Figueiredoet al.,
“Intraoperative near-infrared fluorescent cholangiography (NIRFC) in mouse models of bile duct injury,”
World J. Surg., 34
(2), 336
–343
(2010). http://dx.doi.org/10.1007/s00268-009-0332-8 WJSUDI 0364-2313 Google Scholar
A. Matsuiet al.,
“Real-time, near-infrared, fluorescence-guided identification of the ureters using methylene blue,”
Surgery, 148
(1), 78
–86
(2010). http://dx.doi.org/10.1016/j.surg.2009.12.003 SURGAZ 0039-6060 Google Scholar
T. DesmettreJ. M. DevoisselleS. Mordon,
“Fluorescence properties and metabolic features of indocyanine green (ICG) as related to angiography,”
Surv. Ophthalmol., 45
(1), 15
–27
(2000). http://dx.doi.org/10.1016/S0039-6257(00)00123-5 SUOPAD 0039-6257 Google Scholar
V. SaxenaM. SadoqiJ. Shao,
“Polymeric nanoparticulate delivery system for Indocyanine green: biodistribution in healthy mice,”
Int. J. Pharm., 308
(1–2), 200
–204
(2006). http://dx.doi.org/10.1016/j.ijpharm.2005.11.003 IJPHDE 0378-5173 Google Scholar
V. SaxenaM. SadoqiJ. Shao,
“Enhanced photo-stability, thermal-stability and aqueous-stability of indocyanine green in polymeric nanoparticulate systems,”
J. Photochem. Photobiol. B, 74
(1), 29
–38
(2004). http://dx.doi.org/10.1016/j.jphotobiol.2004.01.002 JPPBEG 1011-1344 Google Scholar
R. Xuet al.,
“Fabrication of indocyanine green encapsulated biodegradable microbubbles for structural and functional imaging of cancer,”
J. Biomed. Opt., 14
(3), 034020
(2009). http://dx.doi.org/10.1117/1.3147424 JBOPFO 1083-3668 Google Scholar
K. A. Kern,
“Malpractice litigation involving laparoscopic cholecystectomy. Cost, cause, and consequences,”
Arch. Surg., 132
(4), 392
–397
(1997). http://dx.doi.org/10.1001/archsurg.1997.01430280066009 ARSUAX 0004-0010 Google Scholar
R. X. Xu,
“Multifunctional microbubbles and nanobubbles for photoacoustic imaging,”
Contrast Media Mol. Imaging, 6
(5), 401
–411
(2011). http://dx.doi.org/10.1002/cmmi.442 CMMICO 1555-4309 Google Scholar
C. E. AsteteC. M. Sabliov,
“Synthesis and characterization of PLGA nanoparticles,”
J. Biomater. Sci. Polym. Ed., 17
(3), 247
–289
(2006). http://dx.doi.org/10.1163/156856206775997322 JBSEEA 0920-5063 Google Scholar
R. X. Xuet al.,
“Fabrication of indocyanine green encapsulated biodegradable microbubbles for structural and functional imaging of cancer,”
J. Biomed. Opt., 14
(3), 034020
(2009). http://dx.doi.org/10.1117/1.3147424 JBOPFO 1083-3668 Google Scholar
S. ConnorO. J. Garden,
“Bile duct injury in the era of laparoscopic cholecystectomy,”
Br. J. Surg., 93
(2), 158
–168
(2006). http://dx.doi.org/10.1002/(ISSN)1365-2168 BJSUAM 0007-1323 Google Scholar
W. F. CheongS. A. PrahlA. J. Welch,
“A review of the optical properties of biological tissues,”
IEEE J. Quantum Electron., 26 2166
–2185
(1990). http://dx.doi.org/10.1109/3.64354 IEJQA7 0018-9197 Google Scholar
B. W. PogueM. S. Patterson,
“Review of tissue simulating phantoms for optical spectroscopy, imaging and dosimetry,”
J. Biomed. Opt., 11
(4), 041102
(2006). http://dx.doi.org/10.1117/1.2335429 JBOPFO 1083-3668 Google Scholar
J. R. Jensen, Remote Sensing of the Environment: An Earth Resource Perspective, 2nd ed.Prentice Hall, Upper Saddle River, NJ
(2006). Google Scholar
M. S. KimY. R. ChenP. M. Mehl,
“Hyperspectral reflectance and fluorescence imaging system for food quality,”
Trans. ASAE, 44 721
–729
(2001). TAAEAJ 0001-2351 Google Scholar
R. X. Xuet al.,
“Developing digital tissue phantoms for hyperspectral imaging of ischemic wounds,”
Biomed. Opt. Express, 3
(6), 1434
–1445
(2012). http://dx.doi.org/10.1364/BOE.3.001433 Google Scholar
R. X. Xuet al.,
“Dual-mode imaging of cutaneous tissue oxygenation and vascular thermal reactivity,”
J. Visual. Exp.,
(2010). http://dx.doi.org/10.3791/2095 Google Scholar
N. Keshava,
“A survey of spectral unmixing algorithms,”
Lincoln Lab. J., 14
(1), 55
–78
(2003). LLJOEJ 0896-4130 Google Scholar
H. K. MakadiaS. J. Siegel,
“Poly lactic-co-glycolic acid (PLGA) as biodegradable controlled drug delivery carrier,”
Polymers (Basel), 3
(3), 1377
–1397
(2011). http://dx.doi.org/10.3390/polym3031377 Google Scholar
V. SaxenaM. SadoqiJ. Shao,
“Indocyanine green-loaded biodegradable nanoparticles: preparation, physicochemical characterization and in vitro release,”
Int. J. Pharm., 278
(2), 293
–301
(2004). http://dx.doi.org/10.1016/j.ijpharm.2004.03.032 IJPHDE 0378-5173 Google Scholar
L. Guerriniet al.,
“Monomer adsorption of indocyanine green to gold nanoparticles,”
Nanoscale, 3
(10), 4247
–4253
(2011). http://dx.doi.org/10.1039/c1nr10551e 1556-276X Google Scholar
J. R. Lindner,
“Microbubbles in medical imaging: current applications and future directions,”
Nat. Rev. Drug Discov., 3
(6), 527
–532
(2004). http://dx.doi.org/10.1038/nrd1417 NRDDAG 1474-1776 Google Scholar
L. Zhanget al.,
“Co-axial electrospray of microparticles and nanoparticles for biomedical applications,”
Exp. Rev. Med.l Dev.,
(2012). 1743-4440 Google Scholar
J. S. Xuet al.,
“Synthesizing and binding dual-mode poly (lactic-co-glycolic acid) (PLGA) nanobubbles for cancer targeting and imaging,”
Biomaterials, 31
(7), 1716
–1722
(2010). http://dx.doi.org/10.1016/j.biomaterials.2009.11.052 BIMADU 0142-9612 Google Scholar
C. Kimet al.,
“Ultrasound and photoacoustic dual-modal imaging of thick biological tissue with microbubble enhancement,”
J. Biomed. Opt., 15
(1), 010510
(2010). http://dx.doi.org/10.1117/1.3302808 JBOPFO 1083-3668 Google Scholar
|


