|
|
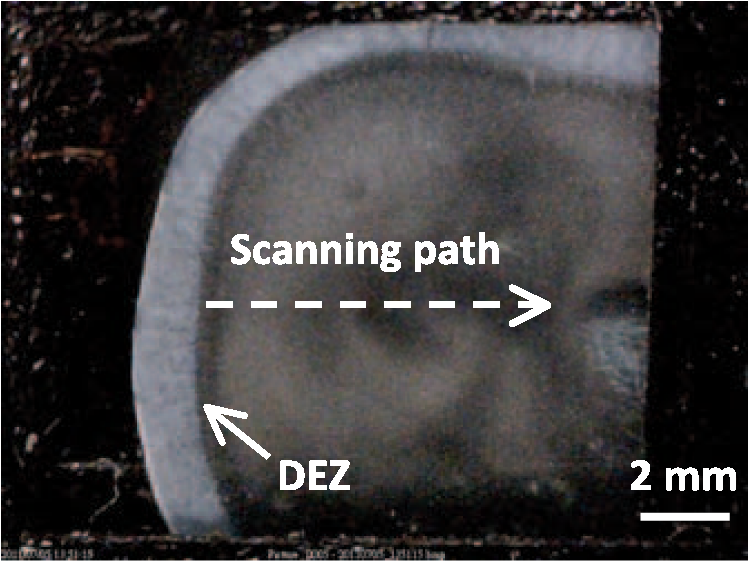
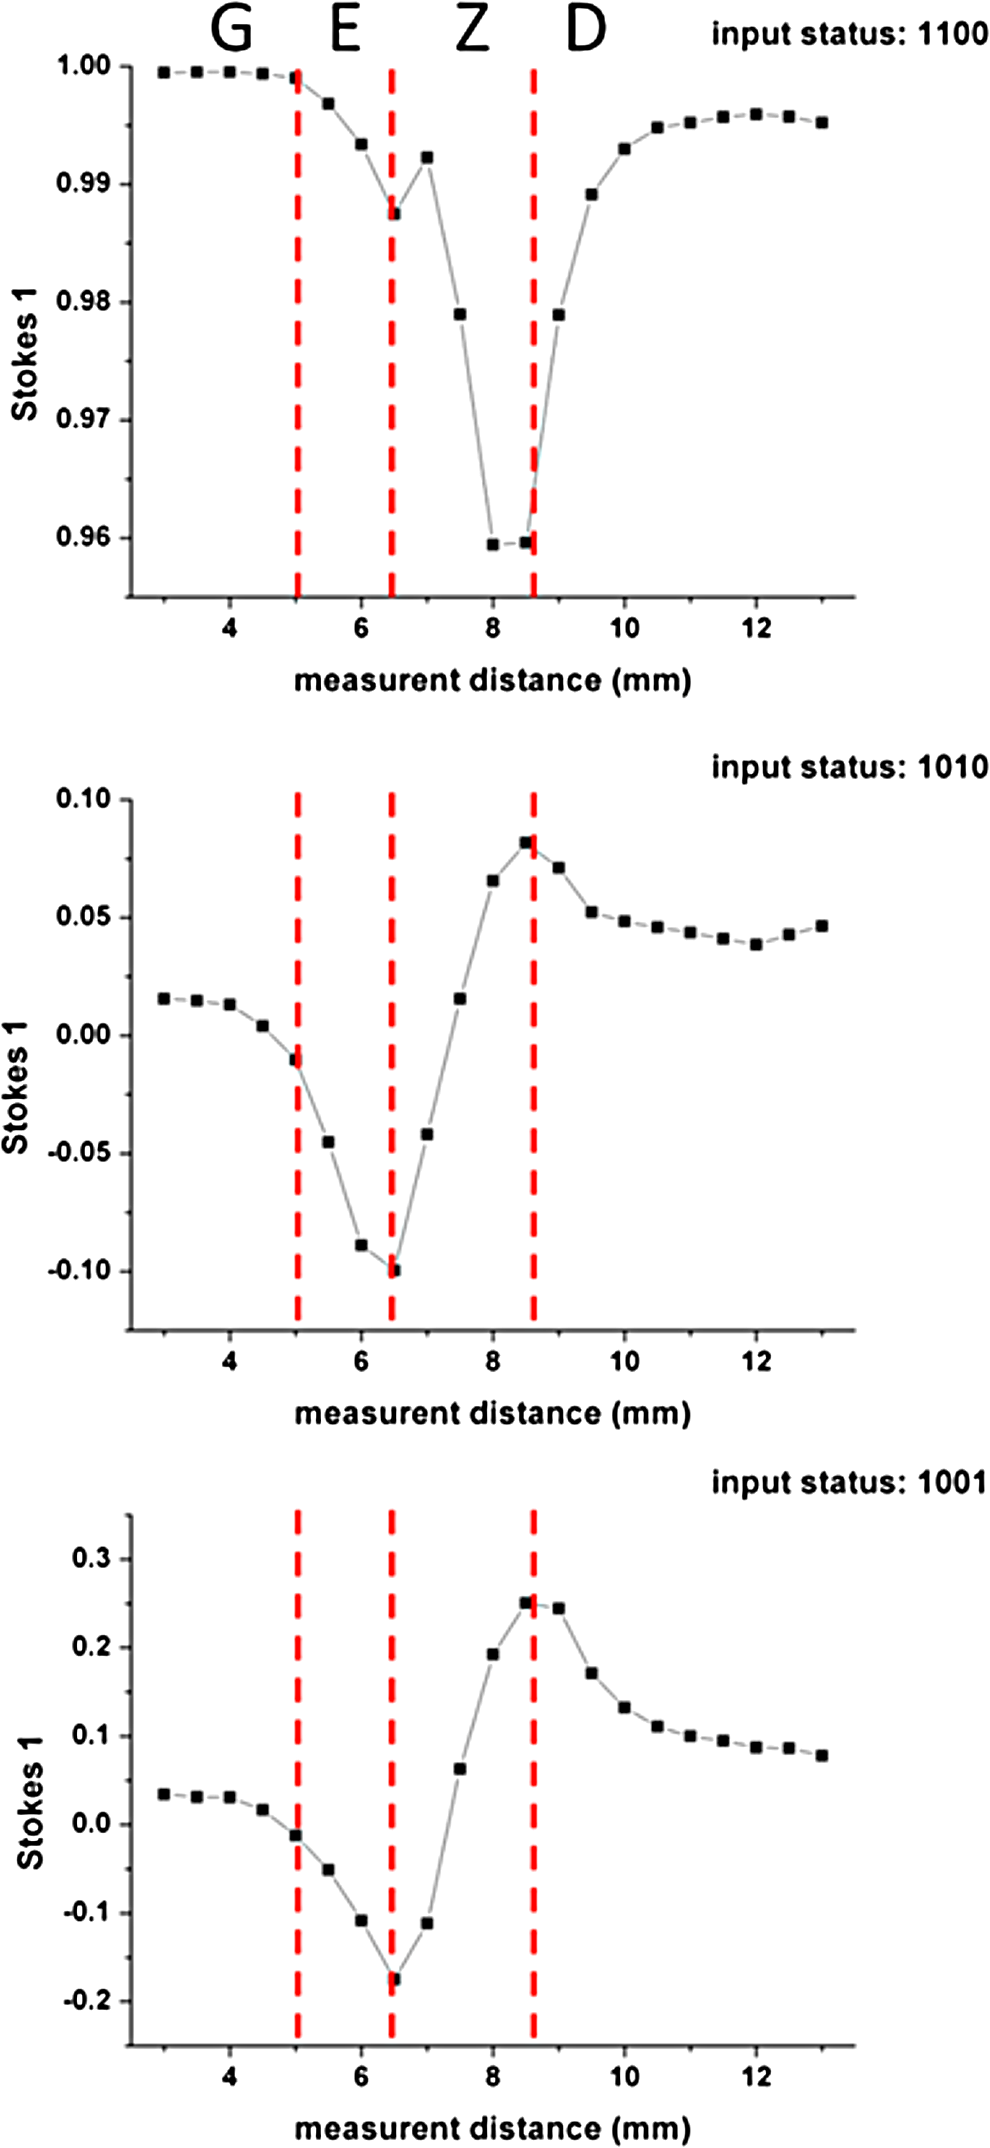
1.IntroductionThe dentin-enamel junction (DEJ) is an interface that joins two distinct calcified tissues, enamel and dentin.1 Biomechanically, enamel is hard and brittle, and is located at the outer portion of a tooth. Enamel is composed of defective carbonate-rich apatite crystals that are arranged in enamel rods (4 to 5 μm in diameter) or prisms that lie nearly perpendicular to the DEJ. Dentin is tougher and similar in many respects to bone. Dentin consists of dentinal tubules (approximately 1 μm in diameter) containing odontoblastic processes. The recently introduced description, “dentin-enamel zone” (DEZ), provides a more appropriate description than the DEJ, because it describes the unique architecture between the dentin and enamel. Lin et al.2 reported that the functional width of the DEZ is approximately 50 to 100 μm. From the point of view of the composite structure, the interpenetrating structure at the DEZ is expected to provide mechanical coupling that reduces multi-axial interfacial stress. Therefore, a load transfers through the hard enamel, toward the DEZ into the tough dentin; this results in the relief of stress. The width and micromechanical properties of the DEZ are associated with the relief of stress and the ability to prevent the propagation of cracks.2,3 In addition, the DEZ has been associated with oral problems such as dentin hypersensitivity.4 Dentin hypersensitivity is one of the most common clinical problems that causes patient distress.5 Individuals with dentin hypersensitivity feel pain that is triggered by hot, cold, sour, or sweet food or beverages, forceful brushing or flossing, or even by cold air.4 One possible cause of dentin hypersensitivity is the exposure of dentin, i.e., the dentinal tubules, in the DEZ.4,6 Although dentin hypersensitivity has not been associated with inflammation or an infection, it is an important problem that affects many people. Therefore, the structure of the DEZ is important to understand. The clinical diagnosis in oral medicine requires dentists to take a history, as well as percussion, periodontal probing, and checking for occlusion; radiographs are used to confirm the diagnosis. However, there has been no tool available that could be used to quantitatively assess the structure of the DEZ. Previous studies reported the mechanical properties of the DEZ using atomic force microscopy (AFM), synchrotron micro-computed tomography (SRCT), and scanning electron microscopy (SEM).7–10 These techniques are difficult to apply clinically because of physical limitations. An optical assessment is noninvasive, nondestructive, and nonradioactive that could provide a good assessment for scanning/imaging. The DEZ has a distinct orientation different from enamel and dentin;11–13 therefore, the optical birefringence could be analyzed with a polarization discrimination method. The purpose of this study was to characterize the DEZ in vitro using Stokes–Mueller measurements. A cross-sectional slice of a tooth was optically measured using Stokes–Mueller polarimetry. By measuring the Stokes elements and Mueller matrices, the one-dimensional Stokes vector distribution that indicates the DEZ characteristics anisotropically, and the equivalent retardance of each tooth layer, can be obtained. The results of this study show that a dentin-enamel zone exists with its own birefringent properties. 2.Materials and Methods2.1.ExperimentsThe optical polarimetry system was constructed with a polarization analyzer (Thorlabs PAX 5710IR1). A near-infrared laser diode (LD), 780 nm, was employed as a light source. The Stokes parameters were determined by utilizing a polarization state analyzer (PSA) PAX 5710IR1. Figure 1 shows the experimental setup for the optical polarization measurements. The polarization state of the incident light was controlled by half- and quarter-waveplates (WPs). The measurement data were collected and analyzed using computer software (Thorlabs TXP5000). The tooth sample and light source were put on moving stages for optical scanning and calibration. For one-dimensional optical scanning, the stage was moved at 0.5 mm per step from the left of the sample, and the Stokes components were measured as Stokes 0, Stokes 1, Stokes 2, and Stokes 3. The scanning path was 15 mm as shown in Fig. 2. All the Stokes parameters were spatially plotted as the experimental results. The institutional review board (IRB) at National Yang-Ming University (IRB no. 100104) approved this research. 2.2.System CalibrationBefore optical measurement of the tooth sample, the quarter- and half-WPs were experimentally calibrated and the Stokes elements were recorded after rotating the waveplates 10 deg. The optical attenuation from the WPs was . The error with regard to sample thickness was controlled to . Figure 3 shows the spatial distribution of Stokes 0 in the horizontal plane, and righthand circular polarization inputs. Because Stokes 0 indicates the measured optical power, the result implies the thickness distribution of each tooth layer of the sample. 3.Results and Discussion3.1.DEZ EvidenceThe change from enamel to dentin is illustrated in Figs. 4Fig. 5–6. Unlike the traditional concept of a junction interface between dentin and enamel, the DEZ description offers more objective and accurate information. This technique, DEZ optical properties determined by birefringence, can be used for diagnosing dentin hypersensitivity. This technique can also be applied to diagnose and treat other abnormalities of the tooth. For example, this measurement can be used for monitoring the enamel and/or dentin damage after bleaching teeth; the composition of the changes of chemical materials, noted in the birefringence, can be determined.14 Clinicians can assess the pathogenic risk of dentin hypersensitivity and efficacy of surgery by comparing polarization states. Previous studies used AFM and SEM8–10 to determine the characteristics of the DEZ. Although they demonstrate the scallop structure of the DEZ, these tools are difficult to use clinically because of physical limitations. Optical polarization probing is a convenient and portable optical scanning technique for the characterization of tooth structure. 3.2.Polarization Probing of Tooth StructureThe Mueller matrix is a method used to calculate the optical properties of transmitted material for manipulating Stokes vectors, which represent the polarization of incoherent light. By analyzing the Mueller matrix, the optical properties of transmission such as diattenuation and retardance can be determined mathematically.15 According to classic optical theory, every optical element can be treated as a linear matrix.15 If the incident Stokes parameter is , the output result after transmitted through a sample is , the relationship between and is: where is a linear matrix that describes the optical properties of the experimental sample. The Mueller matrix can be used to obtain an optical analysis of a variety of input polarization states so that the properties and the structure of the sample can be determined. There are two modes, transmittance and back-reflection modes, used for measurement of polarization that can be adopted for Stokes–Mueller calculation. Figure 7 illustrates the two experimental conditions. The transmission and reflection of the Mueller matrices ( and ) can be defined as and where is the refractive index of the contact material.15,16 The transmission Mueller matrix can be regarded as transparent in free space. Therefore, the only difference between the two measurements is the term of . When the refractive index of the sample is studied, can be reduced as a constant matrix. Furthermore, because the refractive index can be observed from many optical measurement methods,15–17 can be regarded as a given parameter. Hence, the transmittance and back-reflection modes show equivalent results in the measurement of polarization properties.Direct comparison of the histological structure was performed by measuring the tooth sample with transmittance mode probing. In the experiment, the horizontal plane, , and right circular polarized light were used to illuminate the tooth sample. Figures 4Fig. 5–6 show the Stokes 1–3 spatial distributions via input polarization states, using 0.5-mm step scanning. In a previous study,11 enamel and dentin showed different retardance that originated from their different microstructure direction. A gradient change of birefringent properties was observed between 6.5 and 8.5 mm via different input polarization. The Mueller matrix of glass was nearly transparent without diattenuation or retardance according to the measurements [Eq. (4)]. Equations (5)–(7) show the measured Mueller matrices of enamel, dentin and DEZ. Fig. 7Transmittance (a) and back-reflection (b) experiment modes. : transmission Mueller matrices, : reflection Mueller matrices, : Mueller matrices of input light, : Mueller matrices of sample, : incident angle.  Mueller matrix of glass: Mueller matrix of enamel: Mueller matrix of dentin: and Mueller matrix of DEZ: Furthermore, the total retardance can be addressed as15 where is an element of the Mueller matrix and indicates the index. Table 1 lists the calculated total retardance of enamel, dentin, DEZ and glass, which were each measured as 25.84 deg, 143.91 deg, 26.97 deg, and 0 deg. The retardance gradient changed from enamel to dentin. Figure 8 shows the retardance angles of a tooth section. Similar results can be estimated for the DEZ. As reported previously,3,7 the DEZ effective width (working width, around 200 to 300 μm) is larger then the mechanical width (physical width, ) and can be evaluated according to micro-hardness profiles obtained from stress tests.7,18–21 However, AFM and SEM measurements have no in vivo clinical applications. For in vivo measurements, optical evaluation may provide an effective screening method.Fig. 8Characterization of tooth structure. The structural directions of enamel and dentin are plotted based on the Stokes–Mueller calculation. The DEZ is indicated by characterization of the enamel-dentin structure. 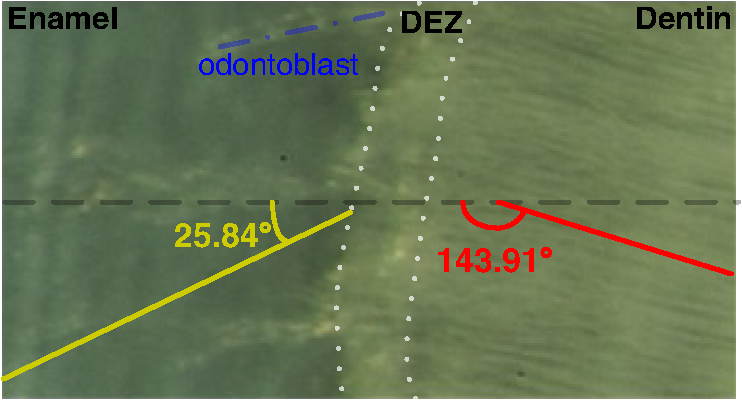 Table 1Retardance of each tooth layer.
The gradient retardance angle change in the DEZ of a healthy tooth is illustrated in Fig. 8. In this paper, the minimum spatial resolution of the polarimater was around 500 μm. When a patient has a critical fracture, it destroys the DEZ structure and changes the retardance angle. Although the spatial resolution is limited, the fractured tooth DEZ can still be assessed because it usually occurs within several millimeters. This additional information can help dentists evaluate the risk of tooth fracture at the region where the retardance angle is noted to be changing. With high-spatial-resolution (around 20 μm) polarization optical coherence tomography (PS-OCT), it is possible to meticulously define the DEZ working width with in vivo optical testing. Furthermore, the odontoblast process, as noted in Fig. 8, affects the estimation of the DEZ retardance angle; this illustrated the odontoblast process of dentin. The odontoblast process is an extension of a cell called an odontoblast, which forms the dentin in a tooth. It also extends into the enamel of a healthy tooth.11 The odontoblast process can be observed in Fig. 8 changing from dentin to enamel. It resides in the dentinal tubules, is approximately 1 μm in diameter, is embedded in a collagen matrix–apatite reinforced composite.1,12,13 Because the tubular structure is oriented from dentin to enamel, the odontoblast process effects the final polarization calculation. Moreover, a copious thickness is observed around these tubular structures. The transmittance is affected, as are the measurements of accumulated polarizing effects, which can lead to the retardance angle being overestimated. Correction of this deviation, to obtain uniform thickness of samples, can be obtained. Such results can be used to establish a dental clinical application database. A complete database of a patient’s DEZ retardance can be used by clinics to compare the variation of the DEZ. A comparison can help clinics to clarify and distinguish dentin hypersensitivity from other oral problems because of the confirmation of a relationship between the DEZ and this common problem.11 Moreover, an early, more accurate diagnosis will benefit patients. 4.ConclusionsThe DEZ provides an important biomimetic model for joining two dissimilar structures.2 Comprehensive understanding of DEZ structures can lead to many useful clinical applications, such as a restorative dental interface or ceramic–dentin interface. Consistent with previous studies,22–24 characterization of the DEZ was described in this paper. The DEZ has birefringent properties that connect enamel and dentin. The measurements can be applied to determine a preliminary DEZ working width that can be used for tooth fracture prevention. The working width was related to the ability to achieve stress relief. With a well-estimated critical fracture risk, early fracture prevention and treatment can be provided. This might reduce the loss of teeth. Moreover, it can be used for the diagnosis of dentin hypersensitivity and tracing. Because the Stokes calculation depends on the tooth structure orientation, tissue variations, caused by treatments or diseases, can be correlated with polarization changes. By recognizing these variations and distributions, improved postoperative care might be possible. Furthermore, dentin hypersensitivity can be estimated; clinics might be able to provide improved therapy for this troublesome oral disease. In addition, the results of this study show a potential for distinguishing mantle dentine. It is well known that the DEZ is less well mineralized than enamel but that it contains a higher organic matrix; it is probably associated with the first formed mantle dentin.1 The mantle dentin is difficult to observe by radiography because of the similar properties of primary and secondary dentin. It provides an average effect of the experimental results and increases the width measurement results of the DEZ or produces a different change in the curve, as in Fig. 4 at 6 mm. The method reported in this study may provide a technique that can distinguish it from other dentin. This is the first study to demonstrate a method based on the Stokes–Mueller calculation that can be applied to the identification of the DEZ. A cross-section of a tooth slice was optically scanned for polarization analysis. The one-dimensional Stokes distribution indicated the location and thickness of the DEZ. Different from the traditional methods used for diagnosis, this optical method could be used to diagnose dentin hypersensitivity without invasive surgery. By tracking the changes of birefringence distribution, dentin hypersensitivity can be diagnosed. Moreover, this method has the potential to be used for the diagnosis of other clinical diseases and postoperative monitoring. PS-OCT with is currently being developed to overcome the poor spatial resolution for bulk tooth measurements. Moreover, with high spatial resolution, it might be possible to define the DEZ working width in vivo. AcknowledgmentsThis work was supported by the Taiwan National Science Council under Grant NSC 101-2628-E-010-003-MY3. ReferencesS. J. Marshallet al.,
“The dentin-enameljunction—a natural, multilevel interface,”
J. Eur. Ceram. Soc., 23
(15), 2897
–2904
(2003). http://dx.doi.org/10.1016/S0955-2219(03)00301-7 Google Scholar
C. P. LinW. H. Douglas,
“Structure-property relations and crack resistance at the bovine dentin-enamel junction,”
J. Dent. Res., 73
(5), 1072
–1078
(1994). http://dx.doi.org/10.1177/00220345940730050901 Google Scholar
P. ZaslanskyA. A. FriesemS. Weiner,
“Structure and mechanical properties of the soft zone separating bulk dentin and enamel in crowns of human teeth: insight into tooth function,”
J. Struct. Biol., 153
(2), 188
–199
(2006). http://dx.doi.org/10.1016/j.jsb.2005.10.010 JSBIEM 1047-8477 Google Scholar
P. M. Bartold,
“Dentinal hypersensitivity: a review,”
Aust. Dent. J., 51
(3), 212
–218
(2006). http://dx.doi.org/10.1111/j.1834-7819.2006.tb00431.x Google Scholar
C. R. IrwinP. McCusker,
“Prevalence of dentine hyper-sensitivity in a general dental population,”
J. Ir. Dent. Assoc., 43
(1), 7
–9
(1997). Google Scholar
N. X. West,
“Dentine hypersensitivity: preventive and therapeutic approaches to treatment,”
Periodontol. 2000, 48
(1), 31
–41
(2008). http://dx.doi.org/10.1111/j.1600-0757.2008.00262.x Google Scholar
M. Fageset al.,
“Comparative mechanical behavior of dentin enamel and dentin ceramic junctions assessed by speckle interferometry (SI),”
Dent. Mater., 28
(10), e229
–e238
(2012). http://dx.doi.org/10.1016/j.dental.2012.05.006 Google Scholar
J. D. Woodet al.,
“Mapping of tooth deformation caused by moisture change using moire interferometer,”
Dent. Mater., 19
(3), 159
–166
(2003). http://dx.doi.org/10.1016/S0109-5641(02)00025-8 Google Scholar
Jr. G. W. Marshallet al.,
“Mechanical properties of the dentinoenamel junction: AFM studies of nanohardness, elastic modulus and fracture,”
J. Biomed. Mater. Res., 54
(1), 87
–95
(2001). http://dx.doi.org/10.1002/1097-4636(200101)54:1<87::AID-JBM10>3.0.CO;2-Z Google Scholar
S. R. Stocket al.,
“Synchrotron microComputed Tomography of the mature bovine dentinoenamel junction,”
J. Struct. Biol., 161
(2), 162
–171
(2008). http://dx.doi.org/10.1016/j.jsb.2007.10.006 Google Scholar
A. R. Ten Cate, Oral Histology: Development, Structure, and Function, 4th ed.Mosby, St. Louis
(1994). Google Scholar
Jr. G. W. Marshall,
“Dentin: microstructure and characterization,”
Quintessence Int., 24
(9), 606
–617
(1993). http://dx.doi.org/10.1177/00220345590380032701 Google Scholar
Jr. G. W. Marshallet al.,
“The dentin substrate: structure and properties related to bonding,”
J. Dent., 25
(6), 441
–458
(1997). http://dx.doi.org/10.1016/S0300-5712(96)00065-6 Google Scholar
J. E. DahlU. Pallesen,
“Tooth bleaching—a critical review of the biological aspects,”
Crit. Rev. Oral Biol. Med., 14
(4), 292
–304
(2003). http://dx.doi.org/10.1177/154411130301400406 Google Scholar
D. Goldstein, Polarized Light, Marcel Dekker, Inc., New York
(2003). Google Scholar
D. S. KlingerJ. W. LewisC. E. Randall, Polarized Light in Opticals and Spectroscopy, Academic Press, Inc., San Diego, California
(1990). Google Scholar
Y.-S. Hsiehet al.,
“Subgingival calculus imaging based on swept-source optical coherence tomography,”
J. Biomed. Opt., 16
(7), 071409
(2011). http://dx.doi.org/10.1117/1.3602851 JBOPFO 1083-3668 Google Scholar
R. WangS. Weiner,
“Strain-structure relations in human teeth using Moire fringes,”
J. Biomech., 31
(2), 135
–141
(1998). http://dx.doi.org/10.1016/S0021-9290(97)00131-0 Google Scholar
R. CraigF. A. Peyton,
“The micro-hardness of enamel and dentin,”
J. Dent. Res., 37
(4), 661
–668
(1958). http://dx.doi.org/10.1177/00220345580370041301 Google Scholar
R. CraigP. E. GehringF. A. Peyton,
“Relation of structure to the micro hardness of human dentin,”
J. Dent. Res., 38
(3), 624
–630
(1959). http://dx.doi.org/10.1177/00220345590380032701 JDREAF 0022-0345 Google Scholar
S. Bechtleet al.,
“Crack arrest within teeth at the dentinoenamel junction caused by elastic modulus mismatch,”
Biomaterials, 31
(14), 4238
–4247
(2010). http://dx.doi.org/10.1016/j.biomaterials.2010.01 BIMADU 0142-9612 Google Scholar
H. Fonget al.,
“Nano-mechanical properties profiles across dentin–enamel junction of human incisor teeth,”
Mater. Sci. Eng. C, 7
(2), 119
–128
(2000). http://dx.doi.org/10.1016/S0928-4931(99)00133-2 Google Scholar
M. Travareset al.,
“Light augments tooth whitening with peroxide,”
J. Am. Dent. Assoc., 134
(2), 167
–175
(2003). Google Scholar
S. N. Whiteet al.,
“The dentino-enamel junction is a broad transitional zone uniting dissimilar bioceramic composites,”
J. Am. Ceram. Soc., 83
(1), 238
–240
(2000). http://dx.doi.org/10.1111/j.1151-2916.2000.tb01181.x Google Scholar
|