
|
|
1.IntroductionThere are two primary forms of invasive breast carcinomas, ductal and lobular, named after the breast structure from which they originate. The replication of tumor cells within these structures without interacting with the surrounding tissue is called carcinoma in situ, where ductal carcinoma in situ (DCIS) makes up 25 to 30% of all diagnosed breast cancer.1 Seventy-five to 80% of invasive breast carcinomas are categorized as invasive ductal carcinoma (IDC),2 which is the progression of a primary tumor from within the breast duct to an invasion of surrounding tissue by penetrating through the basement membrane of the duct. Invasive lobular carcinoma (ILC) is the invasive growth of cancer cells that originate in the lobules and penetrate the surrounding breast tissue. Lobular carcinoma in situ (LCIS) is characterized as abnormal proliferation of acinar cells in terminal ductal lobular units that are commonly undetectable by mammograms but, if detected (usually in biopsies taken for other reasons), can serve as a marker for increased risk of future invasive carcinomas (ILC or IDC) in either breast.3 With the increased capabilities of early detection and treatment of cancer, mortality rates due to the primary tumor have decreased, and currently 90% of cancer mortality is a result of metastatic events.4 It is therefore becoming increasingly important to uncover prognostic markers that can help us understand the metastatic potential of a primary tumor to aid in determining the optimal course of patient treatment, as well as for assisting in the creation of new methods of treatment. Previous research points to tumor size,5,6 lymph-node status,6 histologic grade,7 urokinase plasminogen activator (uPA) protein levels,8,9 as well as other genetic and physiological factors of the tumor to predict levels of metastasis.10 Changes in these factors are accompanied by changes in the extracellular matrix (ECM) in the tumor stroma10–12 that result from the release of signals and proteases from surrounding stromal cells such as cancer associated fibroblasts13 and macrophages.14 A major focus of ECM modification is alterations in collagen, including degradation of collagen IV, XV, & XVIII in the basement membrane surrounding the tumor,15 and remodeling of collagen I throughout the connective tissue.13,16,17 Modified fibrillar collagen in the connective tissue allows for a more efficient dispersal of tumor cells into the surrounding tissue and vasculature to spread to a secondary location.16,17 Second harmonic generation (SHG) is a scattering phenomenon in which two incoming photons of the same wavelength are scattered by a noncentrosymmetric structure into one photon of exactly half the wavelength. The resultant emission is coherent, hence the directionality, intensity, and polarization of the outgoing light are sensitive to various properties of the scatterers, including scatterer order and spacing and angle, as well as overall spatial extent of the scatterer distribution along the laser axis.18–20 Collagen, primarily type I collagen, is capable of producing an SHG signal that can be detected in biological samples and used as a technique for monitoring the changes in ECM structure throughout tumor development. This technique results in high-resolution two-photon images without the need for fluorescent staining and without photobleaching and can be applied to the surface of a primary tumor, excised tissue, or a sectioned sample to provide insight into matrix properties. The progression of breast tumors is diagnosed along a two-axis classification scheme, based upon the ability to visually differentiate the tumor cells from healthy cells, as well as the stage of the growth and metastatic properties of the tumor (see Sec. 2.2). Fenhalls et al. used Northern analysis of tumor samples to show that tumor staging is accompanied by changes in the level of collagen mRNA.21 Following this study, many groups have incorporated two-photon techniques to analyze collagen SHG signals in an attempt to differentiate healthy and tumor tissue. Morphological collagen changes, such as the shape of fibrillar collagen22 or its orientation with regards to the border of the primary tumor,23 have been investigated in order to differentiate between healthy and malignant tumors as well as to predict survival rates associated with primary tumor samples. Further studies have incorporated third harmonic generation signals24 or intrinsic fluorescence analysis25,26 to increase the morphological information provided by a tumor sample and to standardize quantitative SHG measurements using the ratio of SHG/two-photon excited fluorescence (TPEF). In a mouse model of epithelial carcinoma SHG and TPEF of intrinsic signals was used to track the progression of tumors throughout different pathological phases.27 Zhuo et al. showed that backward propagating SHG of freshly removed ectocervical samples could be used to differentiate between healthy tissue, cervical intraepithelial neoplasia (precancer), and cancer, showing the potential of SHG techniques to not only differentiate between healthy and tumor tissue intra-operatively but to provide insight into the progression of the tumor.28 The ratio of the forward to backward propagating SHG signal (F/B ratio) is sensitive to the spatial extent of the scatterers along the optical axis (in collagen, the effective fibril diameter) as well as order versus disorder in fibril packing.18–20 In this study we will use the phrase collagen “microstructural properties” to indicate those properties of an individual collagen fiber, which influence SHG F/B from that fiber, as distinct from collagen “morphology,” which will indicate macroscopic properties such as fiber orientation, tortuosity, and overall density of fibers. It has been shown previously that the F/B ratio can be used to differentiate between healthy and tumor ovarian cancer,29 which is particularly interesting because F/B analysis is intrinsically ratiometric and hence is less susceptible to variations in excitation intensity and is also less susceptible to user-to-user variability of morphology-based analysis techniques. We are interested in exploring the application of F/B imaging to breast tumor samples to learn about the evolution of fibrillar collagen microstructural properties during tumor progression. 2.Methods2.1.Breast Cancer Tissue SamplesThe samples used throughout this study are primarily tissue microarray (TMA) slides, which are composed of 0.6- to 1.0-mm-diameter samples from cylindrical cores of paraffin embedded tissue specimens sectioned into 5-μm thick slices. One advantage of these samples is that due to their thickness the effect of subsequent scattering or absorption of SHG light is negligible [the absorption coefficient is , while the reduced scattering coefficient is .30,31 Each 5-μm thick, specimen corresponds with a different patient/tumor and is mounted on a slide, with several tens of samples on each slide. The tumor specimens are staged by a certified pathologist, and every tenth section of the TMA block is used to create an H&E stained slide, which is analyzed by the pathologist to ensure that each sample is within the tumor and demonstrates properties of the diagnosis. Hence in the direction perpendicular to the plane of the sample, each tissue section is at least 50 μm from the tumor surface. In the plane of the sample, sections are chosen that are entirely within the tumor and do not contain significant healthy tissue, based upon inspection of the adjacent H&E stained slides. However, the distance from the outer edge of the core to the tumor surface is not known. Consequently any significant variation of tumor SHG properties with distance from the tumor edge may increase the variance in our measurements. The breast cancer tissue microarray samples used throughout this study came from two sources. Samples of healthy breast tissue, as well as various grades and stages of IDC and ILC, were purchased from Biomax (Rockville Maryland, slides BR1921, BR20830, BR805, BR961, and BR954). Pure DCIS and IDC tissue microarray slides were received from Dr. Ping Tang and created in the Department of Pathology and Laboratory Medicine at the University of Rochester Medical Center. In addition to the tissue microarray samples, several LCIS and ILC samples were generated from paraffin embedded tissue blocks, cut to 5 μm thickness. In these samples we utilized an adjacent H&E stained slide to identify the region of tumor, then generated a single SHG field of view from the center of tumor in the unstained slide. Table 1 summarizes which samples were used to create each data set. Table 1Table of the tissue microarray slides that were used, along with how many samples from each slide were used to create each set of results. The number given (i.e., “BR1921”) is the part number of the Biomax microarray slide, while “URMC” refers to the full sections or tissue microarray (TMA) slide manufactured by the University of Rochester Department of Pathology. Note that samples are “double counted” in that a sample that is IDC T1 and N0 would count in both the IDC T1 column as well as the IDC N0 column.
2.2.Sample Grading and StagingInvasive breast tumors are graded on a three-state classification system dependent upon tubule formation, nuclear polymorphism, and mitotic count, where Grade 1 has the most differentiated tissue with the best prognosis and Grade 3 is the least differentiated with the worst prognosis. The TNM staging system is a method of tumor classification determined by the size of the primary tumor (), regional lymph node involvement (), and presence of distant metastases (). Staging of the primary tumor () as well as the metastatic events in the lymph node () incorporates multiple degrees of staging as opposed to metastatic staging (), which is a binary system determined simply by the presence or absence of a distant metastases. The primary tumor staging is split into categories based on tumor diameters of between 1 to 20 mm (), between 20 to 50 mm (), and greater than 50 mm (). Tumors that have penetrated the chest wall or skin, independent of the size of the tumor are staged as tumors. The lymph node (LN) staging scale begins at indicating there are no metastatic events present in the LN that are greater than 0.2 mm or 200 cells. The two middle stages, and , describe increasing involvement in the axillary LNs, or metastasis to the internal mammary LNs without spread to the axillary LNs. Specifically, tumors have either micrometastases, one to three axillary LN metastases, or sentinel LN metastases detected through biopsy. tumors are characterized by four to nine axillary LN metastases, or clinically detected sentinel LN metastases. stage is the most far reaching metastatic LN events, including either greater than 10 axillary events with at least one event greater than 2 mm, infraclavicular LN metastases, or clinically detected internal mammary and axillary LN metastases.32 Note that grading information was not available for ILC samples, which are uniformly low grade, nor was M stage information available because distant metastases for this tumor type, if they occur, usually appear many years after initial diagnosis and hence are not known during preparation of the TMA. All samples were classified based upon the aforementioned grading and staging scheme by a certified pathologist, and all parties were blinded to the classification of the samples during image acquisition and analysis. 2.3.ImagingThe excitation light is a Spectra Physics MaiTai Ti:Sapphire laser at 810 nm, with 100 fs pulses at 80 MHz. It is directed to the sample through an Olympus BX61WI upright microscope, with beam scanning and image acquisition controlled by an Olympus Fluoview FV300 scanning system. Before entering the scan box, the laser passes through a Berek compensator (Model 5540, New Focus) adjusted such that the excitation light reaching the objective lens is circularly polarized (verified as variation in transmitted power versus angle of an analyzer set after the dichroic and before the objective lens). An Olympus UMPLFL20XW water-immersion lens (, 0.5 NA) is used to focus excitation light and capture backward propagating SHG signal. After passing through the objective, the signal is separated from the excitation beam using a 670-nm short-pass dichroic mirror, filtered using a 405-nm filter (HQ405/30m-2P, Chroma, Rockingham, Vermont), and collected by a photomultiplier tube (Hamamatsu HC125-02). In the forward direction an Olympus 0.9 NA optical condenser was used to collect the signal, reflected by a 475-nm long-pass dichroic mirror (475 DCSX, Chroma, Rockingham, Vermont) in order to remove excess excitation light, filtered by a 405-nm filter (HQ405/30m-2P, Chroma, Rockingham, VT) and captured by photomultiplier tube (Hamamatsu HC125-02). 2.4.F/B AnalysisForward and backward images were simultaneously collected as a stack of 11 images spaced 3 μm apart, with a 660-μm field of view from unstained samples of IDC, DCIS, ILC, LCIS, and healthy breast tissue. One stack was made from the geometric center of each TMA sample. For the non-TMA samples, the image field in an unstained section was chosen based upon imaging of an adjacent H&E stained section to identify the center of the visible tumor structure. Image analysis was conducted in with ImageJ Software.33 Each stack was maximum intensity projected, serving as an “autofocus” for the effectively single layer of collagen that exists in these 5-μm sections and producing a single-image pair for each sample. Projected images were background subtracted using a maximum intensity projection of an 11 image scan taken with a closed shutter. Day to day variations in optical alignments were accounted for by imaging one tissue sample (not included in the data pool) each day as a standard SHG sample and determining a normalization factor for each detector pathway that rendered the signal from that standard sample constant over time. For each image, a common threshold was applied to all images taken in that imaging session and chosen by a blinded observer to distinguish collagen pixels from background pixels. The threshold of the backward-collected image was then used to create a mask, in which all of the pixels above threshold were set to 1, and all of the pixels below the threshold were zero. That mask was then used to exclude background (i.e., non-fiber) pixels from consideration and the average pixel value of fiber (i.e., non-background) pixels was calculated from an F/B ratio image. Due to the small sample thickness (5 μm), we assume that the measured F/B ratio is due solely to the original ratio of forward-emitted and backward-emitted SHG and is not significantly affected by subsequent backscattering of either component.30,31 Note that unless otherwise specified (see Sec. 2.5) all quantification of SHG F/B is performed in unstained specimens. 2.5.Analysis of Spatial Heterogeneity of F/BH&E stained sections of DCIS, LCIS, and healthy breast were imaged with a CCD camera (Olympus, SP-350) through the microscope eyepiece and an SHG F/B image of the same approximate field of view was generated as described above. Based upon the tissue H&E staining patterns imaged by the CCD camera, in the SHG images regions of interest within 50 μm of ductal or lobular structures were outlined with ImageJ, producing at the same time regions of interest greater than 50 μm from ductal or lobular structures. The average F/B ratio within those regions of interest (per-ductal, peri-lobular, or distant from either feature) was then calculated as described in the previous section. 2.6.Effects of H&E Staining on SHG F/BIn DCIS, LCIS, and healthy breast samples, pairs of adjacent 5-μm sections were cut and mounted on glass slides, and one of the pair was H&E stained. SHG F/B of each adjacent section were analyzed as described in F/B Analysis above and compared to determine the effects of H&E staining on SHG F/B. In addition to quantifying the effects of staining on SHG F/B averaged over the entire 600-μm field of view, peri-ductal regions, peri-lobular regions, or regions distant from either feature were independently analyzed as described in Analysis of Spatial Heterogeneity of F/B above. 2.7.StatisticsStatistical analysis was performed using Prism 5 software (GraphPad, La Jolla, California). Statistically significant data was defined as a -value less than 0.05. Comparisons of two groups were analyzed using unpaired student’s t-tests. If the F-test for this data returned a value , a Mann-Whitney nonparametric t-test was used. For grouped analysis a one-way ANOVA was used with a Newman-Keuls multiple comparison post-hoc test to determine the difference between groups. If the Barrett’s test for equal variance results in a -value less than 0.05, a non-parametric Kruskal-Wallis test with a Dunn’s post-hoc test was performed. 3.ResultsFigure 1 shows images of backscattered SHG signal and F/B ratio as compared with tissue organization apparent in H&E staining, taken from the same section of healthy and tumor samples. These example SHG images demonstrate some typical collagen morphological changes that occur through the progression of ductal and lobular carcinoma, including changes in density, length, and organization of fibrillar collagen as seen in, for example, the “healthy” SHG image, which has an appearance of many wavy fibers matted together, versus the “IDC” image where the collagen appears to form sparser, longer, and straighter fibers. Fig. 1Sample images of five types of tissue analyzed in this study, from top to bottom: healthy tissue, DCIS, LCIS, IDC, and ILC. The left column shows H&E staining, the middle columns show backward- and forward-scattered SHG, and the right column shows the F/B ratio image.  Changes in SHG F/B ratio were first analyzed in the progression from healthy tissue to DCIS to IDC, as shown in Fig. 2(a). The DCIS samples did not differ significantly from the healthy samples, but both the healthy and the DCIS samples had a significantly higher F/B ratio than the IDC samples. While IDC samples are typically homogenous fields of invasive cells within tumor matrix, DCIS and healthy tissue exhibit a heterogeneous structure with obvious clusters of ductal and lobular structures separated by regions of relatively cell free matrix (Fig. 1). This leaves open the possibility that SHG F/B in DCIS is indeed changing, but that these changes are confined to the immediate vicinity of ductal structures and are missesd in our wide-area () averaging. In H&E stained samples, we found no statistically significant difference between F/B in periductal regions (within 50 μm of ductal structures) versus perilobular regions or versus regions distant from ducts or lobes (greater than 50 μm from ductal or lobular structures) in DCIS or in healthy tissue ( patients each, , data not shown). To determine if this use of H&E staining affects SHG F/B, we evaluated F/B in adjacent tissue sections (one stained, one unstained) and found no statistically significant difference in F/B caused by staining in periductal regions, perilobular regions, nor regions distant from ducts or lobes, in either DCIS or in healthy tissue ( patients each, , data not shown). Fig. 2IDC F/B ratio throughout (a) ductal carcinoma progression and (b) increasing grade, or decreasing tumor cell differentiation. (a) These results show no difference between DCIS () and healthy tissue (), but there was a significant difference between IDC () and the two other tissue types. (b) As the IDC tumor progresses into higher grades the F/B ratio differs significantly from healthy tissue. Specifically, there is no difference between healthy and Grade 1 IDC (), but both of these are significantly higher than Grade 2 IDC (). Grade 3 () is significantly lower than healthy tissue. Error bars represent standard error and * signifies a significant difference between the pair indicated by brackets. 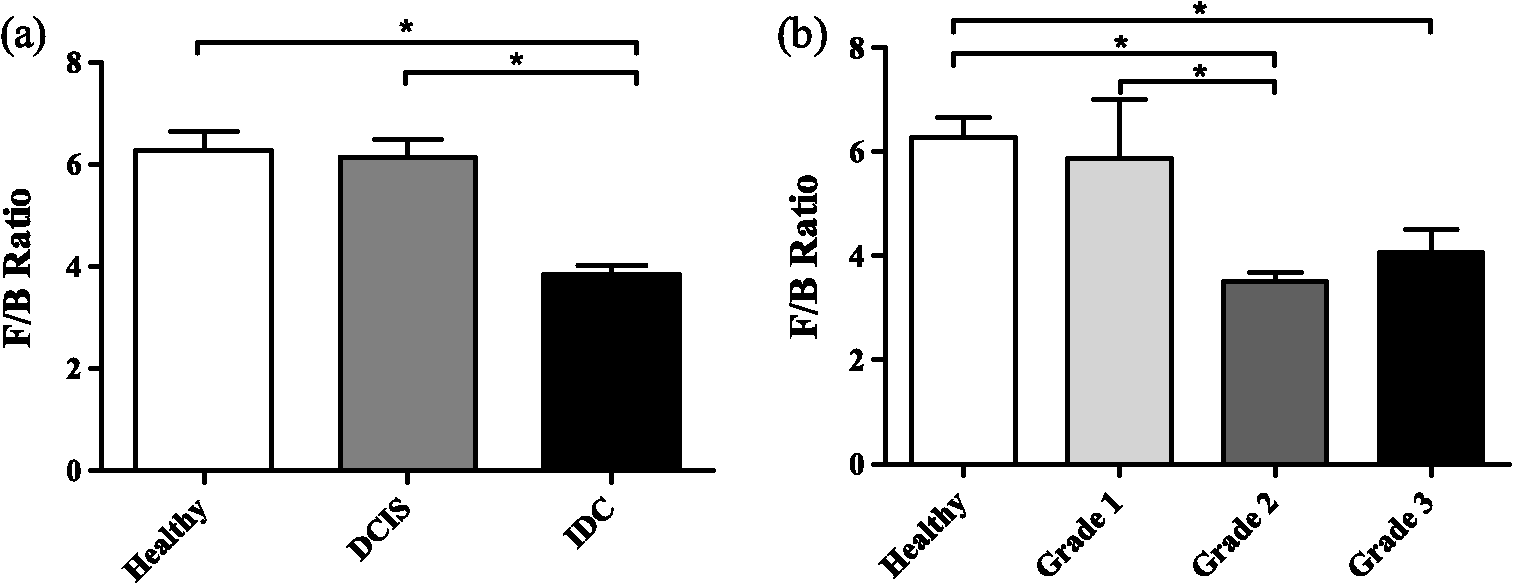 The fact that SHG F/B in IDC was statistically significantly different from healthy tissue led to the question of whether all IDC tumors are immediately differentiable from healthy tissue or if there is an evolution of the fibrillar collagen microstructural properties that become significantly different at a specific grade or stage. Looking first at tumor grade, which signifies how different the tumor cells appear in comparison to healthy cells, it was apparent that Grade 1 tumors were not significantly different from healthy tissue [Fig. 2(b)]. As this tumor type progressed to Grade 2, it developed a significantly lower F/B ratio which remained at approximately this level for Grade 3 tumors as well. Invasive tumor staging is determined by the TMN system, which is dependent on three different properties of the tumor, including its size (T), extent of LN metastatic events (N), and metastasis to sites other than LNs (M) (as described in Sec. 2.2). The F/B ratio was measured as a function of these three categories to determine the change of collagen microstructural properties throughout different stages of IDC tumor development. The F/B ratio was significantly lower in all stages of T-progression than in healthy tissue, but there were no differences or noticeable trends throughout the groups [Fig. 3(a)]. Fig. 3IDC F/B ratio as a function of (a) -stage, (b) -status, and (c) and (d) -stage. (a) Healthy tissue () was significantly higher than all stages (sample sizes of - were , , , and , respectively). (b) The average F/B ratio of tumors () was not significantly different than the tumors (). (c) The F/B of healthy tissue was significantly greater than that of (), (), and (), but was not significantly different than (). (d) F/B of tumors, which have 10 or greater lymph-node metastatic events, is significantly greater than tumors with less lymph-node involvement, i.e., to tumors. (e) From left to right are the backward-scattered SHG image, forward-scattered SHG image, and the F/B ratio image for healthy tissue (top), IDC (middle), and IDC (bottom). Error bars represent standard error and * signifies a significant difference between the pair indicated by brackets. An * directly on a single bar, without a bracket, represents a significant difference from all other groups being compared.  One of the more interesting questions regarding the use of SHG analysis to study breast cancer progression is how the microstructural properties of fibrillar collagen in the primary tumor (as indicated by SHG F/B) relate to the potential of the tumor to metastasize. Figure 3(b) shows that the binary M-status did not have a significant effect on the F/B ratio of IDC tumors. However, this M-status is coarse, in that it divides tumors into only two categories, those with and without known metastases to distant organs other than the lymph nodes. It is possible to further test the relationship between SHG F/B and metastatic potential of a tumor by looking at N-stage progression, which increases through four classification stages dependent upon the severity of LN involvement in metastatic events (as described in Sec. 2.2). This gives a more detailed description than M-status, because metastatic events in the LNs are more commonly detected than in other secondary sites, and the scale of progression is more finely detailed than the simple binary grading of the M-status. Figure 3(c) shows that between healthy tissue and IDC tumors that are not metastatic to the LNs () or minimally metastatic breast tumors (, ), there is a significant decrease in the F/B ratio of pixels relative to healthy tissue. However, in the stage F/B is not different from healthy tissue. We then pooled the , , and data and compared this pooled set to the data. This allows us to compare SHG F/B for highly metastatic IDC tumors, which have either greater than 10 axillary events with at least one event greater than 2 mm, infraclavicular LN metastases, or clinically detected internal mammary and axillary LN metastases (i.e., ), versus those less metastatic IDC tumors, which do not have any of those properties (i.e., , , or ). This reveals a statistically significant difference between the two groups [Fig. 3(d)]. In order to gain further understanding of breast cancer progression, the same analysis was run on lobular carcinoma samples, to understand how SHG F/B evolves after initiation of the tumor in a different location. ILC showed a significant decrease in F/B ratio compared with healthy tissue, but was not significantly different from the ratio of IDC [Fig. 4(a)]. In contrast to the behavior of F/B in ductal carcinoma, LCIS showed a significant decrease in F/B ratio relative to healthy breast, with no significant difference between LCIS and ILC [Fig. 4(b)]. In a similar fashion to IDC and DCIS discussed above, ILC samples are typically homogenous fields of invasive cells within tumor matrix, while LCIS and healthy tissue exhibit a heterogeneous structure with obvious clusters of ductal and lobular structures separated by regions of relatively cell free matrix (Fig. 1). This leaves open the possibility that SHG F/B in LCIS is indeed changing, but that these changes are confined to the immediate vicinity of lobular structures and are missed in our wide-area () averaging. In H&E stained samples, we found no statistically significant difference between F/B in perilobular regions (within 50 μm of lobular structures) versus periductal regions or versus regions distant from ducts or lobes (greater than 50 μm from ductal or lobular structures) in LCIS or in healthy tissue ( patients each, , data not shown). To determine if this use of H&E staining affects SHG F/B we evaluated F/B in adjacent tissue sections (one stained, one unstained) and found no statistically significant difference in F/B caused by staining in perilobular regions, periductal regions, nor regions distant from ducts or lobes, in either LCIS or in healthy tissue ( patients each, , data not shown). Fig. 4F/B ratio of (a) ILC, (b) LCIS, (c) ILC -stage, and (d) and (e) ILC T-stage. (a) F/B ratio of ILC () is not significantly different than IDC (), but are both significantly lower than healthy breast tissue (). (b) LCIS () and ILC are both significantly lower than healthy breast tissue. (c) All -stage ILC tumors are significantly lower than healthy tissue (, , , and , for to , respectively). (d) (), (), and () ILC tumors all had significantly lower F/B ratios than healthy tissue, but () tumors were not significantly different than healthy tissue. (e) ILC tumors were significantly higher than pooled -3 ILC tumors. Error bars represent standard error, and * signifies a significant difference between the pair indicated by brackets. An * directly on a single bar, without a bracket, represents a significant difference from all other groups being compared. 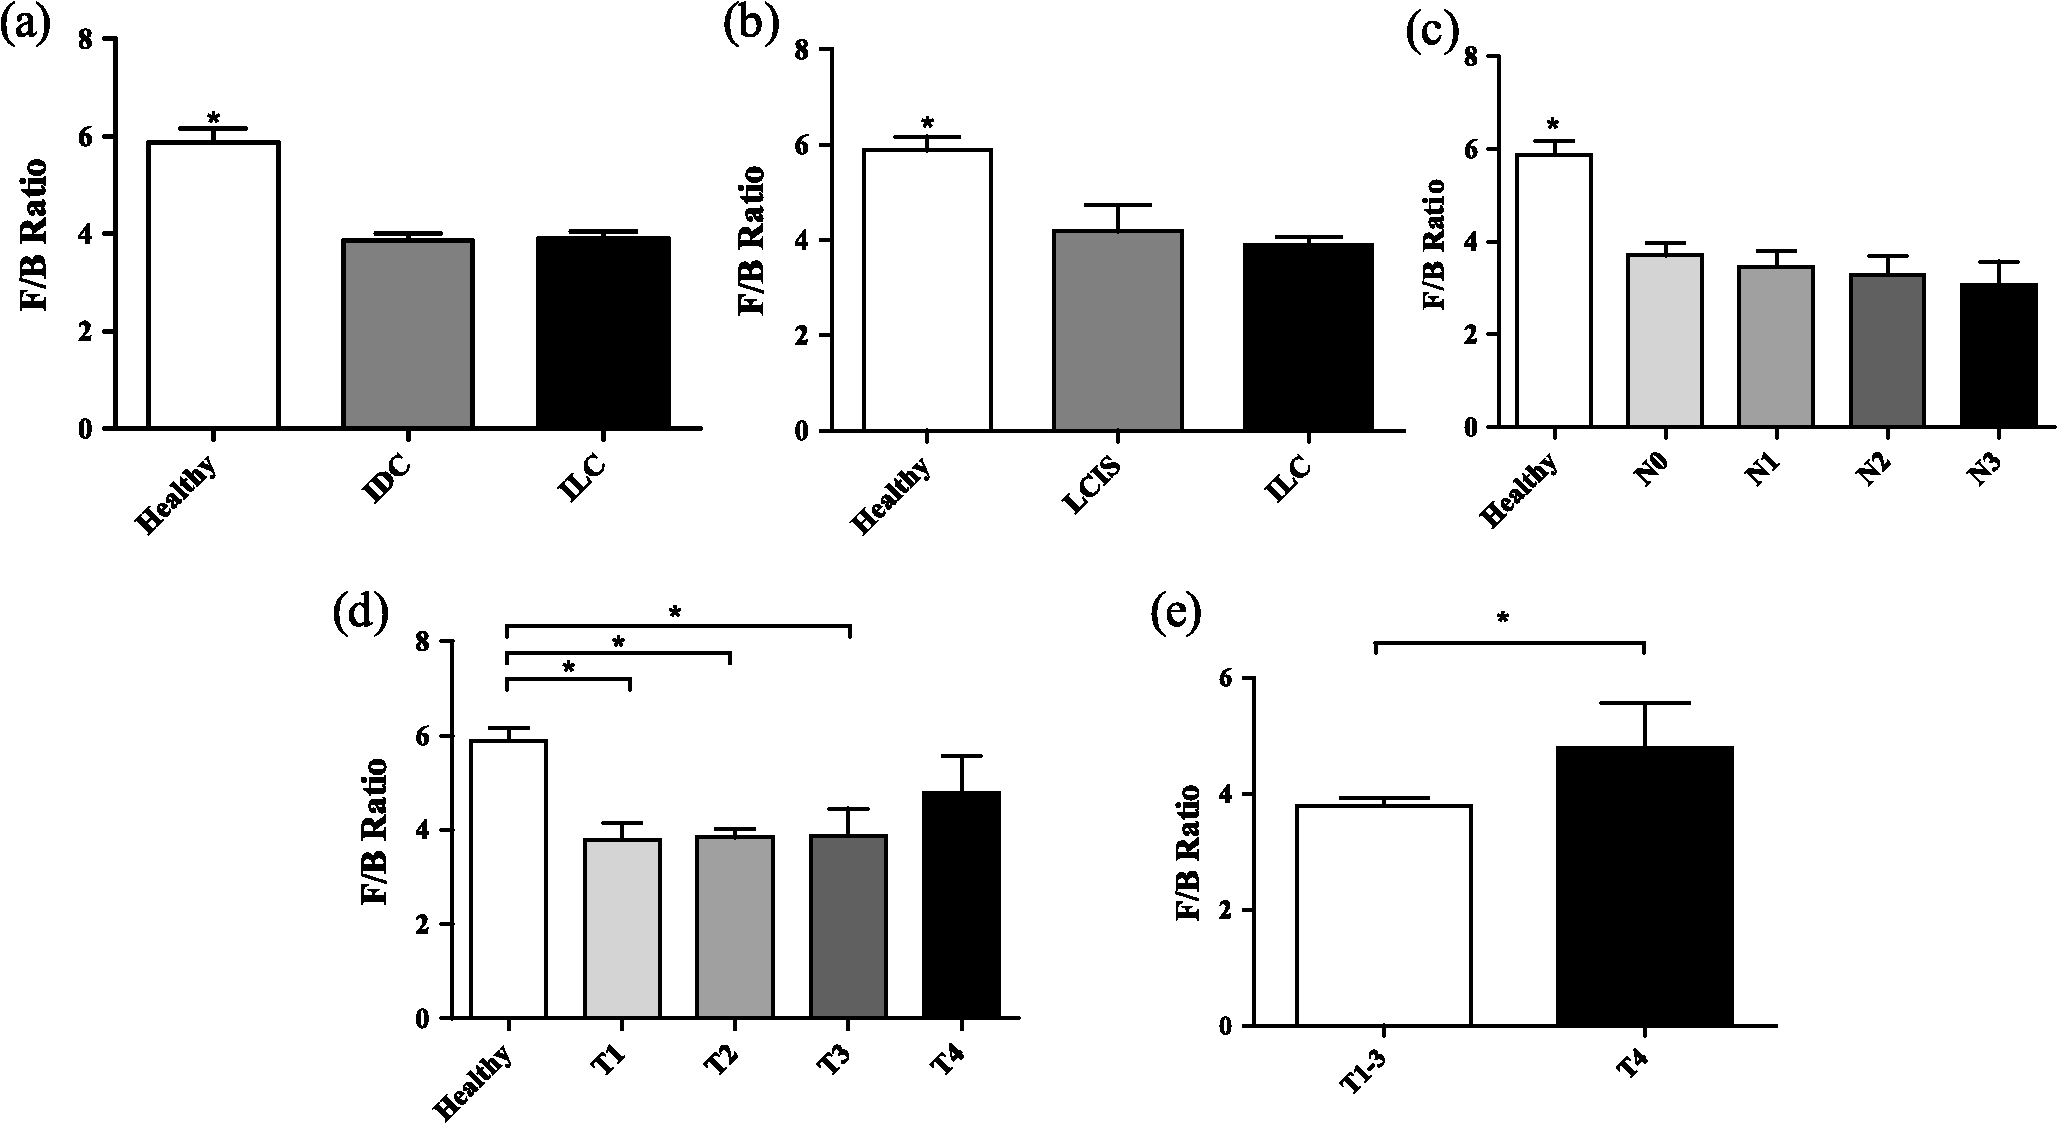 -status analysis of ILC samples showed that there was a significant decrease in the F/B ratio for all N groups relative to healthy tissue, with no significant difference between any of the stages studied [Fig. 4(c)], similar to the trend of IDC for groups - but unlike the behavior of IDC tumors. Analysis of the effects of -status on the fibrillar collagen showed that the F/B ratio decreased significantly between healthy tissue and , , and , stages while is no longer differentiable from healthy tissue [Fig. 4(d)]. is characterized by the interaction of any size tumors with either the chest wall or the skin, hence we pooled the other stages of tumor (producing a group of any sized tumor that does not interact with the chest wall nor the skin) and compare the pooled group to the tumors, demonstrating a significant difference in the F/B ratio [Fig. 4(e)] between these two groups. 4.DiscussionWe analyzed SHG F/B images throughout breast tumor progression in order to understand how this optical signature, which is influenced by fibrillar collagen microstructural properties, evolved alongside the tumor size, cell morphology, and metastatic changes that determine the grade and stage of the tumor. This provided several insights into the biology of ductal and lobular carcinoma. 4.1.Biology of Ductal CarcinomaThe changes in SHG F/B in Fig. 2(a) demonstrate that there is no significant alteration in fibrillar collagen microstructural properties between healthy breast tissue and DCIS, but that there is an alteration in them as the tumor progresses from an in situ to an invasive carcinoma. This is consistent with the fact that the majority of collagen fibers in healthy tissue are surrounding the ducts, so as the tumor cells exclusively fill in the ducts in DCIS, the surrounding collagen microstructural properties remain relatively unaffected. It is only when the tumor cells begin to invade the breast tissue outside of the duct that they induce changes in microstructural properties of the surrounding fibrillar collagen, as observed in the statistically significant difference between SHG F/B of IDC and healthy breast tissue [Fig. 2(a)]. Taking a closer look at this phenomenon, we examined whether invasion through the basement membrane into the surrounding tissue (i.e., the transition from DCIS to IDC) causes an immediate change in the F/B ratio by comparing SHG F/B to the grade of the IDC tumor [Fig. 2(b)]. Our results showed that in Grade 1 IDC the F/B ratio is still not significantly different from the DCIS tissue nor the healthy tissue, but as IDC progresses to a Grade 2 or 3 tumor, the SHG F/B ratio becomes significantly different. This suggests that the overall fibrillar collagen microstructural properties as determined by the F/B ratio are constantly evolving away from the healthy state as the IDC tumor cells become less differentiated. Regarding the changes in primary tumor F/B seen throughout IDC tumor staging, there is interestingly no difference between the IDC samples that are at different primary tumor sizes ( stage), although they are all different than the healthy tissue cohort. Presumably, the transition from healthy to tumor SHG F/B occurs when tumors are small enough to not be included in our cohorts of tumor samples, which means that it occurs when the tumor diameter is less than 1 mm. Once tumors are greater than 1 mm and hence large enough to be included in the -4 grading scheme, the size of the primary tumor does not influence collagen microstructural properties as quantified by SHG F/B. Combined with the fact that F/B of Grade 1 IDC does not differ significantly from healthy tissue, this suggests that during early tumor growth and progression, there is a complex interplay between tumor size and grade, whereby small high-grade tumors may produce a more significantly altered matrix than larger low-grade ones. As tissues progress from healthy to IDC (IDC with no LN involvement), the SHG F/B ratio statistically significantly decreases, and remains low as tumors progress to (small metastatic events or axillary events) and (4–9 axillary events or clinically detected internal mammary LN metastases). Interestingly, as tumors progress to stage ( events, further reaching LN metastases, or metastases to both internal mammary and axillary LN) SHG F/B becomes indistinguishable from healthy F/B [Fig. 3(c)] and is markedly different from the pooled group of other IDC tumors [Fig. 3(d)]. This evolution of SHG F/B suggests two intriguing possibilities. The first is based upon the view that -stage progression is a chronological progression, with a single IDC advancing from having no LN metastases, through the subsequent stages, and ending as an IDC with distant LN metastases. From that perspective, this data demonstrates that during tumor progression fibrillar collagen microstructural properties evolve in ways that affect SHG F/B and raises the possibility that this evolution may influence efficient travel of metastatic tumor cells to distant LNs. After the initial evolution of collagen microstructural properties from normal to abnormal as the tissue progresses from healthy to an tumor, there is a subsequent “normalization” back to the microstructural properties of healthy fibrillar collagen (as quantified by F/B) that may facilitate distant metastasis and lead to the highly metastatic case. Alternatively, these matrix changes may not represent an evolution of individual tumors in time, but suggest instead that those tumors that do not undergo an initial decrease in SHG F/B as the tissue first progresses from healthy to cancerous and maintains a high F/B, may be more likely to produce extensive distant metastases. Although the F/B ratio reveals that there is a similarity in the collagen microstructural properties between the tumor and healthy tissue, inspection of SHG images of healthy and samples reveal that these similarities do not extend to the overall morphology of the fibers, as these are noticeably different between the two tissue states as shown in Fig. 4(d). In traditional staging, IDC tumors are divided into (no known metastases to distant non-lymph-node organs) and (any number of metastases to distant non-lymph-node organs). For IDC tumors, there is no relationship between SHG F/B and status group [Fig. 3(b)]. This suggests either that there is no relationship between fibrillar collagen microstructural properties and the ability of the IDC to metastasize to different (non-LN) organs, or that the act of pooling all numbers of metastases to any non-LN organs into the single category of “” has hidden any subtle differences such as those that were evident in IDC when classified according to the more finely divided stage classification scheme. 4.2.Biology of Lobular CarcinomaLike IDC, ILC causes a change in the fibrillar collagen microstructural properties in breast tissue, as indicated by a decrease in the F/B ratio relative to healthy tissue [Fig. 4(a)]. However, LCIS F/B is significantly different from healthy tissue F/B whereas DCIS is not [Fig. 4(b)]. This difference in matrix alterations is consistent with the significant difference in behavior of the two diseases. Unlike DCIS, which is categorized as cancer and if left untreated is likely to progress to IDC,34 LCIS is described as a development of abnormal cells, which is not believed to progress to ILC (although it does correlate with increased likelihood of the patient developing ILC or IDC later in life).3 In contrast to IDC, the stage of LN involvement [Fig. 4(c)] has no effect on the F/B ratio of ILC, and all stages are statistically different from healthy tissue. The stable F/B ratio throughout increasing LN involvement could result from the ILC’s characteristic lack of a strong inflammatory response after penetrating the basement membrane,35 a response that would otherwise aid in the remodeling of the stromal collagen through recruitment of fibroblasts and macrophages.13,14 In ILC there is a change in SHG F/B with tumor stage, specifically a loss of F/B difference relative to healthy tissue that occurs in the stage of tumor progression [Fig. 4(c) and 4(d)], which is when the tumor interacts with tissues surrounding the breast, such as chest and skin. The marked difference between behavior of IDC and ILC at this stage contrasts with the close quantitative similarity of F/B values between the tumor types at earlier stages [compare Figs. 3(a) and 4(d)]. This suggests that the mechanisms by which ILC and IDC recruit stromal cells to produce the collagenous matrix is subtly different, a difference that only becomes evident once the source of stromal cells shifts from breast tissue to the chest wall and/or the skin. 5.ConclusionThis study has shown a series of changes in collagen microstructural properties, as evaluated with SHG F/B, that occur throughout ductal and lobular carcinoma progression, including those that accompany growth, metastasis and changes in tissue morphology. SHG F/B has revealed a surprisingly complex evolution of the matrix with grade and , , and stage with perhaps the most interesting result being the fact that IDC tumors with the most “normal” F/B values have the largest number of distant LN metastases. This offers the possibility that either developing breast tumors undergo a “normalization” of collagen microstructural properties (but not macroscopic morphology) that correlates with enhanced distant metastases, or that those tissues that retain their healthy collagen microstructural properties upon transition to IDC are most likely to produce significant numbers of distant metastases. AcknowledgmentsThis work was funded by Department of Defense Breast Cancer Research Program (BCRP) Era of Hope Scholar Research Award W81XWH-09-1-0405 and NIH Director’s New Innovator Award 1DP2OD006501. The authors would like to thank Drs. Seth Perry, Kelley Madden, and Ania Majewska for helpful discussions. ReferencesS. BianchiV. Vezzosi,
“Microinvasive carcinoma of the breast,”
Pathol. Oncol. Res., 14
(2), 105
–111
(2008). http://dx.doi.org/10.1007/s12253-008-9054-8 POREFR 1219-4956 Google Scholar
G. D. LeonardS. M. Swain,
“Ductal carcinoma in situ, complexities and challenges,”
J. Natl. Canc. Inst., 96
(12), 906
–920
(2004). http://dx.doi.org/10.1093/jnci/djh164 JNCIEQ 0027-8874 Google Scholar
R. V. Hutteret al.,
“Clinical and pathologic correlation with mammographic findings in lobular carcinoma in situ,”
Cancer, 23
(4), 826
–839
(1969). http://dx.doi.org/10.1002/(ISSN)1097-0142 60IXAH 0008-543X Google Scholar
E. R. Fisheret al.,
“The pathology of invasive breast cancer. A syllabus derived from findings of the National Surgical Adjuvant Breast Project (protocol no. 4),”
Cancer, 36
(1), 1
–85
(1975). http://dx.doi.org/10.1002/(ISSN)1097-0142 60IXAH 0008-543X Google Scholar
S. Koscielnyet al.,
“Breast cancer: relationship between the size of the primary tumour and the probability of metastatic dissemination,”
Br. J. Canc., 49
(6), 709
–715
(1984). http://dx.doi.org/10.1038/bjc.1984.112 BJCAAI 0007-0920 Google Scholar
C. L. CarterC. AllenD. E. Henson,
“Relation of tumor size, lymph node status, and survival in 24,740 breast cancer cases,”
Cancer, 63
(1), 181
–187
(1989). http://dx.doi.org/10.1002/(ISSN)1097-0142 60IXAH 0008-543X Google Scholar
C. W. ElstonI. O. Ellis,
“Pathological prognostic factors in breast cancer. I. The value of histological grade in breast cancer: experience from a large study with long-term follow-up,”
Histopathology, 41
(3A), 154
–161
(2002). http://dx.doi.org/10.1046/j.1365-2559.2002.14691.x HISTDD 1365-2559 Google Scholar
M. P. Looket al.,
“Pooled analysis of prognostic impact of urokinase-type plasminogen activator and its inhibitor PAI-1 in 8377 breast cancer patients,”
J. Natl. Canc. Inst., 94
(2), 116
–128
(2002). http://dx.doi.org/10.1093/jnci/94.2.116 JNCIEQ 0027-8874 Google Scholar
J. A. Foekenset al.,
“The urokinase system of plasminogen activation and prognosis in 2780 breast cancer patients,”
Canc. Res., 60
(3), 636
–643
(2000). CNREA8 0008-5472 Google Scholar
B. WeigeltJ. L. PeterseL. J. van’t Veer,
“Breast cancer metastasis: markers and models,”
Nat. Rev. Canc., 5 591
–602
(2005). http://dx.doi.org/10.1038/nrc1670 NRCAC4 1474-175X Google Scholar
M. SundR. Kalluri,
“Tumor stroma derived biomarkers in cancer,”
Canc. Metast. Rev., 28
(1–2), 177
–183
(2009). http://dx.doi.org/10.1007/s10555-008-9175-2 CMRED4 Google Scholar
G. P. GuptaJ. Massagué,
“Cancer metastasis: building a framework,”
Cell., 127
(4), 679
–695
(2006). http://dx.doi.org/10.1016/j.cell.2006.11.001 11CIAS 0092-8674 Google Scholar
R. KalluriM. Zeisberg,
“Fibroblasts in cancer,”
Nat. Rev. Canc., 6
(5), 392
–401
(2006). http://dx.doi.org/10.1038/nrc1877 NRCAC4 1474-175X Google Scholar
J. W. Pollard,
“Macrophages define the invasive microenvironment in breast cancer,”
J. Leukoc. Biol., 84
(3), 623
–630
(2008). http://dx.doi.org/10.1189/jlb.1107762 JLBIE7 0741-5400 Google Scholar
R. Kalluri,
“Basement membranes: structure, assembly and role in tumour angiogenesis,”
Nat. Rev. Canc., 3
(6), 422
–433
(2003). http://dx.doi.org/10.1038/nrc1094 NRCAC4 1474-175X Google Scholar
P. P. Provenzanoet al.,
“Collagen reorganization at the tumor-stromal interface facilitates local invasion,”
BMC Med., 4
(1), 38
–53
(2006). http://dx.doi.org/10.1186/1741-7015-4-38 BMMECZ 1741-7015 Google Scholar
J. CondeelisJ. E. Segall,
“Intravital imaging of cell movement in tumours,”
Nat. Rev. Canc., 3
(12), 921
–930
(2003). http://dx.doi.org/10.1038/nrc1231 NRCAC4 1474-175X Google Scholar
R. Lacombet al.,
“Phase matching considerations in second harmonic generation from tissues: effects on emission directionality, conversion efficiency and observed morphology,”
Optic. Comm., 281
(7), 1823
–1832
(2008). http://dx.doi.org/10.1016/j.optcom.2007.10.040 OPCOB8 0030-4018 Google Scholar
J. MertzL. Moreaux,
“Second-harmonic generation by focused excitation of inhomogeneously distributed scatterers,”
Optic. Comm., 196
(1–6), 325
–330
(2001). http://dx.doi.org/10.1016/S0030-4018(01)01403-1 OPCOB8 0030-4018 Google Scholar
X. Hanet al.,
“Second harmonic properties of tumor collagen: determining the structural relationship between reactive stroma and healthy stroma,”
Optic. Express, 16
(3), 1846
–1859
(2008). http://dx.doi.org/10.1364/OE.16.001846 OPEXFF 1094-4087 Google Scholar
G. Fenhallset al.,
“Breast tumour cell-induced down-regulation of type I collagen mRNA in fibroblasts,”
Br. J. Canc., 81
(7), 1142
–1149
(1999). http://dx.doi.org/10.1038/sj.bjc.6690821 BJCAAI 0007-0920 Google Scholar
G. FalzonS. PearsonR. Murison,
“Analysis of collagen fibre shape changes in breast cancer,”
Phys. Med. Biol., 53
(23), 6641
–6652
(2008). http://dx.doi.org/10.1088/0031-9155/53/23/001 PHMBA7 0031-9155 Google Scholar
M. W. Conklinet al.,
“Aligned collagen is a prognostic signature for survival in human breast carcinoma,”
Am. J. Pathol., 178
(3), 1221
–1232
(2011). http://dx.doi.org/10.1016/j.ajpath.2010.11.076 AJPAA4 0002-9440 Google Scholar
S. P. Taiet al.,
“Optical biopsy of fixed human skin with backward-collected optical harmonics signals,”
Optic. Express, 13
(20), 8231
–8242
(2005). http://dx.doi.org/10.1364/OPEX.13.008231 OPEXFF 1094-4087 Google Scholar
R. M. Williamset al.,
“Strategies for high-resolution imaging of epithelial ovarian cancer by laparoscopic nonlinear microscopy,”
Trans. Oncol., 3
(3), 181
–194
(2010). Google Scholar
N. D. KirkpatrickM. A. BrewerU. Utzinger,
“Endogenous optical biomarkers of ovarian cancer evaluated with multiphoton microscopy,”
Canc. Epidemiol. Biomark. Prev., 16
(10), 2048
–2057
(2007). http://dx.doi.org/10.1158/1055-9965.EPI-07-0009 CEBPE4 1055-9965 Google Scholar
W. Zhenget al.,
“Diagnostic value of nonlinear optical signals from collagen matrix in the detection of epithelial precancer,”
Optic. Lett., 36
(18), 3620
–3622
(2011). http://dx.doi.org/10.1364/OL.36.003620 OPLEDP 0146-9592 Google Scholar
S. Zhuoet al.,
“Quantitatively linking collagen alteration and epithelial tumor progression by second harmonic generation microscopy,”
Appl. Phys. Lett., 96
(21), 213704
(2010). http://dx.doi.org/10.1063/1.3441337 APPLAB 0003-6951 Google Scholar
O. Nadiarnykhet al.,
“Alterations of the extracellular matrix in ovarian cancer studied by second harmonic generation imaging microscopy,”
BMC Canc., 10
(1), 94
–107
(2010). http://dx.doi.org/10.1186/1471-2407-10-94 BCMACL 1471-2407 Google Scholar
H. L. Fuet al.,
“A low-cost, portable, and quantitative spectral imaging system for application to biological tissues,”
Optics Express, 18
(12), 12630
–12645
(2010). http://dx.doi.org/10.1364/OE.18.012630 OPEXFF 1094-4087 Google Scholar
O. Nadiarnykhet al.,
“Second harmonic generation imaging microscopy studies of osteogenesis imperfecta,”
J. Bio. Optic., 12
(5), 051805
(2007). http://dx.doi.org/10.1117/1.2799538 JBOPFO 1083-3668 Google Scholar
S. B. EdgeD. R. ByrdC. C. Compton, AJCC Cancer Staging Manual, 7th ed.Springer, Chicago, IL
(2009). Google Scholar
C. A. SchneiderW. S. RasbandK. W Eliceiri,
“NIH image to ImageJ: 25 years of image analysis,”
Nat. Methods, 9 671
–675
(2012). http://dx.doi.org/10.1158/1078-0432.CCR-04-0165 CCREF4 1078-0432 Google Scholar
E. S. Hwanget al.,
“Patterns of chromosomal alterations in breast ductal carcinoma in situ,”
Clin. Canc. Res., 10
(15), 5160
–5167
(2004). http://dx.doi.org/10.1158/1078-0432.CCR-04-0165 CCREF4 1078-0432 Google Scholar
N. Wasifet al.,
“Invasive lobular vs. ductal breast cancer: a stage-matched comparison of outcomes,”
Ann. Surg. Oncol., 17
(7), 1862
–1869
(2010). http://dx.doi.org/10.1245/s10434-010-0953-z 1068-9265 Google Scholar
|
||||||||||||||||||||||||||||||||||||||||||||||||||||||||||||||||||||||||||||||||||||||||||||||||||||||||||||||||||||||||||||||||||||||||||||||||||||||||||||||||||||||||||||||||||||||||||||||||||||||||


