|
|
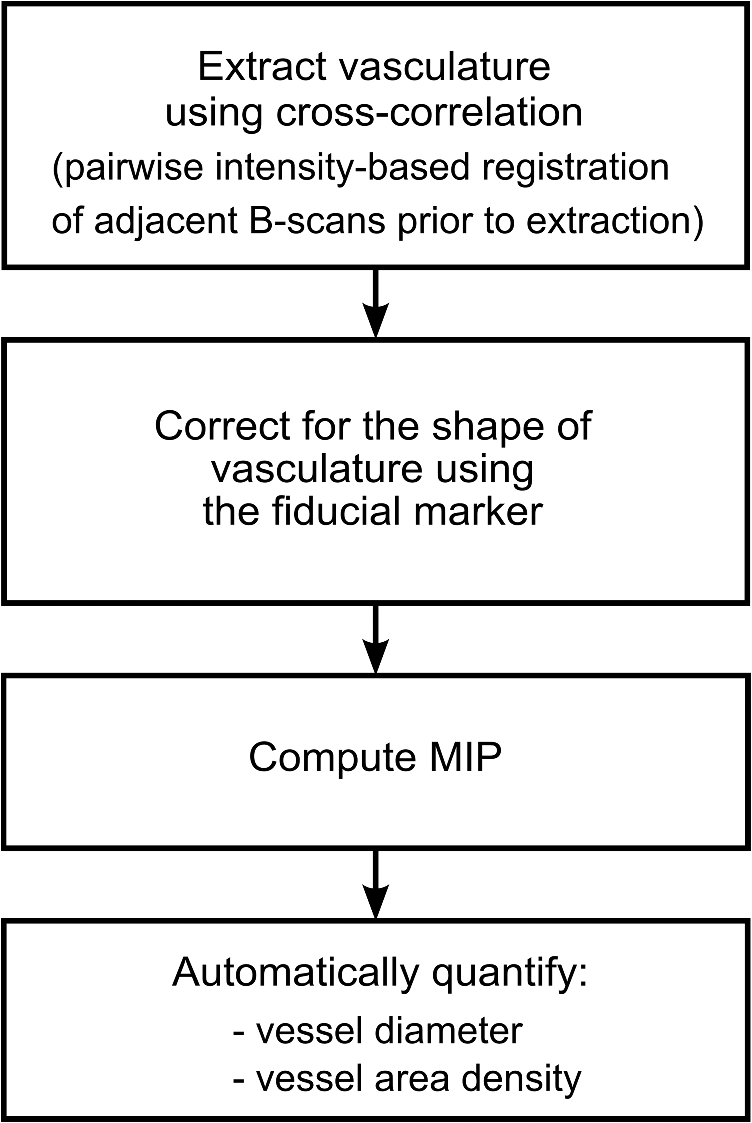
1.IntroductionBurn injury is an important global health issue, with nearly 11 million incidences world-wide of fire-related burn injuries reported annually.1 Burn damage to the skin may also arise from a range of other causes, including contact with hot liquids or surfaces, electricity, radiation, chemicals, and moving surfaces (friction).2 A broad spectrum of scars may result in response to a burn injury. A normotrophic scar is the best clinical endpoint as the scarred tissue assumes similar characteristics (thickness, color, pigmentation, and pliability) to those of the surrounding, unscarred normal skin.3 For some individuals, pathological scar conditions, such as hypertrophic scarring, can develop. A hypertrophic scar is characterized by a high degree of angiogenesis and an over-proliferation of collagen synthesis that is restricted to the original wound margin. It presents clinically as a red, raised, and rigid lesion, which may produce scar contractures (i.e., tightening of tissue) when located over joints.4–6 Hypertrophic scarring is associated with delayed healing of burns7 and occurs in more than 60% of patients.3,6,8 It is a common outcome of a deep dermal burn and occurs within weeks of the injury. This type of scarring often increases in size for three to six months9 and subsequent regression and maturation may take more than two years. Examination of scar progression is important in the early diagnosis and treatment of pathological scarring, and in the assessment of response to treatment. A potent clinical indicator is the redness of the scar, which is indicative of the degree of angiogenesis.10,11 Angiogenesis occurs initially during the proliferation phase of the wound healing process and may continue long after wound closure. A red scar has a higher risk of becoming hypertrophic than a pale scar.10 Regression of vascularity is expected toward scar maturity with notable reduction of redness, becoming comparable to the surrounding normal skin.12,13 Visual assessment of color is a standard clinical approach to rate scar vascularity, and is used in protocols such as the Vancouver Scar Scale.14,15 However, the unaided visual assessment of scar redness can be highly subjective, with limited sensitivity and significant inter-observer variability. Previous attempts to objectively quantify scar vascularity have been performed within histological studies,16–19 although the invasive nature of histological analysis precludes its use in longitudinal assessments. Several noninvasive techniques to measure scar vascularity have been investigated. These include the use of a reflectance meter to measure the erythema index of scars11 and photography or videography to record scar color.10 Video capillaroscopy has been used to evaluate the differences in the vasculature of hypertrophic scars and healthy skin.20 It acquires image data with high resolution but is limited to extremely superficial vessels (within ).21 Laser Doppler flowmetry (LDF) has been used to noninvasively measure blood flow at a single point in a hypertrophic scar.22,23 Laser Doppler perfusion imaging (LDI)24 and laser speckle perfusion imaging (LSPI)25 extend the point measurement of LDF into two-dimensional (2-D) en face perfusion imaging. Although these techniques provide insight into the overall level of perfusion in a scar, they are unable to provide a depth-resolved perfusion map. With the exception of video capillaroscopy, these noninvasive techniques lack the micrometer-scale resolution required to distinguish individual capillary vessels and, therefore, are unable to resolve the microvasculature in tissue. Optical coherence tomography (OCT)26 is a noninvasive, micrometer-resolution three-dimensional (3-D) tomographic imaging technique for in vivo tissue imaging. The capability of OCT for depth-resolved, microvasculature mapping has been demonstrated in previous in vivo studies of normal and psoriatic human skin.27–30 It has also been applied to in vivo vasculature mapping in the human eye31–33 and oral tissues.34 Vasculature contrast in OCT is realized through the endogenous scattering properties of moving blood cells without the requirement of exogenous contrast agents. Several vasculature extraction techniques have been developed for 3-D OCT imaging, including methods based on the Doppler shift (such as phase-resolved Doppler OCT,35 optical microangiography,30 and Doppler standard deviation36) and based on speckle temporal dynamics (such as correlation mapping,27 speckle variance,37 and spatial speckle frequencies).38 The choice of method is dependent upon the phase stability of the OCT system, and whether quantitative flow information is required. The aim of the study reported here was to investigate the utility of OCT for clinical assessment of human cutaneous burn scars as a complement to visual assessment. We describe novel techniques to automatically quantify vessel diameter and density, and illustrate the methodology through a series of case studies, comparing a variety of scar tissues against contralateral or adjacent normal tissues. The results constitute the first in vivo, noninvasive automated quantification of scar vascularity using OCT. We show that the use of these techniques enables 3-D OCT imaging to be used as a means of objective assessment of scar vascularity. 2.Materials and Methods2.1.Imaging SystemImaging was performed with a fiber-based swept-source polarization-sensitive OCT system (PSOCT-1300, Thorlabs), comprising a broadband swept-source laser and a Michelson interferometer with balanced detection. The laser source has a central wavelength of 1325 nm and the average optical power of the probing beam incident on the skin is 3.2 mW. The measured full width at half maximum (FWHM) axial resolution is 17 μm in free space and the lateral resolution is 16 μm. The working distance and numerical aperture of the objective lens are 25.1 mm and 0.056, respectively. The system was operated at an axial scan rate of 5.4 kHz. The sample arm was terminated in an imaging head mounted on an articulating arm [Fig. 1(a)]. An adjustable sample spacer was affixed to the imaging head to enable a constant distance between the objective lens and the skin to be maintained. This spacer had an 18 mm diameter hole and a grooved base to attach a glass cover slip (), which was used as a window for imaging the scar through a layer of ultrasound gel [Fig. 1(b)]. The use of ultrasound gel for refractive index matching has been shown to reduce a range of morphological and intensity artifacts common in OCT imaging of skin.39 2.2.Clinical Image AcquisitionThe clinical protocol was approved by the Human Research Ethics Committee of Royal Perth Hospital and The University of Western Australia. In total, eight patients (four male and four female, Caucasian, mean age: 32 years) were enrolled with prior informed consent. Patients were undergoing follow-up examination of burn scars. Prior to imaging, any hair on the area to be imaged was trimmed using an electric shaver to avoid shadowing artifacts in the OCT scans. To enable removal of motion artifacts, a small metal fiducial marker was adhered securely to the scar using double-sided adhesive tape, as described in Ref. 40. The marker is a 1-cm square brass shim (thickness: 170 μm) with a 3-mm diameter hole in its center through which the scar was scanned [Fig. 1(b)]. For each patient, scarred skin and normal unscarred skin (at a site adjacent or contralateral to the scar) were scanned. Each 3-D OCT scan was () in size and consisted of , where and represent the lateral dimensions, and the axial depth dimension. To reduce the intensity of detected specular back reflections, the axis of the scanning beam was tilted at to the surface normal of the marker and glass cover slip. The OCT beam focus was set at below the scar surface (in physical distance) for optimal subsurface imaging. The B-scan acquisition time was , and the acquisition time for a 3-D volume was 40 s. 2.3.Data Post-Processing2.3.1.Segmentation of vascular networkThe vascular network was segmented from the 3-D OCT scan using speckle decorrelation, based on the algorithm presented by Enfield et al.27 A linear intensity volume was produced by adding the squared magnitude of the data from the two detection channels of the OCT system. The segmentation algorithm then involves computing a correlation map between each pair of adjacent B-scans. Correlation coefficients, , were computed using the standard normalized cross-correlation equation [Eq. (1)]: where the window size is defined by a grid of , and and are a pair of neighboring subimages in adjacent B-scans in an OCT linear intensity volume, which are defined by the window. and are the mean values of the subimages and , respectively. Correlation values lie in the range [, 1]. A window of () was empirically chosen for our system, and the computation was performed for each pair of adjacent B-scans in the 3-D OCT scan to yield a 3-D correlation map. Small absolute values of correlation reflect rapid speckle decorrelation, indicative of blood flow. Large positive correlation values indicate stationary tissue. In areas with low backscatter, there is a poor signal-to-noise ratio (SNR) and both stationary tissue and moving blood will exhibit rapidly decorrelating speckle. To reduce this confounding effect, the 3-D correlation map values were weighted by the OCT signal intensity. Specifically, correlation map values were inverted (, ) and then weighted with the median filtered, log-intensity back-scatter values. This reduced the estimated decorrelation in areas with low SNR.To reduce decorrelation due to tissue bulk motion, each pair of adjacent B-scans was aligned using a cross-correlation intensity-based registration algorithm prior to calculation of the correlation map. After calculation, the shape of the vessels was corrected using a fiducial marker-based registration algorithm. Both registration algorithms have been described in Ref. 40. Vessel visualization was performed using a 2-D en face maximum intensity projection (MIP) image calculated from the 3-D correlation map. First, the surface of the tissue was automatically extracted using a Canny edge detector.41 The MIP was generated over the plane, including data to a physical depth of below the skin surface. Depth measurements were corrected assuming an average group refractive index of skin of 1.43 (Ref. 42) at a wavelength of 1325 nm. In addition, a 2-D depth-encoded en face vessel image was produced by thresholding the correlation values and color-coding vessel pixels by their depth. Automatic quantification of vessel diameter and area density was performed on the MIP image, as detailed in Sec. 2.3.2. The flow of data post-processing is summarized in Fig. 2. 2.3.2.Automatic quantification of blood vessel diameter and area densityTo measure blood vessel diameter, the MIP of the 3-D correlation map was thresholded and skeletonized.43 The branch points (i.e., bifurcation points) of the skeleton were subsequently identified and eliminated. This step decomposed the vasculature skeleton into distinct vessel segments, with the skeleton points marking the center line of each section of vessel. At each skeleton point, the orientation of the vessel was calculated by finding the line of best fit to skeleton points within a small circular neighborhood. The vessel diameter at each point was estimated by tracing a line perpendicular to the vessel orientation, identifying the edges of the vessel by the rapid increase in speckle correlation. An example illustrating the process is shown in Fig. 3. In OCT, blood flow will cause speckle decorrelation at all subsequent axial depths in an A-scan. For this reason, superficial vessels may occlude deeper vessels and vessels which cross at different depths will appear to intersect. To reduce the impact on the quantification, we computed two MIPs: the first extending from the tissue surface to an empirically chosen physical depth of 300 μm; and the second extending from 300 to 600 μm. Vessel pixels identified in the shallower MIP were subtracted from those in the deeper MIP. Vessel diameters across both MIPs were calculated and combined. As the distribution of vessel diameters is not symmetric, we report the median diameter instead of the mean. To measure the area density of vessels, each MIP was thresholded to identify locations within the vasculature, with the threshold empirically set to 60% of the mean correlation values present within the tissue region of the MIP (i.e., excluding the fiducial marker). The percentage of total surface area of vasculature per unit area of tissue was then computed as an indicator of vessel density. All computation was implemented in MATLAB (vR2009b, Mathworks, Natick, Massachusetts) on an Intel Quad Core i7@3.07GHz computer. 3.ResultsIn this section, we present four case studies to demonstrate qualitatively and quantitatively the capacity of OCT to measure the differences in vascularity between scar tissue and normal skin. Case Study 1 is shown in Fig. 4: a 5-month-old hypertrophic scar (left column) on the left anterior thigh of a 28-year-old female patient, and the corresponding contralateral healthy skin (right column). This scar was formed after a friction burn, and vascularity was categorized as “red” on the Vancouver Scar Scale (VSS). Note that on the VSS, the degree of vascularity is categorized into one of four classes, in ascending degree: normal, pink, red, and purple. The patient underwent three courses of laser treatment (localized thermal vascular damage) between three and four months after injury to flatten and improve the appearance of the scar. Fig. 4Case Study 1. Photographs of: (a) a 5-month-old hypertrophic scar due to a friction burn on the left anterior thigh; and (b) the contralateral normal skin, showing the square shim outline. The en face MIPs of the 3-D correlation maps of the scar and normal skin over a depth of from the tissue surface are shown in (c) and (d), respectively. The vasculature from (c) and (d) is color-coded by physical depth (μm), respectively, in (e) and (f). Histograms of blood vessel diameter measurements and the quantified vascular parameters are shown in (g). Scale bar indicates a distance of 0.5 mm.  In each photo, the imaging area is located in the center of a square drawn in ink on the skin surface. En face MIPs of the correlation maps are shown in Fig. 4(c) to 4(f). The latter two have been thresholded and color-coded by depth. Despite laser treatment, an abundant supply of large blood vessels is present in the scar. The histogram in Fig. 4(g) illustrates the frequency of blood vessel diameters in both acquisitions. These distributions appear right-skewed, especially for the scar tissue, leading us to report the median, as foreshadowed in Sec. 2, rather than the mean for each distribution. The median diameter of the blood vessels in this hypertrophic scar was measured to be 44 μm, whereas that of the contralateral normal skin was 23 μm. The area density of vasculature was estimated to be 47% in the scar tissue, corresponding to a increase compared with the vasculature density in the contralateral normal skin (28%). Figure 5 shows Case Study 2, a 12-month-old hypertrophic scar resulting from a scald with hot oil on the left lateral forearm of a 21-year-old male patient. The patient was diagnosed with a deep-partial thickness burn and the scar was graded “red” on the VSS. The patient was treated after injury with ReCell® Spray-On Skin™ and received a split-thickness skin graft. ReCell® Spray-On Skin™ is an autologous epithelial cell suspension cultured from the patient’s own skin.44 A split-thickness skin graft includes the epidermis and part of the dermis obtained from the patient’s own skin.45 During treatment, the skin graft was meshed to cover the entire wound and the cell suspension was applied over this to assist wound healing. Fig. 5Case Study 2. Photographs of: (a) a 12-month-old hypertrophic scar resulting from a scald caused by hot oil on the left lateral forearm; and (b) the contralateral normal skin. En face MIPs of the vasculature over a physical depth of are shown in (c) and (d). The physical depths (μm) of the vessels in (c) and (d) are color-coded, respectively, in (e) and (f). Histograms of blood vessel diameter measurements and other quantification results are shown in (g). Scale bar indicates a distance of 0.5 mm.  The MIPs in Fig. 5(c) to 5(d) show that the hypertrophic scar is more densely infiltrated with large blood vessels compared to the contralateral normal skin. This correlates with the histogram of Fig. 5(g). The color-coded depth image shows that the vessels present in the scar are located at greater depths ( from the surface) than those in the normal skin [Fig. 5(e) to 5(f)]. The median scar vessel diameter is 46 μm, almost twice the 24 μm diameter in normal skin. This corresponds to a similar increase in the vessel density: 45% for scar tissue versus 24% for normal tissue. Figure 6 shows Case Study 3, a 24-month-old, flame burn hypertrophic scar on the right medial thigh of a 20-year-old female patient. The wound was classified as a deep partial-thickness burn. The patient had received treatment comprising ReCell® Spray-On Skin™ and a split-thickness skin graft 20 days after injury. She was subsequently treated with three courses of intralesional injections of corticosteroid to flatten the scar. Corticosteroids are believed to reduce scarring by several mechanisms,46,47 which include mediating vasoconstriction to reduce the supply of nutrients to the scar tissue and activating the endogenous collagenase to break down the scar matrix. The scar color was graded as “red” on the VSS. Fig. 6Case Study 3. (a) Photograph of a 24-month-old hypertrophic scar due to a flame burn on the right medial thigh, and the adjacent scanned normal skin; and (b) and (c) are the en face MIPs of the vasculature in scar tissue and normal skin, respectively. The physical depths (μm) of the vessels in (b) and (c) are color-coded in (d) and (e), respectively. Histograms of blood vessel diameter measurements and other quantification results are shown in (f). Scale bar indicates a distance of 0.5 mm.  Several large vessels are apparent at a superficial depth ( to 150 μm), as seen in Fig. 6(d). Consistent with the other cases, the median vessel diameter in the scar (37 μm) is notably greater than that of the corresponding normal skin (23 μm). Vessel density is also correspondingly greater: 35% in scar tissue versus 19% in normal tissue. Case Study 4, shown in Fig. 7, is a 12-month-old normotrophic scar on the left lateral forearm of a 58-year-old female patient, originating from a flame burn. The scar had been treated with pressure garments and massage, but without surgery. The scar appears hypopigmented but the scar color was rated “normal” on the VSS. Vessels in this scar were found to have a similar diameter to those in normal tissue, although were far more prolific [Fig. 7(b), 7(c)], with a density of 32% in the scar tissue versus 18% in the contralateral normal skin (photograph not shown). Fig. 7Case Study 4. (a) Photograph of a 12-month-old normotrophic scar due to a flame burn on the left lateral forearm. The extent of the scar is outlined in dotted green. The photograph of the contralateral normal skin is not shown. (b) and (c) are the en face MIPs of the vasculature in scar tissue and contralateral normal skin, respectively. The vasculature in (b) and (c) is color-coded by physical depth (μm) in (d) and (e), respectively. Histograms of blood vessel diameter measurements and other quantification results are shown in (f). Scale bar indicates a distance of 0.5 mm.  Table 1 summarizes the results of the quantification of vascular parameters for all eight scar tissue and eight normal skin data sets. Overall, scar tissue showed a 73% increase in vascular density over normal skin (38% vessel area density versus 22%). Combining the median diameter values from all scars, the average of these values is 34 μm, which is larger than the measured vessel diameter in normal skin (23 μm). Table 1Quantification results for all patients (n=8).
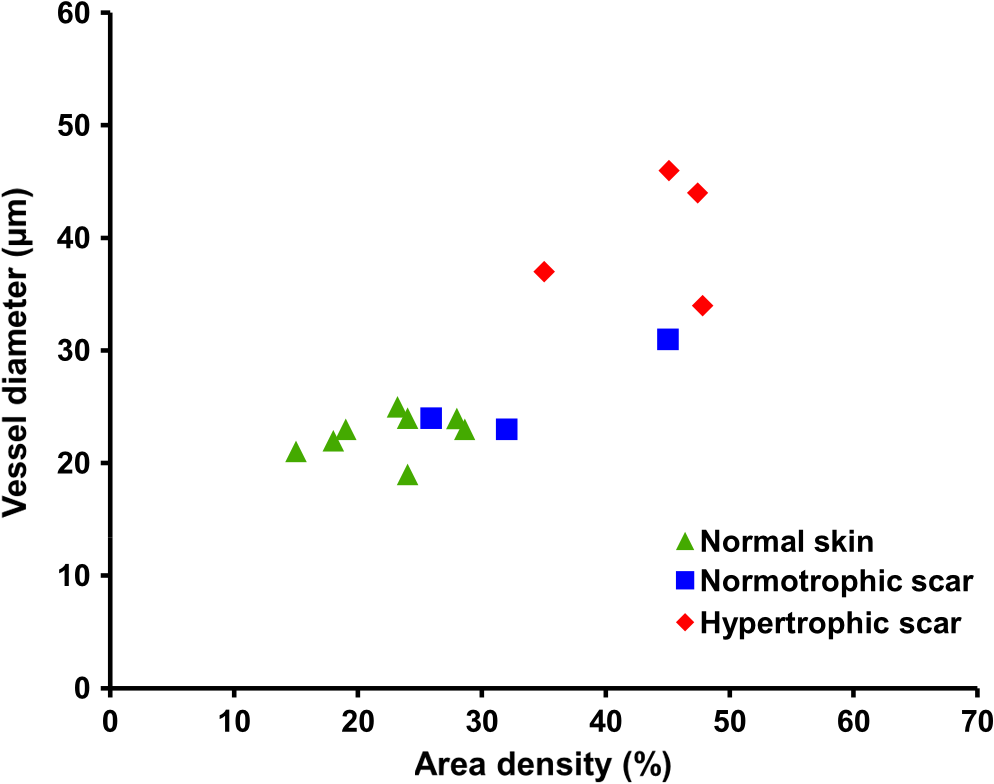
Figure 8 depicts a scatter plot of median vessel diameter versus area density for all data sets. Scars were categorized by a medical clinician as normotrophic or hypertrophic according to appearance and clinical history. One scar data set was excluded from this scatter plot as it was too early (three weeks old) in the scar formation process for the scar to be accurately categorized. Figure 8 suggests a correlation between the clinical assessments and the quantitative vascularity parameters. Our overall finding that the hypertrophic scars exhibited more and larger vessels correlated well with a redder appearance which forms the basis of clinical assessment. 4.DiscussionIn this pilot study, we investigated the feasibility of noninvasively quantifying vascularity in scars to complement subjective clinical assessment as a step toward more evidence-based scar management. We demonstrated that OCT is indeed capable of providing depth-resolved microvasculature maps, which are a prerequisite for the understanding of angiogenesis in scarring. We demonstrated the feasibility of using automated techniques to extract quantitative measures of the vascularity from these maps. Such quantification offers great potential to minimize intra and inter-observer variability in the longitudinal assessment of scar response to treatment. We extracted maps of the vasculature from tissues using a speckle decorrelation technique.27 In this technique, flow regions are extracted based on speckle variations (due to the movement of highly scattering blood cells) which manifest as fluctuations in the intensity of the backscattered OCT signals. As opposed to techniques based on the Doppler shift, flow contrast based on speckle decorrelation does not rely on the phase of the backscattered signal and, therefore, is applicable to systems vulnerable to phase instability, such as swept-source OCT. Although speckle decorrelation does not provide information on the flow velocity and direction, it is Doppler angle independent (i.e., sensitive to both axially and transversely oriented vessels), simple to implement and computationally efficient.27,48 Blood vessels were extracted only up to a physical depth of from tissue surface to avoid the confounding effect of noise at depths with poor SNR. In this study, we observed that scar tissue in general, and hypertrophic scar tissue in particular, has a rich vascularization. Vascular density in scar tissues was found, on average, to be greater than in normal skin. Although normal skin and normotrophic scars are predominantly perfused with fine vasculature (diameter to 30 μm), clinically graded hypertrophic scars included larger vessels () over the physical depth range investigated. The findings of this study are consistent with previous histological studies showing that hypertrophic scars are permeated with a higher density of blood vessels, some of which are enlarged, as compared to normal skin and normal scarring.16,18 Our results also correlate well with earlier studies using laser Doppler flowmetry, which found increased vascularity in hypertrophic scarring.10,11 Thickening of the epidermis, which is believed to be due to acanthosis (i.e., a thickening of the stratum spinosum) in some hypertrophic scarring,49 was observed in some data sets (e.g., Case Study 2) and can be implicated in a corresponding increase in the physical depth of the vasculature [see, e.g., Fig. 5(e)]. Examination of the log-intensity OCT B-scans for this case study showed an epithermal thickness of in the scar tissue, as opposed to in the normal skin. Various management techniques are currently in clinical use for prophylaxis and treatment of hypertrophic scarring. These include surgical excision, intralesional corticosteroid injections, pressure garment therapy,50 silicone gel sheeting, pulsed-dye laser treatments,51 radiotherapy,52,53 and cryotherapy.54,55 Many of these techniques are primarily proven through extensive clinical use, with the effectiveness of only a few of them supported by a prospective study.9 This is, in part, due to the difficulty in objectively quantifying changes of scarring before and after treatments.9,56 Our preliminary study suggests the potential use of OCT to monitor and compare different treatment modalities in such a longitudinal prospective study. A particular potential use of OCT vasculature imaging is in guidance for pulsed-dye laser treatment.51 This treatment improves the appearance of scars by reducing erythema using localized injury of microvessels. Laser treatment of hypertrophic scarring was previously postulated to alter the scar remodeling process by causing tissue ischemia and hypoxia, the release of cytokines, and a reduction in mast cell degranulation.51 Previous studies57 demonstrated the promising use of OCT to guide laser treatment of human port wine stain, a congenital disease characterized by capillary dilation and malformation in the upper dermis. We note that the ability of OCT to quantify vasculature makes it a good candidate imaging modality to guide such treatments in scar tissue. Scars often exhibit regional variation in severity. Within this study, scans were acquired in the severely affected areas of each scar. In clinical practice, multiple acquisitions across the scar would be required during the assessment because of the limited field of view of the OCT system. However, recent improvements in OCT image acquisition rates58 could potentially allow larger scans to be acquired in real-time. 5.ConclusionWe demonstrated the first in vivo clinical assessment of microvasculature in cutaneous burn scars of human patients using OCT. Using novel quantification techniques, vessel diameter, and density were automatically extracted from OCT speckle decorrelation data. Through a series of case studies, our results showed a proliferation of larger vessels in hypertrophic scars when compared against normal contralateral or adjacent skin. These results correlate well with the established pathology of hypertrophic scars.16,18 The average median diameter of the vessels in scars was quantified as 34 μm, compared with 23 μm in normal skin. Scar tissue was also found to be more richly supplied with blood vessels than the normal skin; with an average area density of 38% measured for scars versus 22% for normal skin. The results of this work establish a basis for pathologic scarring to be assessed in larger OCT clinical studies. AcknowledgmentsThe authors gratefully acknowledge the following people who contributed to this study: Ngie Min Ung, Rodney W. Kirk, Andrea Curatolo, Roberta Fornarelli, and Lixin Chin for their help, as well as Nazim Khan from the School of Mathematics and Statistics, UWA, for his advice in statistical analysis. The authors also thank Sharon Rowe at the Telstra Burn Reconstruction and Rehabilitation Unit, Royal Perth Hospital, for her help in patient management. Y. M. Liew is supported by a SIRF and UIS scholarship from The University of Western Australia. R. A. McLaughlin is supported by funding from the Cancer Council Western Australia, and this study is in part supported by the National Breast Cancer Foundation, Australia. P. Gong is supported by The University of Western Australia and the China Scholarship Council. References
“The global burden of disease: 2004 update,”
World Health Organization,
(2004). Google Scholar
“Burn injury model of care,”
W. A. Department of Health,
(2009). Google Scholar
E. N. Gangemiet al.,
“Epidemiology and risk factors for pathologic scarring after burn wounds,”
Arch. Facial Plast. Surg., 10
(2), 93
–102
(2008). http://dx.doi.org/10.1001/archfaci.10.2.93 1521-2491 Google Scholar
L. H. EngravW. L. GarnerE. E. Tredget,
“Hypertrophic scar, wound contraction and hyper-hypopigmentation,”
J. Burn Care Res., 28
(4), 593
–597
(2007). http://dx.doi.org/10.1097/BCR.0B013E318093E482 1559-047X Google Scholar
H. P. Ehrlichet al.,
“Morphological and immunochemical differences between keloid and hypertrophic scar,”
Am. J. Pathol., 145
(1), 105
–113
(1994). AJPAA4 0002-9440 Google Scholar
C. W. P. Li-TsangJ. LauC. C. H. Chan,
“Prevalence of hypertrophic scar formation and its characteristics among the Chinese population,”
Burns, 31
(5), 610
–616
(2005). http://dx.doi.org/10.1016/j.burns.2005.01.022 BURND8 0305-4179 Google Scholar
R. Papini,
“Management of burn injuries of various depths,”
BMJ, 329
(7458), 158
–160
(2004). http://dx.doi.org/10.1136/bmj.329.7458.158 BMJOAE 0007-1447 Google Scholar
K. M. Bombaroet al.,
“What is the prevalence of hypertrophic scarring following burns?,”
Burns, 29
(4), 299
–302
(2003). http://dx.doi.org/10.1016/S0305-4179(03)00067-6 BURND8 0305-4179 Google Scholar
T. A. Mustoeet al.,
“International clinical recommendations on scar management,”
Plast. Reconstr. Surg., 110
(2), 560
–571
(2002). http://dx.doi.org/10.1097/00006534-200208000-00031 PRSUAS 0032-1052 Google Scholar
R. B. DaveyR. T. SprodT. O. Neild,
“Computerised colour: a technique for the assessment of burn scar hypertrophy: a preliminary report,”
Burns, 25
(3), 207
–213
(1999). http://dx.doi.org/10.1016/S0305-4179(98)00137-5 BURND8 0305-4179 Google Scholar
G. V. Oliveiraet al.,
“Objective assessment of burn scar vascularity, erythema, pliability, thickness, and planimetry,”
Dermatol. Surg., 31
(1), 48
–58
(2005). http://dx.doi.org/10.1111/j.1524-4725.2005.31004 DESUFE 1076-0512 Google Scholar
F. ArnoldD. C. West,
“Angiogenesis in wound healing,”
Pharmacol. Ther., 52
(3), 407
–422
(1991). http://dx.doi.org/10.1016/0163-7258(91)90034-J PHTHDT 0163-7258 Google Scholar
J. S. Bondet al.,
“Maturation of the human scar: an observational study,”
Plast. Reconstr. Surg., 121
(5), 1650
–1658
(2008). http://dx.doi.org/10.1097/PRS.0b013e31816a9f6f PRSUAS 0032-1052 Google Scholar
T. Sullivanet al.,
“Rating the burn scar,”
J. Burn Care Res., 11
(3), 256
–260
(1990). http://dx.doi.org/10.1097/00004630-199005000-00014 1559-047X Google Scholar
P. P. M. van Zuijlenet al.,
“Scar assessment tools: implications for current research,”
Plast. Reconstr. Surg., 109
(3), 1108
–1122
(2002). http://dx.doi.org/10.1097/00006534-200203000-00052 PRSUAS 0032-1052 Google Scholar
T. Amadeuet al.,
“Vascularization pattern in hypertrophic scars and keloids: a stereological analysis,”
Pathol. Res. Pract., 199
(7), 469
–473
(2003). http://dx.doi.org/10.1078/0344-0338-00447 PARPDS Google Scholar
N. KurokawaK. UedaM. Tsuji,
“Study of microvascular structure in keloid and hypertrophic scars: density of microvessels and the efficacy of three-dimensional vascular imaging,”
J. Plast. Surg. Hand Surg., 44
(6), 272
–277
(2010). http://dx.doi.org/10.3109/2000656X.2010.532923 2000-656X Google Scholar
W. M. van der Veeret al.,
“Time course of the angiogenic response during normotrophic and hypertrophic scar formation in humans,”
Wound Repair Regen., 19
(3), 292
–301
(2011). http://dx.doi.org/10.1111/j.1524-475X.2011.00692.x WREREU 1067-1927 Google Scholar
T. W. Beeret al.,
“Angiogenesis in pathological and surgical scars,”
Human Pathol., 29
(11), 1273
–1278
(1998). http://dx.doi.org/10.1016/S0046-8177(98)90256-8 HPCQA4 0046-8177 Google Scholar
E. N. GangemiR. CarninoM. Stella,
“Videocapillaroscopy in postburn scars: In vivo analysis of the microcirculation,”
Burns, 36
(6), 799
–805
(2010). http://dx.doi.org/10.1016/j.burns.2010.02.002 BURND8 0305-4179 Google Scholar
M. J. Leahyet al.,
“Biophotonic methods in microcirculation imaging,”
Med. Laser Appl., 22
(2), 105
–126
(2007). http://dx.doi.org/10.1016/j.mla.2007.06.003 1615-1615 Google Scholar
J. A. Clarket al.,
“The hypertrophic scar and microcirculation properties,”
Burns, 22
(6), 447
–450
(1996). http://dx.doi.org/10.1016/0305-4179(95)00166-2 BURND8 0305-4179 Google Scholar
H. P. EhrlichS. F. Kelley,
“Hypertrophic scar: an interruption in the remodeling of repair—a laser Doppler blood flow study,”
Plast. Reconstr. Surg., 90
(6), 993
–998
(1992). http://dx.doi.org/10.1097/00006534-199212000-00009 PRSUAS 0032-1052 Google Scholar
R. Brayet al.,
“Laser Doppler imaging of burn scars: a comparison of wavelength and scanning methods,”
Burns, 29
(3), 199
–206
(2003). http://dx.doi.org/10.1016/S0305-4179(02)00307-8 BURND8 0305-4179 Google Scholar
C. J. Stewartet al.,
“A comparison of two laser-based methods for determination of burn scar perfusion: laser Doppler versus laser speckle imaging,”
Burns, 31
(6), 744
–752
(2005). http://dx.doi.org/10.1016/j.burns.2005.04.004 BURND8 0305-4179 Google Scholar
J. Welzelet al.,
“Optical coherence tomography of the human skin,”
J. Am. Acad. Dermatol., 37
(6), 958
–963
(1997). http://dx.doi.org/10.1016/S0190-9622(97)70072-0 JAADDB 0190-9622 Google Scholar
J. EnfieldE. JonathanM. Leahy,
“In vivo imaging of the microcirculation of the volar forearm using correlation mapping optical coherence tomography (cmOCT),”
Biomed. Opt. Express, 2
(5), 1184
–1193
(2011). http://dx.doi.org/10.1364/BOE.2.001184 BOEICL 2156-7085 Google Scholar
G. Liuet al.,
“High-resolution imaging of microvasculature in human skin in-vivo with optical coherence tomography,”
Opt. Express, 20
(7), 7694
–7705
(2012). http://dx.doi.org/10.1364/OE.20.007694 OPEXFF 1094-4087 Google Scholar
L. AnJ. QinR. K. Wang,
“Ultrahigh sensitive optical microangiography for in vivo imaging of microcirculations within human skin tissue beds,”
Opt. Express, 18
(8), 8220
–8228
(2010). http://dx.doi.org/10.1364/OE.18.008220 OPEXFF 1094-4087 Google Scholar
J. Qinet al.,
“In vivo volumetric imaging of microcirculation within human skin under psoriatic conditions using optical microangiography,”
Lasers Surg. Med., 43
(2), 122
–129
(2011). http://dx.doi.org/10.1002/lsm.v43.2 LSMEDI 0196-8092 Google Scholar
D. Y. Kimet al.,
“In vivo volumetric imaging of human retinal circulation with phase-variance optical coherence tomography,”
Biomed. Opt. Express, 2
(6), 1504
–1513
(2011). http://dx.doi.org/10.1364/BOE.2.001504 BOEICL 2156-7085 Google Scholar
Y. K. TaoK. M. KennedyJ. A. Izatt,
“Velocity-resolved 3D retinal microvessel imaging using single-pass flow imaging spectral domain optical coherence tomography,”
Opt. Express, 17
(5), 4177
–4188
(2009). http://dx.doi.org/10.1364/OE.17.004177 OPEXFF 1094-4087 Google Scholar
G. Liuet al.,
“Real-time bulk-motion-correction free Doppler variance optical coherence tomography for choroidal capillary vasculature imaging,”
Opt. Express, 19
(4), 3657
–3666
(2011). http://dx.doi.org/10.1364/OE.19.003657 OPEXFF 1094-4087 Google Scholar
B. Davoudiet al.,
“Noninvasive in vivo structural and vascular imaging of human oral tissues with spectral domain optical coherence tomography,”
Biomed. Opt. Express, 3
(5), 826
–839
(2012). http://dx.doi.org/10.1364/BOE.3.000826 BOEICL 2156-7085 Google Scholar
B. Vakocet al.,
“Phase-resolved optical frequency domain imaging,”
Opt. Express, 13
(14), 5483
–5493
(2005). http://dx.doi.org/10.1364/OPEX.13.005483 OPEXFF 1094-4087 Google Scholar
Y. Zhaoet al.,
“Doppler standard deviation imaging for clinical monitoring of in vivo human skin blood flow,”
Opt. Lett., 25
(18), 1358
–1360
(2000). http://dx.doi.org/10.1364/OL.25.001358 OPLEDP 0146-9592 Google Scholar
A. Mariampillaiet al.,
“Optimized speckle variance OCT imaging of microvasculature,”
Opt. Lett., 35
(8), 1257
–1259
(2010). http://dx.doi.org/10.1364/OL.35.001257 OPLEDP 0146-9592 Google Scholar
J. BartonS. Stromski,
“Flow measurement without phase information in optical coherence tomography images,”
Opt. Express, 13
(14), 5234
–5239
(2005). http://dx.doi.org/10.1364/OPEX.13.005234 OPEXFF 1094-4087 Google Scholar
Y. M. Liewet al.,
“Reduction of image artifacts in three-dimensional optical coherence tomography of skin in vivo,”
J. Biomed. Opt., 16
(11), 116018
(2011). http://dx.doi.org/10.1117/1.3652710 JBOPFO 1083-3668 Google Scholar
Y. M. Liewet al.,
“Motion correction of in vivo three-dimensional optical coherence tomography of human skin using a fiducial marker,”
Biomed. Opt. Express, 3
(8), 1774
–1786
(2012). http://dx.doi.org/10.1364/BOE.3.001774 BOEICL 2156-7085 Google Scholar
J. Canny,
“A computational approach to edge detection,”
IEEE Trans. Pattern Anal. Mach. Intell., PAMI-8
(6), 679
–698
(1986). http://dx.doi.org/10.1109/TPAMI.1986.4767851 ITPIDJ 0162-8828 Google Scholar
T. Gambichleret al.,
“In vivo data of epidermal thickness evaluated by optical coherence tomography: effects of age, gender, skin type, and anatomic site,”
J. Dermatol. Sci., 44
(3), 145
–152
(2006). http://dx.doi.org/10.1016/j.jdermsci.2006.09.008 JDSCEI 0923-1811 Google Scholar
R. OgniewiczM. Ilg,
“Voronoi skeletons: theory and applications,”
in Proc. IEEE Conf. Computer Vision and Pattern Recognition,
63
–69
(1992). Google Scholar
F. M. WoodM. L. KolybabaP. Allen,
“The use of cultured epithelial autograft in the treatment of major burn wounds: eleven years of clinical experience,”
Burns, 32
(5), 538
–544
(2006). http://dx.doi.org/10.1016/j.burns.2006.02.025 BURND8 0305-4179 Google Scholar
J. F. ThorntonA. A. Gosman,
“Skin grafts and skin substitutes and principles of flaps,”
Sel. Readings Plast. Surg., 10
(1), 1
–23
(2004). SACLA5 0370-8179 Google Scholar
M. C. T. Bloemenet al.,
“Prevention and curative management of hypertrophic scar formation,”
Burns, 35
(4), 463
–475
(2009). http://dx.doi.org/10.1016/j.burns.2008.07.016 BURND8 0305-4179 Google Scholar
C. TziotziosC. ProfyrisJ. Sterling,
“Cutaneous scarring: Pathophysiology, molecular mechanisms, and scar reduction therapeutics: part II strategies. to reduce scar formation after dermatologic procedures,”
J. Am. Acad. Dermatol., 66
(1), 13
–24
(2012). http://dx.doi.org/10.1016/j.jaad.2011.08.035 JAADDB 0190-9622 Google Scholar
E. JonathanJ. EnfieldM. J. Leahy,
“Correlation mapping method for generating microcirculation morphology from optical coherence tomography (OCT) intensity images,”
J. Biophotonics, 4
(9), 583
–587
(2011). http://dx.doi.org/10.1002/jbio.201000103 JBOIBX 1864-063X Google Scholar
M. P. Andriessenet al.,
“Hypertrophic scarring is associated with epidermal abnormalities: an immunohistochemical study,”
J. Pathol., 186
(2), 192
–200
(1998). http://dx.doi.org/10.1002/(ISSN)1096-9896 JPTLAS 0022-3417 Google Scholar
E. Van den Kerckhoveet al.,
“The assessment of erythema and thickness on burn related scars during pressure garment therapy as a preventive measure for hypertrophic scarring,”
Burns, 31
(6), 696
–702
(2005). http://dx.doi.org/10.1016/j.burns.2005.04.014 BURND8 0305-4179 Google Scholar
K. P. Allisonet al.,
“Pulsed dye laser treatment of burn scars: alleviation or irritation?,”
Burns, 29
(3), 207
–213
(2003). http://dx.doi.org/10.1016/S0305-4179(02)00280-2 BURND8 0305-4179 Google Scholar
B. Guixet al.,
“Treatment of keloids by high-dose-rate brachytherapy: a seven-year study,”
Int. J. Radiat. Oncol. Biol. Phys., 50
(1), 167
–172
(2001). http://dx.doi.org/10.1016/S0360-3016(00)01563-7 IOBPD3 0360-3016 Google Scholar
R. Ogawaet al.,
“Postoperative electron-beam irradiation therapy for keloids and hypertrophic scars: retrospective study of 147 cases followed for more than 18 months,”
Plast. Reconstr. Surg., 111
(2), 547
–553
(2003). http://dx.doi.org/10.1097/01.PRS.0000040466.55214.35 PRSUAS 0032-1052 Google Scholar
C. C. Zoubouliset al.,
“Outcomes of cryosurgery in keloids and hypertrophic scars: a prospective consecutive trial of case series,”
Arch. Dermatol., 129
(9), 1146
–1151
(1993). http://dx.doi.org/10.1001/archderm.1993.01680300074011 ARDEAC 0003-987X Google Scholar
L. RuscianiG. RossiR. Bono,
“Use of cryotherapy in the treatment of keloids,”
J. Dermatol. Surg. Oncol., 19
(6), 529
–534
(1993). 0148-0812 Google Scholar
G. G. Gauglitzet al.,
“Hypertrophic scarring and keloids: pathomechanisms and current and emerging treatment strategies,”
Mol. Med., 17
(1–2), 113
–125
(2011). http://dx.doi.org/10.2119/molmed.2009.00153 MOMEE2 0268-2680 Google Scholar
J. S. Nelsonet al.,
“Imaging blood flow in human port-wine stain in situ and in real time using optical Doppler tomography,”
Arch. Dermatol., 137
(6), 741
–744
(2001). ARDEAC 0003-987X Google Scholar
W. Wieseret al.,
“Multi-megahertz OCT: high quality 3D imaging at 20 million A-scans and 4.5 GVoxels per second,”
Opt. Express, 18
(14), 14685
–14704
(2010). http://dx.doi.org/10.1364/OE.18.014685 OPEXFF 1094-4087 Google Scholar
|