
|
|
1.IntroductionLight is a powerful tool for visualization and analysis of biological systems. However, the use of linear optical methods in biological studies has often had limited effectiveness. To be specific, in one-photon fluorescence microscopy, specimen photodamage, low signal-to-noise ratio caused by intrinsic scattering, and diffraction-limited resolution have constrained the range of biological problems that can be studied.1,2 To overcome some of these issues, label-free imaging modalities that have distinct advantages in tissue imaging, such as increased imaging depths, were developed. The inherent drawbacks of conventional single-photon fluorescence microscopy have spurred improvement of instrumentation for biomedical diagnostics and therapeutics.3–6 While confocal fluorescence microscopy provides axially discriminated sectioning of biological tissues, issues associated with specimen photodamage and the lack of enhanced imaging depths were alleviated by the application of near-infrared (NIR), ultrafast, femtosecond (fs) lasers. The reduced tissue absorption and photochemical action of NIR light allows greater imaging depths to be achieved and provides additional experimental capability by the use of nonlinear optical processes. Specifically, fs, NIR laser-induced nonlinear optical processes have proven viable imaging techniques for extracting contrast-specific signature of biological structures, such as molecular arrays of myosin, collagen, and lipid, allowing investigation of tissue structure and its organization as well as physiopathology of tissues at the cellular and molecular levels.7–9 Since nonlinear optical processes can be registered with excitation intensity in the range of to ,10,11 such stringent requirements for photon flux limit excitation as well as the fluorescent signal collection to the focal volume and provides corresponding lateral and axial resolutions of around 220 and 520 nm, respectively, when focusing a 900-nm laser beam with a 1.2 numerical aperture objective lens.12 To further improve contrast and sensitivity, laser-scanning multiphoton excitation fluorescence microscopy (LS-MPFM) has been combined with other optical modalities such as life-time imaging13 and phase-contrast microscopy.14 Although MPFM enables in vivo live-animal modeling as well as clinical trials and yields a great wealth of insights into intricate structures, dynamic events, and interactive functions with significantly reduced photodamage, a majority of applications still require excitation of fluorescent species such as dye molecules, fluorescent nanocrystals, and beads.15,16 Unlike multiphoton fluorescence excitation, which requires molecular electronic transition, second harmonic generation (SHG) involves a virtual interaction that converts two photons into a frequency-doubled photon with equivalent energy. The use of SHG is a complementary contrast mechanism for tissue imaging, and it has proven effective in imaging noncentrosymmetric biological structures such as arrays of collagen molecules.17–19 Moreover, development of SHG intensity-based techniques, such as integration with fluorescence lifetime imaging20 and polarization-resolved SHG microscopy,21 has evolved into versatile imaging systems. In an effort to elucidate morphological changes of biological tissues and their associated functions, induced second harmonic radiation in response to polarized laser beams has emerged as a useful modality.22 Stoller et al. demonstrated for the first time pixel-level second-order susceptibility tensor -based SHG imaging on the rat tendon, porcine cornea, and bovine tendon fascia with automated rotation of the linear polarization of the laser and a lock-in amplifier for SHG signal registration, and they successfully revealed structural orientation mapping of the collagen fibril.23 As an additional contrast parameter for imaging purposes, has also been used for differentiating biological structures and imaging of pathological tissues.24,25 Additionally, pixel-resolved has been utilized as a quantitative imaging tool for characterizing axonemes obtained from sea urchin sperm and for identifying SHG sources in primary cortex neurons and amylopectin in starch. Other relevant techniques, such as spectral moment invariants analysis of polarization-modulated SHG images, have been implemented for quantifying textures of tissue and their disorders.26 In this work, we focus on the review of second-order susceptibility microscopy (SOSM) along with pixel-level analysis for tissue imaging. In the context of this review, both the principles and technical basis of SOSM are described, followed by a discussion of applications of SOSM in imaging of normal and pathological tissues. We conclude with future prospects and potential in clinical diagnostics. 2.Background of Second Harmonic Generation2.1.Basis of SHG Origin in Biological MediaSecond-order nonlinear polarization of dielectric material effectively occurs when electromagnetic radiation with an oscillating electric field strength greater than interacts with noncentrosymmetric media.27 In general, electromagnetic radiation-induced polarization of material system can be expressed as where , , and are, respectively, first-, second-, and third-order susceptibilities, is the strength of electric field, and is the frequency. The nonlinear nature of SHG radiation sets a strict requirement for the medium to be noncentrosymmetric.28 SHG was detected in quartz crystal shortly after the invention of a pulsed ruby laser operating at 694 nm.27 Since then, the use of highly intense pulses has brought unprecedented advances in areas such as biological and biomedical sciences. The first observation of SHG stemming from biological tissues dates back in 1971, when collagen-rich Achilles tendons, scleras, and corneas of rabbits and dogs rendered a narrowband emission at 347 nm with irradiation of a Q-switched ruby laser at a wavelength of 694 nm.29 The scheme of scanning SHG microscopy for investigating nonlinear crystals was proposed and built in 1978, which set an important stage for its use in biological applications.30 A number of biological materials, such as cartilage, tendons, myosin-rich striated muscle, crystallized microtubules of mitotic spindles, and plant chloroplast, have been found capable of generating the second harmonic signal.31–36 Thus, the identification of SHG sources within biological media is of primary importance for its further application in studies of the characteristics of biological organisms. The basis of SHG can be explained from molecular hyperpolarizability ,19 given asThis formula accounts for the transition frequency , the oscillator strength derived from an integral of absorption spectrum , the and change in dipole moment of ground and excited states, in which is the constant of electric charge and is the Planck constant. Macroscopic second-order susceptibility is proportionally related to ,19 as shown in the following expression: where is the spatial density of molecules and the bracketed denotes the orientation average of molecules, indicating the requirement of a noncentrosymmetric environment for optical second-order nonlinear process. Experimentally, second harmonic radiation can be induced by the impingement of fs pulses upon nonlinear media and is scaled19 as where and are the excitation intensity and pulse duration of the fs laser pulse, respectively. Integration of Eqs. (3) and (4) shows that SHG intensity is quadratically proportional to concentration of molecules which act as individual dipole antenna. The SHG signal rendered from the use of high-intensity fs pulses upon nonlinear media have brought advances in the diagnostics of tissue structure rich in collagen and myosin.8,21,28Since 1986, the application of scanning second harmonic microscopy has revealed polarization of filamentous, columnar structures of collagen fibril in native rat tail tendons, which exhibit the directionality that permeate the tendon cross-section.37 Since then, SHG microscopy, a complementary, structure-sensitive tool to MPFM, has found enormous usefulness in optical tissue biopsy and reconstruction of intact structure of mammalian tissues, as well as in the study of local cellular membrane morphology and its dynamics, which were previously unattainable with conventional histology.38–40 A mixture of type I and V collagen emulating the state of human breast cancer has been quantifiably diagnosed with SHG intensity measurement, which deceases in parallel with an increase in the content of Col V; mixture with lower Col V is also characterized by longer fibers and a higher emission ratio of Forward SHG to Backward SHG FSHG/BSHG.41 A similar investigation on breast cancer using SHG microscopy also clarified the relationship between collagen density and carcinogenesis. In that investigation, three tumor-associated collagen signatures were observed and defined based on density, shape, and orientation of collagen fibers, which may provide novel markers for locating and characterizing tumors.42 Another study concerning ovarian cancer used the integration of three-dimensional (3D) SHG intensity and bulk optical measurements, as well as Monte Carlo simulations, to investigate the remodeling of structure of ovarian extracellular matrix in a cancerous state. This study revealed lower cell density, denser collagen, and higher regularity at both fibril and fiber levels in malignant tissues.43 When used in combination with Monte Carlo simulations or an assessment computation algorithm, SHG microscopy is also capable of identifying the diseased state osteogenesis imperfect, as well as discriminating different collagen types in kidney tissue.44,45 Furthermore, manual and acoustooptical polarization-swept fs light sources can help determine the detailed content within the subsurface of tissues.46,47 Polarization signature of tissues, such as skin and cartilage, has added an additional contrast mechanism to intensity-based investigation and has allowed differentiation of normal and morphologically variant tissues.9,28,48 For instance, variations of collagen fiber organization and orientation in normal cartilage were revealed and differentiated from degenerated cartilage using polarization-sensitive SHG and ratio of intensities of two orthogonally polarization-resolved SHG signals.49 Previously, using polarization-resolved SHG microscopy, Nucciotti et al. assigned a unique value of polarization anisotropy to each physiological/biochemical state of myosin structural conformation, which helped discriminate between attached and detached myosin heads in a contracting intact fiber.50 Polarization-sensitive SHG microscopy has been used to investigate structure and molecular composition of tissues such as corneal stroma and skeletal muscle tissues.51,52 In addition, specific polarization properties of collagen and myosin were distinguished using polarization-selective SHG intensities and their ratios.53,54 Researchers have applied polarization-sensitive SHG measurements to enable second-order susceptibility tensor-based quantification for numerical analysis of biological tissues. To show this quantification approach, Fig. 1 illustrates the relationship of a linearly polarized laser beam with a propagation vector along the -axis and the orientation of collagen fibril , together with the direction of laser polarization , which are defined as relative angles with respect to the vertical -axis on the plane of the -coordinate system. The relative angular difference is used in numerical analysis.55 Under the assumption of cylindrical symmetry, elements of second-harmonic susceptibility tensor reduce to four independent elements.56 With the angular definition of , the induced SHG intensity can be expressed55 as where the and components of induced SHG intensities are functions of , E is the amplitude of the electric field, and the contracted notations , , and are denoted for the description of second-order susceptibility tensor elements. In addition, is an angle between the principle axis and the polarization direction of laser radiation, since fiber orientation was previously shown to be equivalent to the principle axis of second-order susceptibility tensors.8 As a result, the overall polarization-sensitive SHG intensity can be written as a combination of individual components55 shown below:Fig. 1Illustration of laser polarization and fiber orientation in a coordination system. is the angle of fiber orientation relative to the -axis, and is the polarization angle of the electric field vector of an incoming laser with a propagation vector along the -axis.55  Equation (6) can be used to fit the SHG intensity as a function of . As a result, , , fiber orientation , and the overall proportionality constant can be determined. These parameters would then allow the quantitative characterization of noncentrosymmetric biological tissues. For instance, averaged ratios of and were previously determined as a footprint indicating type I collagen of rat tail tendon;57 validity of these ratios is discussed from experimental aspects in the following sections. 3.Applications in Clinics and Basic Sciences3.1.Clinical DermatologySkin, as the outermost protective organ, separates internal soft tissue from external environment and biochemically plays a major role in immunoregulation and maintenance of physiological homeostasis.58 The composition of skin can be divided mainly into three sections: epidermis, dermis, and hypodermis. The basal layer, the deepest layer of epidermis, is essentially composed of basal and other cells and is responsible for the synthesis and division of newly formed keratinocytes, which migrate superficially and form spinous and granular layers in the ascending order of cellular maturity with corneum, a lamina of anucleate cells, residing in the outermost layer. The dermis lies immediately underneath the epidermis and consists of an extracellular matrix containing collagen and elastic fibers. Depending on sections of superficial skin, the thickness of the epidermis and dermis range from 50 to 1,500 μm and 100 to 500 μm, respectively.52 The subcutaneous depth ranges are measurable using optical imaging modalities and have proven to be readily accessible for diagnostic purposes.59 Dermatological science has made significant progress in parallel with advancements in optical microscopy, which have helped resolve cellular and molecular constituents of subcutaneous tissues in applications such as in vivo monitoring of lesions, presurgical illustration of basal cell carcinoma,60 and noninvasive assessment of the skin’s microvascular function61 and related dermatological diseases such as atopic dermatitis.62 While confocal fluorescence microscopy can visualize cellular components of the stratum corneum and discriminate the junction of the dermis and epidermis, upon reflection, multiphoton microscopy capable of probing depths greater than a few hundred microns is inherently more suitable for interrogating physical and biochemical properties of deep tissue.63 At the junction between the dermis and epidermis, the laminar structure of epidermal cells, melanin, elastin, and collagen fibers was observed instantaneously with a combined imaging modality of spectra of autofluorescence (AF) and SHG microscopy.64 A combination of AF and SHG measurements has also proven invaluable in assessing characteristics of skin aging and pathological conditions in vivo.65 In addition, early detection of alterations in the physical and biochemical properties of subcutaneous cellular constituents and structural lamination within human skin biopsy has been demonstrated utilizing an imaging system combining OCT and MPM.66 Change in collagenous structure-induced SHG response has helped discriminate normal derma from basal cell carcinoma and has allowed in vivo, guidance for basal cell carcinoma removal.67 Likewise, merits of second-order susceptibility imaging lie not only in assessment of tissues with polarization-dependent intensities, but also in providing quantification at a pixel-by-pixel level that serves as a metric for differentiating types, composition, and physiopathological states of tissues. Pixel-level analysis of polarization-dependent SHG measurements has successfully revealed structures of different muscle cells of living Caenorhabditis elegans (C. Elegans) nematodes, as well as differentiated fibrillar collagen and skeletal muscle in mammalian tissues.68,69 Additionally, development on 1D Fourier and the gray-level co-occurrence matrix analyzes of polarization-sensitive SHG measurements have helped enhance the contrast of images and increase imaging speed nearly five-fold, respectively.70,71 In our study, molecular origins of SHG sources were quantitatively distinguished in collagen-rich human dermis and the muscle-tendon junction of chicken wings rich in both collagen and myosin using second-order susceptibility imaging.24 Before obtaining second-order susceptibility tensors from human dermis, SHG tensors analysis was performed on the muscle-tendon junction, making sure that results of the imaging technique were valid and capable of discriminating between different SHG origins. Figure 2 shows single-pixel-resolved mapping of the second-order susceptibility tensor ratios and derived from polarization-dependent SHG signal by imaging the muscle-tendon junction of chicken wings. The SHG intensity value of each pixel was taken as an average with eight surrounding pixels for enhancing visual impression by smoothing out color-code transition between pixels before image processing, which does not signify any quantitative manipulation to the original data. The tomography of the tensor ratios and indicates morphological difference between muscle and tendon; tendon is a much stronger SHG emitter than muscle, so image contrast revealed the boundary of the junction. The polarization-dependent SHG intensity at 21 different excitation polarization angles over an angular range of 0 deg to 180 deg were measured to determine , , fiber angle , and the proportionality constant by least-square-fitting of Eq. (6) and construct image maps of and , which are illustrated in Fig. 2(a) and 2(b), respectively. As can be seen from Fig. 2(a), clearly elucidates the contrast between muscle and tendon, whereas such clear distinction is not presented in tomography of . Figure 2(e) delineates the variation of normalized SHG intensity as a function of polarization angle relative to fiber angle for pixels 1 and 2 marked on Fig. 2(a), and error bars were taken over three repeated images. The respective peak values of are (dashed arrow) and (solid arrow) for the muscle and tendon, as shown in Fig. 2(c), which demonstrated the effectiveness of SOSM as an imaging contrast mechanism for differentiating the SHG origin of muscle and tendon. Also, note that the dual-peak profile in the histogram of Fig. 2(c) illustrates clear differences of for muscle and tendon. On the other hand, as with previous results for rat tail tendons, , shown in Fig. 2(d), is not close to 1 and does not show such two-peak distinction. Since Eq. (6) was derived under the assumptions of Kleinman and cylindrical symmetries, which reduce the number of second-order susceptibility tensors, the ratio of is theoretically set to 1 when assumptions are applied to lossless media with the excitation frequencies being far away from absorption frequencies of the media.72 Although the validity of these assumptions was verified by Stoller et al. for the reason that the first electronic transition in collagen (at 310 nm) is far away from the SHG wavelength at 400 nm, other experimental groups have found their results of slightly deviated from theory.23 Both Chu et al. and Plotnikov et al. have made the similar argument that their laser excitation and SHG frequencies were not too far away from the resonant frequency of muscle, which may attribute to a slight deviation from Kleinman symmetry.9,73 Under the context of the assumption discussed here, the affinity of our SHG wavelength (390 nm) to the resonant wavelength of collagen at 350 to 380 nm may well contribute to a slight deviation from Kleinman symmetry. In addition, a wavelength of 900 nm has been used by other experimental groups to excite myosin molecules of mice leg muscles, as well as mice tail tendon fascia and muscle fascia, which render an SHG emission of 450 nm and thus confirm the contribution of SHG resonance to the deviation from Kleinman symmetry.54,74 Another possible explanation for such a ratio deviation is the chirality of collagen, which is known to enhance SHG radiation and thus may vary the ratio contribution accordingly.75,76 Fig. 2Quantitative analysis of second-order susceptibility tensor ratios on the muscle-tendon junction a of chicken wing. Tomography of (a) and (b) are illustrated along with histograms of occurrence count for (c) and (d) . Variation of SHG intensity as a function of relative angle between fiber direction and laser polarization for pixel locations 1 and 2 are shown in (a).24  Following the same analytic procedures, SOSM was used to examine human dermis. Figure 3 shows a second-order susceptibility analysis of polarization-sensitive SHG intensity images. SHG intensity images shown in Fig. 3(a), 3(b), and 3(c) delineate the single-pixel-resolved tomography of polarization-dependent SHG intensity, , and , respectively. The results of immunohistology revealed collagen I as the main component of fibril bundles in human dermis, which is consistent with analysis of second-order susceptibility within the encircled region of Fig. 3(b); the averaged was determined to be . The histogram of is presented in Fig. 3(d), where the first peak value of corresponds to collagen type I, while the second peak value of could be attributed to collagen type III, another major constituent of the dermis. Furthermore, as reported previously, was used for differentiating human dermis under different pathological conditions: keloid, morphea, and dermal elastolysis, which were characterized by peak values of , , and , respectively.25 Fig. 3Second-order susceptibility analysis of SHG images of human dermis. (a) An SHG intensity image. (b) Single-pixel-resolved mapping of . (c) Single-pixel-resolved mapping of . (d) Occurrence count for .24 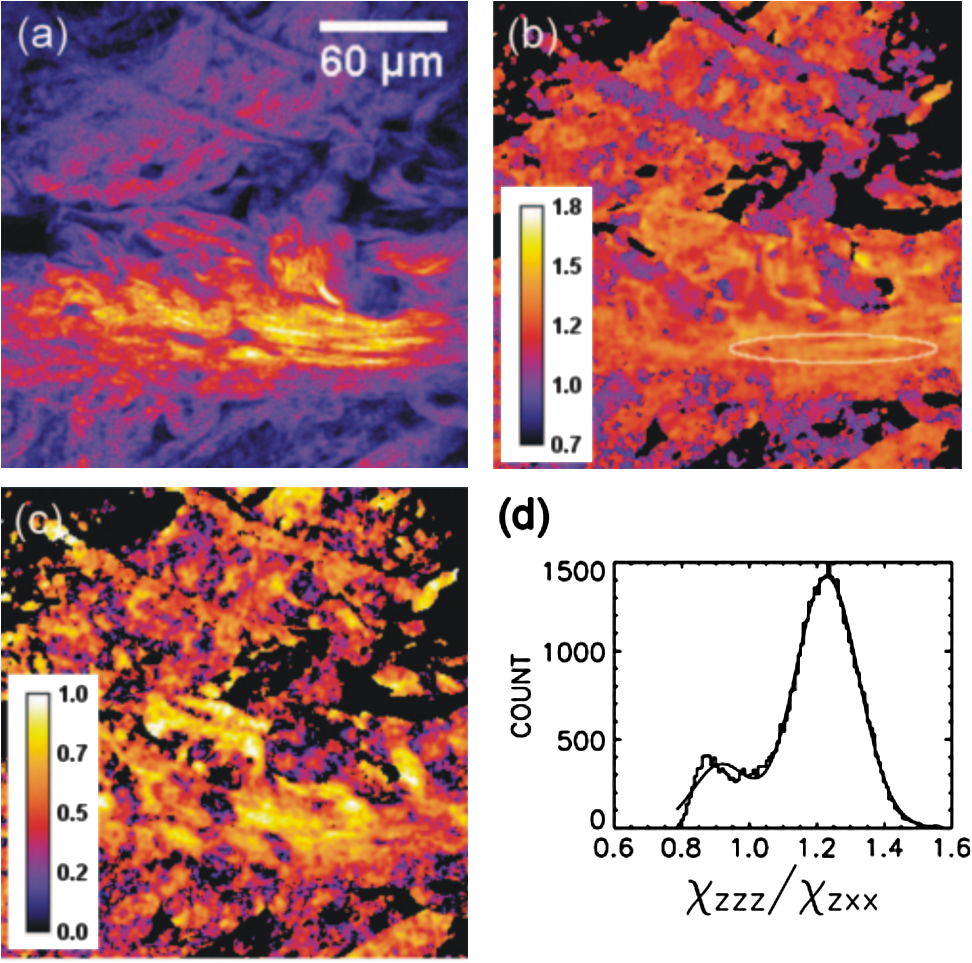 3.2.Basic Studies and Tissue Engineering ApplicationsConnective tissues of a variety of mammalian and amphibian species have been found to be made of different types of collagen.77,78 Fibrillar collagen, such as type I, exhibits SHG radiation attributing to coherent effects of the high-density and quasicrystalline structure of collagen fibril, and it has been explored for intensity-based characterization of tissue properties. Specifically, through the use of polarization-sensitive SHG and MPF measurement, normal and degenerate equine articular cartilage were differentiated, and it was suggested that numerical models are required for quantification of depth-dependent polarization measurement.49 In another study, unraveling endogenously hidden myosin-rich and collagen-rich tissues in amphibian and mammals was achieved.79 Furthermore, polarization-sensitive SHG measurements were used to characterize the orientation angle of myosin in collagen I and collagen III.77 Hyper-Raileigh scattering experiments were carried out, and peptide bonds were found to be the molecular origin of SHG in proteins.80 Using sum-frequency generation vibrational spectroscopy, it was found that molecular SHG also originated from the methylene group associated with Fermi resonance between the fundamental symmetric stretch and the bonding overtone of methylene, and that carbonyl and peptide groups associated with the amide I band are the dominant SHG contributors.81 Our study revealed that the molecular origin of collagen-rendered second-order susceptibility not only is attributed to the peptide groups in the backbone of the collagen -helix but may also be attributed to the methylene groups in the pyrrolidine rings.82 With this work, we demonstrated the visualization and differentiation of different SHG origins, namely, different types of collagen. These results allow the construction of tensor ratio maps. A peptide pitch-angle of and a methylene pitch-angle of for collagen I from rat tail tendons were estimated, which comply with previous results of x-ray diffraction upon collagen-like peptide. Moreover, collagen II from rat trachea cartilage yielded similar results for of , whereas of was slightly different from that of collagen I. Figure 4 shows tomographic images of , , , and for type I and II collagens, with type I on the top row (a-d) and type II on the bottom (e-h). Likewise, the histogram of , , , and for both type I and II collagens is shown in Fig. 5(a) to 5(d). These results demonstrate the capability of SOSM for identifying different molecular origins of SHG radiation. Fig. 4An analysis of second-order susceptibility tensors with collagen I from rat tail tendons and collagen II from rat trachea cartilage. , , , and for collagen I and II are shown on the top row (a-d) and the bottom row (e-h), respectively.82 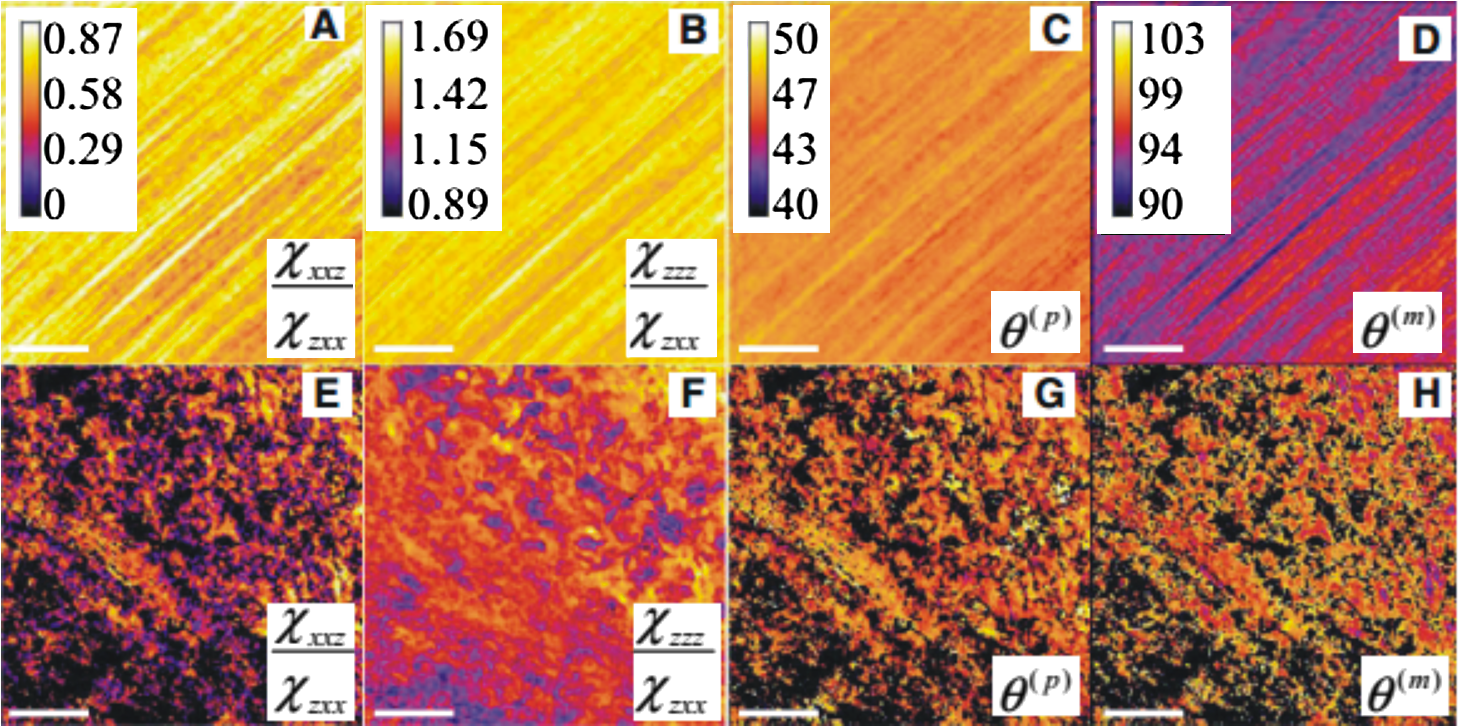 Fig. 5An analysis of second-order susceptibility tensors. Occurrence-count histograms of (a) , (b) , (c) , and (d) for type I and type II collagen, delineating comparison between these types of collagen.82  SOSM imaging has also been used to probe engineered cartilage tissue containing both type I and II collagens; in contrast, native cartilage is mainly composed of type II.57 The results of second-order susceptibility tensor analysis from a polarization-dependent SHG image are shown in Fig. 6(a). Immunochemical staining was performed to confirm the presence of collagen I and II, as shown in Fig. 6(b) and 6(c), respectively. Figure 6(d) and 6(e) are the corresponding images of peptide pitch-angle and mythelene pitch-angle. Second-order susceptibility tensor analysis, performed within the dashed encircled regions of Fig. 6(d) and 6(e) are presented, respectively, in Fig. 6(f) and 6(g), illustrating the histograms of peptide- and mythelene pitch-angles for type I and II collagens. These results are summarized in Fig. 6(h), which shows a table of numerical data for and characterizing type I and II collagens. Clearly, with these results, the validity of SOSM in identifying type I and II collagens in a mixture of engineered cartilage has been verified. Fig. 6An MPM image analysis on the selected region for identifying collagen type I and II in a sample of engineered cartilage. (a) The polarization-dependent MPM image. Immunochemical staining confirms the presence of (b) collagen type I and (c) collagen type II. Tomography of (d) and (e) , along with color bars, illustrate the results of second-order susceptibility analysis and single-pixel-resolution of SOSM images. The encircled regions of (d) and (e) are analyzed for distribution of occurrence counts of (f) and (g) , indicating characteristics of collagen type I and II. (h) The characteristics are tabulated in a table.82  4.DiscussionThe most recent application of polarization-resolved SHG imaging has helped determine orientation mapping of collagen fibril in cornea83 and reveal three thermaldynamic stages in collagen denaturation.84 Moreover, developmental efforts of 3D analysis have been carried out for biological structures, such as inherent crystallinity of amylopectin in starch grain, and orientation mapping for collagen fibril in mammalian tissues such as bovine legs, chicken legs, and chicken skin by extracting information from the elevation angle.85,86 For thin tissue specimens, BSHG is attributed to the backscattering of FSHG, whereas in thick tissue, BSHG is less than 1% of FSHG, which yields more informative images than BSHG.87,88 Based on the difference in coherence interaction lengths for FSHG and BSHG, selective SHG imaging has been demonstrated to discriminate collagen fibrils from muscle fibers by BSHG and FSHG imaging, respectively, which suggests the usefulness of backward and forward imaging for different applications.89 As for biomedical imaging, BSHG imaging is a more suitable modality for practical purposes. Despite the enormity of information being extracted using SHG imaging, several limitations, such as the turbid nature of tissue media, which causes strong backscattering, have dwindled its capability in determining authentic tissue structure, function, and dynamics.90 Furthermore, SHG sources such as collagen are anisotropic in optical index refraction and thus render strong effects of birefringence, diattenuation, and polarization cross-talks as the imaging fathom gets deeper, which causes depolarization.22,91,92 This must be taken into account in future work for obtaining information at depths greater than 20 μm. Several birefringence studies on tendons, cartilage, and other tissues such as dentine, dermis, and bones using BSHG imaging have confirmed depth-dependent variation of polarization sensitivity patterns, which limits the depth resolution of SOSM.49 In the current setting of experimental instrumentation, improvement is possible on several fronts to extend the functionality and versatility of biological experiments. One example is the speed of manually adjusted polarization, which can be replaced with an electrooptically automated polarization adjustable microscopic system to shorten the time of data acquisition and to keep samples at homeostasis better. So far, a majority of applications utilizing nonlinear microscopy have focused on skin, eyes, and oral cavities, which are readily accessible by optics. Nonlinear endoscopy has been developed and may be conducive for internal organ treatments, but it has not been demonstrated extensively in research and clinics like its microscopic counterpart. Another area where SHG microscopy can improve is the modulation of laser pulse duration, which is also not extensively investigated, perhaps due to the cost of instrumentation and the complexity of a nonlinear optic setup for manipulating pulse duration. By interrogating the impact of variation in pulse duration on human skin in vivo, Tromberg et al. found that the SHG signal is inversely proportional to the pulse duration in both forward and backward detection.93 With additional development incorporating technologies such as efficiency enhancement of nonlinear processes through spectral pulse shaping-controlled polarization, as well as micro-electro mechanical system (MEMS)-based adaptive optics and microendoscopy, SOSM may find new applications in both clinical and basic research.94 5.ConclusionRecent development of the use of second-order susceptibility analysis as an additional imaging tool has expanded the capabilities of SHG microscopy. Not only can it be applied to solving biomedical problems such as detection of pathological skin tissues, but this approach has also shown promise in basic studies and tissue engineering applications for collagen. Multiphoton imaging of biological media and their constituents has opened up a brand-new page in biomedical and basic science research. Specifically, label-free, nonlinear optical microscopy has found applications in both clinical and research communities, where, in addition to fluorescence imaging, SHG can be used as an image contrast mechanism for imaging of noncentrosymmetric biological tissues. In this study, the technical basis of SOSM has been described in the context of evolutionary development and related scientific experiments. The merits of SOSM, such as contrast enhancement, quantification, and differentiation of different types of tissues, were demonstrated. AcknowledgmentsWe would like to acknowledge the support of the National Science Council (NSC 101-2112-M-002-003-MY3, NSC 99-2221-E-002-008-MY3, NSC 100-2314-B-418-009), National Health Research Institute (NHRI-EX10010041EI), Center of Quantum Science and Engineering (CQSE-10R80914), and National Taiwan University (NTU-101R70804). Partial support was provided by the World Class University (WCU) program of Korea. ReferencesF. HelmchenW. Denk,
“Deep tissue two-photon microscopy,”
Nat. Methods, 2
(12), 932
–940
(2005). http://dx.doi.org/10.1038/nmeth818 1548-7091 Google Scholar
K. SvobodaR. Yasuda,
“Principles of two-photon excitation microscopy and its applications to neuroscience,”
Neuron, 50
(6), 823
–839
(2006). http://dx.doi.org/10.1016/j.neuron.2006.05.019 NERNET 0896-6273 Google Scholar
R. S. Weinstein,
“Innovations in medical imaging and virtual microscopy,”
Hum. Pathol., 36
(4), 317
–319
(2005). http://dx.doi.org/10.1016/j.humpath.2005.03.007 HPCQA4 0046-8177 Google Scholar
A. V. LoparevA. V. KretushevV. P. Tychinskii,
“Coherent phase microscopy: a new method of identification of intracellular structures based on their optical and morphometric parameters,”
Biofizika, 53
(2), 299
–304
(2008). BIOFAI 0006-3029 Google Scholar
A. Lewiset al.,
“Near-field scanning optical microscopy in cell biology,”
Trends Cell. Biol., 9
(2), 70
–73
(1999). http://dx.doi.org/10.1016/S0962-8924(98)01437-8 TCBIEK 0962-8924 Google Scholar
B. W. Leslieet al.,
“Radial fibre proportions in human knee joint menisci—measurement by scanning optical microscopy,”
Acta. Anat., 163
(4), 212
–217
(1998). http://dx.doi.org/10.1159/000046500 ACATA5 0001-5180 Google Scholar
S. Ghoseet al.,
“Rare earth cryptates for the investigation of molecular interactions in vitro and in living cells,”
J. Alloy Compd., 451
(1–2), 35
–37
(2008). http://dx.doi.org/10.1016/j.jallcom.2007.04.054 JALCEU 0925-8388 Google Scholar
C. Odinet al.,
“Collagen and myosin characterization by orientation field second harmonic microscopy,”
Opt. Express, 16
(20), 16151
–16165
(2008). http://dx.doi.org/10.1364/OE.16.016151 OPEXFF 1094-4087 Google Scholar
S. V. Plotnikovet al.,
“Characterization of the myosin-based source for second-harmonic generation from muscle sarcomeres,”
Biophys. J., 90
(2), 693
–703
(2006). http://dx.doi.org/10.1529/biophysj.105.071555 BIOJAU 0006-3495 Google Scholar
P. T. C. Soet al.,
“Two-photon excitation fluorescence microscopy,”
Annu. Rev. Biomed. Eng., 2 399
–429
(2000). http://dx.doi.org/10.1146/annurev.bioeng.2.1.399 ARBEF7 1523-9829 Google Scholar
W. DenkJ. H. StricklerW. W. Webb,
“2-photon laser scanning fluorescence microscopy,”
Science, 248
(4951), 73
–76
(1990). http://dx.doi.org/10.1126/science.2321027 SCIEAS 0036-8075 Google Scholar
W. R. ZipfelR. M. WilliamsW. W. Webb,
“Nonlinear magic: multiphoton microscopy in the biosciences,”
Nat. Biotechnol., 21
(11), 1368
–1376
(2003). http://dx.doi.org/10.1038/nbt899 NABIF9 1087-0156 Google Scholar
K. M. Hansonet al.,
“Two-photon fluorescence lifetime imaging of the skin stratum corneum pH gradient,”
Biophys. J., 83
(3), 1682
–1690
(2002). http://dx.doi.org/10.1016/S0006-3495(02)73936-2 BIOJAU 0006-3495 Google Scholar
E. Shafferet al.,
“Label-free second-harmonic phase imaging of biological specimen by digital holographic microscopy,”
Opt. Lett., 35
(24), 4102
–4104
(2010). http://dx.doi.org/10.1364/OL.35.004102 OPLEDP 0146-9592 Google Scholar
G. S. Filonovet al.,
“Bright and stable near-infrared fluorescent protein for in vivo imaging,”
Nat. Biotechnol., 29
(8), 757
–761
(2011). http://dx.doi.org/10.1038/nbt.1918 NABIF9 1087-0156 Google Scholar
M. D. Cahalanet al.,
“Two-photon tissue imaging: seeing the immune system in a fresh light,”
Nat. Rev. Immunol., 2
(11), 872
–880
(2002). http://dx.doi.org/10.1038/nri935 NRIABX Google Scholar
A. ZoumiA. YehB. J. Tromberg,
“Imaging cells and extracellular matrix in vivo by using second-harmonic generation and two-photon excited fluorescence,”
Proc. Natl. Acad. Sci. USA, 99
(17), 11014
–11019
(2002). http://dx.doi.org/10.1073/pnas.172368799 PNASA6 0027-8424 Google Scholar
W. R. Zipfelet al.,
“Live tissue intrinsic emission microscopy using multiphoton-excited native fluorescence and second harmonic generation,”
Proc. Natl. Acad. Sci. USA, 100
(12), 7075
–7080
(2003). http://dx.doi.org/10.1073/pnas.0832308100 PNASA6 0027-8424 Google Scholar
P. J. CampagnolaL. M. Loew,
“Second-harmonic imaging microscopy for visualizing biomolecular arrays in cells, tissues and organisms,”
Nat. Biotechnol., 21
(11), 1356
–1360
(2003). http://dx.doi.org/10.1038/nbt894 NABIF9 1087-0156 Google Scholar
S. VesunaR. TorresM. J. Levene,
“Multiphoton fluorescence, second harmonic generation, and fluorescence lifetime imaging of whole cleared mouse organs,”
J. Biomed. Opt., 16
(10), 106009
(2011). http://dx.doi.org/10.1117/1.3641992 JBOPFO 1083-3668 Google Scholar
S. W. Chuet al.,
“Selective imaging in second-harmonic-generation microscopy by polarization manipulation,”
Appl. Phys. Lett., 91
(10), 103903
(2007). http://dx.doi.org/10.1063/1.2783207 APPLAB 0003-6951 Google Scholar
S. Brasseletet al.,
“Influence of birefringence on polarization resolved nonlinear microscopy and collagen SHG structural imaging,”
Opt. Express, 18
(14), 14859
–14870
(2010). http://dx.doi.org/10.1364/OE.18.014859 OPEXFF 1094-4087 Google Scholar
P. Stolleret al.,
“Polarization-modulated second harmonic generation in collagen,”
Biophys. J., 82
(6), 3330
–3342
(2002). http://dx.doi.org/10.1016/S0006-3495(02)75673-7 BIOJAU 0006-3495 Google Scholar
W. L. Chenet al.,
“Second harmonic generation chi tensor microscopy for tissue imaging,”
Appl. Phys. Lett., 94
(18), 183902
(2009). http://dx.doi.org/10.1063/1.3132062 APPLAB 0003-6951 Google Scholar
P. J. Suet al.,
“Discrimination of collagen in normal and pathological skin dermis through second-order susceptibility microscopy,”
Opt. Express, 17
(13), 11161
–11171
(2009). http://dx.doi.org/10.1364/OE.17.011161 OPEXFF 1094-4087 Google Scholar
M. WangK. M. ReiserA. Knoesen,
“Spectral moment invariant analysis of disorder in polarization-modulated second-harmonic-generation images obtained from collagen assemblies,”
J. Opt. Soc. Am. A, 24
(11), 3573
–3586
(2007). http://dx.doi.org/10.1364/JOSAA.24.003573 JOAOD6 0740-3232 Google Scholar
P. A. Frankenet al.,
“Generation of optical harmonics,”
Phys. Rev. Lett., 7
(4), 118
–119
(1961). http://dx.doi.org/10.1103/PhysRevLett.7.118 PRLTAO 0031-9007 Google Scholar
P. J. CampagnolaC. Y. Dong,
“Second harmonic generation microscopy: principles and applications to disease diagnosis,”
Laser Photonics Rev., 5
(1), 13
–26
(2011). http://dx.doi.org/10.1002/lpor.v5.1 LPRAB8 1863-8880 Google Scholar
S. FineW. P. Hansen,
“Optical second harmonic generation in biological systems,”
Appl. Opt., 10
(10), 2350
–2353
(1971). http://dx.doi.org/10.1364/AO.10.002350 APOPAI 0003-6935 Google Scholar
J. N. GannawayC. J. R. Sheppard,
“2nd-harmonic imaging in scanning optical microscope,”
Opt. Quant. Electron., 10
(5), 435
–439
(1978). http://dx.doi.org/10.1007/BF00620308 OQELDI 0306-8919 Google Scholar
M. Rehberget al.,
“Label-free 3D visualization of cellular and tissue structures in intact muscle with second and third harmonic generation microscopy,”
PLoS One, 6
(11), e28237
(2011). http://dx.doi.org/10.1371/journal.pone.0028237 1932-6203 Google Scholar
E. Ralstonet al.,
“Detection and imaging of non-contractile inclusions and sarcomeric anomalies in skeletal muscle by second harmonic generation combined with two-photon excited fluorescence,”
J. Struct. Biol., 162
(3), 500
–508
(2008). http://dx.doi.org/10.1016/j.jsb.2008.03.010 JSBIEM 1047-8477 Google Scholar
G. CoxN. MorenoJ. Feijo,
“Second-harmonic imaging of plant polysaccharides,”
J. Biomed. Opt., 10
(2), 024013
(2005). http://dx.doi.org/10.1117/1.1896005 JBOPFO 1083-3668 Google Scholar
M. Rivardet al.,
“The structural origin of second harmonic generation in fascia,”
Biomed. Opt. Express, 2
(1), 26
–36
(2011). http://dx.doi.org/10.1364/BOE.2.000026 BOEICL 2156-7085 Google Scholar
A. H. ReshakV. SarafisR. Heintzmann,
“Second harmonic imaging of chloroplasts using the two-photon laser scanning microscope,”
Micron, 40
(3), 378
–385
(2009). http://dx.doi.org/10.1016/j.micron.2008.09.007 MICNB2 0047-7206 Google Scholar
S. W. Chuet al.,
“In vivo developmental biology study using noninvasive multi-harmonic generation microscopy,”
Opt. Express, 11
(23), 3093
–3099
(2003). http://dx.doi.org/10.1364/OE.11.003093 OPEXFF 1094-4087 Google Scholar
I. FreundM. DeutschA. Sprecher,
“Connective-tissue polarity—optical 2nd-harmonic microscopy, crossed-beam summation, and small-angle scattering in rat-tail tendon,”
Biophys. J., 50
(4), 693
–712
(1986). http://dx.doi.org/10.1016/S0006-3495(86)83510-X BIOJAU 0006-3495 Google Scholar
Y. Guoet al.,
“Second-harmonic tomography of tissues,”
Opt. Lett., 22
(17), 1323
–1325
(1997). http://dx.doi.org/10.1364/OL.22.001323 OPLEDP 0146-9592 Google Scholar
P. J. Campagnolaet al.,
“Second-harmonic imaging microscopy of living cells,”
J. Biomed. Opt., 6
(3), 277
–286
(2001). http://dx.doi.org/10.1117/1.1383294 JBOPFO 1083-3668 Google Scholar
L. Moreauxet al.,
“Membrane imaging by simultaneous second-harmonic generation and two-photon microscopy,”
Opt. Lett., 25
(5), 320
–322
(2000). http://dx.doi.org/10.1364/OL.25.000320 OPLEDP 0146-9592 Google Scholar
V. Ajetiet al.,
“Structural changes in mixed Col I/Col V collagen gels probed by SHG microscopy: implications for probing stromal alterations in human breast cancer,”
Biomed. Opt. Express, 2
(8), 2307
–2316
(2011). http://dx.doi.org/10.1364/BOE.2.002307 BOEICL 2156-7085 Google Scholar
P. P. Provenzanoet al.,
“Collagen reorganization at the tumor-stromal interface facilitates local invasion,”
BMC Med., 4
(1), 38
(2006). http://dx.doi.org/10.1186/1741-7015-4-38 BMMECZ 1741-7015 Google Scholar
O. Nadiarnykhet al.,
“Alterations of the extracellular matrix in ovarian cancer studied by second harmonic generation imaging microscopy,”
BMC Cancer, 10
(94),
(2010). http://dx.doi.org/10.1186/1471-2407-10-94 BCMACL 1471-2407 Google Scholar
R. LacombO. NadiarnykhP. J. Campagnola,
“Quantitative second harmonic generation imaging of the diseased state osteogenesis imperfecta: experiment and simulation,”
Biophys. J., 94
(11), 4504
–4514
(2008). http://dx.doi.org/10.1529/biophysj.107.114405 BIOJAU 0006-3495 Google Scholar
M. Strupleret al.,
“Second harmonic imaging and scoring of collagen in fibrotic tissues,”
Opt. Express, 15
(7), 4054
–4065
(2007). http://dx.doi.org/10.1364/OE.15.004054 OPEXFF 1094-4087 Google Scholar
M. C. OhW. Y. HwangJ. J. Kim,
“Integrated-optic polarization controlling devices using electro-optic polymers,”
Etri. J., 18
(4), 287
–299
(1997). Google Scholar
H. EklundA. RoosS. T. Eng,
“Rotation of laser-beam polarization in acoustooptic devices,”
Opt. Quant. Electron., 7
(2), 73
–79
(1975). http://dx.doi.org/10.1007/BF00631587 OQELDI 0306-8919 Google Scholar
S. Plotnikovet al.,
“Optical clearing for improved contrast in second harmonic generation imaging of skeletal muscle,”
Biophys. J., 90
(1), 328
–339
(2006). http://dx.doi.org/10.1529/biophysj.105.066944 BIOJAU 0006-3495 Google Scholar
J. C. Mansfieldet al.,
“Collagen fiber arrangement in normal and diseased cartilage studied by polarization sensitive nonlinear microscopy,”
J. Biomed. Opt., 13
(4), 044020
(2008). http://dx.doi.org/10.1117/1.2950318 JBOPFO 1083-3668 Google Scholar
V. Nucciottiet al.,
“Probing myosin structural conformation in vivo by second-harmonic generation microscopy,”
Proc. Natl. Acad. Sci. USA, 107
(17), 7763
–7768
(2010). http://dx.doi.org/10.1073/pnas.0914782107 PNASA6 0027-8424 Google Scholar
D. Rouedeet al.,
“Modeling of supramolecular centrosymmetry effect on sarcomeric SHG intensity pattern of skeletal muscles,”
Biophys. J., 101
(2), 494
–503
(2011). http://dx.doi.org/10.1016/j.bpj.2011.05.065 BIOJAU 0006-3495 Google Scholar
E. A. Gibsonet al.,
“Multiphoton microscopy for ophthalmic imaging,”
J. Ophthalmol., 2011 870879
(2011). http://dx.doi.org/10.1155/2011/870879 JOOPA8 2090-004X Google Scholar
A. T. Yehet al.,
“Selective corneal imaging using combined second-harmonic generation and two-photon excited fluorescence,”
Opt. Lett., 27
(23), 2082
–2084
(2002). http://dx.doi.org/10.1364/OL.27.002082 OPLEDP 0146-9592 Google Scholar
S. V. Plotnikovet al.,
“Characterization of the myosin-based source for second-harmonic generation from muscle sarcomeres,”
Biophys. J., 90
(2), 693
–703
(2006). http://dx.doi.org/10.1529/biophysj.105.071555 BIOJAU 0006-3495 Google Scholar
P. J. Suet al.,
“Discrimination of collagen in normal and pathological skin dermis through second-order susceptibility microscopy,”
Opt. Express, 17
(13), 11161
–11171
(2009). http://dx.doi.org/10.1364/OE.17.011161 OPEXFF 1094-4087 Google Scholar
R. W. Boyd, Nonlinear Optics, Academic Press, St Louis, Missouri
(2003). Google Scholar
P. J. Suet al.,
“The discrimination of type I and type II collagen and the label-free imaging of engineered cartilage tissue,”
Biomaterials, 31
(36), 9415
–9421
(2010). http://dx.doi.org/10.1016/j.biomaterials.2010.08.055 BIMADU 0142-9612 Google Scholar
K. M. HansonC. J. Bardeen,
“Application of nonlinear optical microscopy for imaging skin,”
Photochem. Photobiol., 85
(1), 33
–44
(2009). http://dx.doi.org/10.1111/php.2009.85.issue-1 PHCBAP 0031-8655 Google Scholar
J. C. Mackenzi,
“Ordered structure of stratum corneum of mammalian skin,”
Nature, 222
(5196), 881
–882
(1969). http://dx.doi.org/10.1038/222881a0 NATUAS 0028-0836 Google Scholar
S. J. Linet al.,
“Discrimination of basal cell carcinoma from normal dermal stroma by quantitative multiphoton imaging,”
Opt. Lett., 31
(18), 2756
–2758
(2006). http://dx.doi.org/10.1364/OL.31.002756 OPLEDP 0146-9592 Google Scholar
M. RoustitJ. L. Cracowski,
“Non-invasive assessment of skin microvascular function in humans: an insight into methods,”
Microcirculation, 19
(1), 47
–64
(2012). http://dx.doi.org/10.1111/micc.2011.19.issue-1 MCCRD8 0275-4177 Google Scholar
J. H. Leeet al.,
“Noninvasive in vitro and in vivo assessment of epidermal hyperkeratosis and dermal fibrosis in atopic dermatitis,”
J. Biomed. Opt., 14
(1), 014008
(2009). http://dx.doi.org/10.1117/1.3077182 JBOPFO 1083-3668 Google Scholar
B. R. MastersP. T. C. So,
“Confocal microscopy and multi-photon excitation microscopy of human skin in vivo,”
Opt. Express, 8
(1), 2
–10
(2001). http://dx.doi.org/10.1364/OE.8.000002 OPEXFF 1094-4087 Google Scholar
A. N. Baderet al.,
“Fast nonlinear spectral microscopy of in vivo human skin,”
Biomed. Opt. Express, 2
(2), 365
–373
(2011). http://dx.doi.org/10.1364/BOE.2.000365 BOEICL 2156-7085 Google Scholar
M. J. Koehleret al.,
“In vivo assessment of human skin aging by multiphoton laser scanning tomography,”
Opt. Lett., 31
(19), 2879
–2881
(2006). http://dx.doi.org/10.1364/OL.31.002879 OPLEDP 0146-9592 Google Scholar
K. Koniget al.,
“Clinical optical coherence tomography combined with multiphoton tomography of patients with skin diseases,”
J. Biophotonics, 2
(6–7), 389
–397
(2009). http://dx.doi.org/10.1002/jbio.v2:6/7 JBOIBX 1864-063X Google Scholar
S. J. Linet al.,
“Discrimination of basal cell carcinoma from normal dermal stroma by quantitative multiphoton imaging,”
Opt. Lett., 31
(18), 2756
–2758
(2006). http://dx.doi.org/10.1364/OL.31.002756 OPLEDP 0146-9592 Google Scholar
S. Psilodimitrakopouloset al.,
“In vivo, pixel-resolution mapping of thick filaments’ orientation in nonfibrilar muscle using polarization-sensitive second harmonic generation microscopy,”
J. Biomed. Opt., 14
(1), 014001
(2009). http://dx.doi.org/10.1117/1.3059627 JBOPFO 1083-3668 Google Scholar
S. Psilodimitrakopouloset al.,
“Quantitative discrimination between endogenous SHG sources in mammalian tissue, based on their polarization response,”
Opt. Express, 17
(12), 10168
–10176
(2009). http://dx.doi.org/10.1364/OE.17.010168 OPEXFF 1094-4087 Google Scholar
R. Cicchiet al.,
“Scoring of collagen organization in healthy and diseased human dermis by multiphoton microscopy,”
J. Biophotonics, 3
(1–2), 34
–43
(2010). http://dx.doi.org/10.1002/jbio.200910062 JBOIBX 1864-063X Google Scholar
I. Amat-Roldanet al.,
“Fast image analysis in polarization SHG microscopy.,”
Opt. Express, 18
(16), 17209
–17219
(2010). http://dx.doi.org/10.1364/OE.18.017209 OPEXFF 1094-4087 Google Scholar
D. A. Kleinman,
“Nonlinear dielectric polarization in optical media,”
Phys. Rev., 126
(6), 1977
–1978
(1962). http://dx.doi.org/10.1103/PhysRev.126.1977 PHRVAO 0031-899X Google Scholar
S. W. Chuet al.,
“Studies of tensors in submicron-scaled bio-tissues by polarization harmonics optical microscopy,”
Biophys. J., 86
(6), 3914
–3922
(2004). http://dx.doi.org/10.1529/biophysj.103.034595 BIOJAU 0006-3495 Google Scholar
C. P. PfefferB. R. OlsenF. Legare,
“Second harmonic generation imaging of fascia within thick tissue block,”
Opt. Express, 15
(12), 7296
–7302
(2007). http://dx.doi.org/10.1364/OE.15.007296 OPEXFF 1094-4087 Google Scholar
A. M. Penaet al.,
“Chiroptical effects in the second harmonic signal of collagens I and IV,”
J. Am. Chem. Soc., 127
(29), 10314
–10322
(2005). http://dx.doi.org/10.1021/ja0520969 JACSAT 0002-7863 Google Scholar
P. J. Campagnolaet al.,
“Three-dimensional high-resolution second-harmonic generation imaging of endogenous structural proteins in biological tissues,”
Biophys. J., 82
(1 Pt 1), 493
–508
(2002). http://dx.doi.org/10.1016/S0006-3495(02)75414-3 BIOJAU 0006-3495 Google Scholar
F. TiahoG. RecherD. Rouede,
“Estimation of helical angles of myosin and collagen by second harmonic generation imaging microscopy,”
Opt. Express, 15
(19), 12286
–12295
(2007). http://dx.doi.org/10.1364/OE.15.012286 OPEXFF 1094-4087 Google Scholar
M. Strupleret al.,
“Second harmonic imaging and scoring of collagen in fibrotic tissues,”
Opt. Express, 15
(7), 4054
–4065
(2007). http://dx.doi.org/10.1364/OE.15.004054 OPEXFF 1094-4087 Google Scholar
F. TiahoG. RecherD. Rouede,
“Estimation of helical angles of myosin and collagen by second harmonic generation imaging microscopy,”
Opt. Express, 15
(19), 12286
–12295
(2007). http://dx.doi.org/10.1364/OE.15.012286 OPEXFF 1094-4087 Google Scholar
A. Deniset-Besseauet al.,
“Measurement of the second-order hyperpolarizability of the collagen triple helix and determination of its physical origin,”
J. Phys. Chem. B, 113
(40), 13437
–13445
(2009). http://dx.doi.org/10.1021/jp9046837 JPCBFK 1520-6106 Google Scholar
I. Rocha-Mendozaet al.,
“Sum frequency vibrational spectroscopy: the molecular origins of the optical second-order nonlinearity of collagen,”
Biophys. J., 93
(12), 4433
–4444
(2007). http://dx.doi.org/10.1529/biophysj.107.111047 BIOJAU 0006-3495 Google Scholar
P. J. Suet al.,
“Determination of collagen nanostructure from second-order susceptibility tensor analysis,”
Biophys. J., 100
(8), 2053
–2062
(2011). http://dx.doi.org/10.1016/j.bpj.2011.02.015 BIOJAU 0006-3495 Google Scholar
G. Latouret al.,
“In vivo structural imaging of the cornea by polarization-resolved second harmonic microscopy,”
Biomed. Opt. Express, 3
(1), 1
–15
(2012). http://dx.doi.org/10.1364/BOE.3.000001 BOEICL 2156-7085 Google Scholar
C. S. Liaoet al.,
“Decrimping: the first stage of collagen thermal denaturation unraveled by in situ second-harmonic-generation imaging,”
Appl. Phys. Lett., 98
(15), 153703
(2011). http://dx.doi.org/10.1063/1.3578191 APPLAB 0003-6951 Google Scholar
Z. Y. Zhuoet al.,
“Second harmonic generation imaging—a new method for unraveling molecular information of starch,”
J. Struct. Biol., 171
(1), 88
–94
(2010). http://dx.doi.org/10.1016/j.jsb.2010.02.020 JSBIEM 1047-8477 Google Scholar
V. A. Hovhannisyanet al.,
“Spatial orientation mapping of fibers using polarization-sensitive second harmonic generation microscopy,”
J. Biophotonics,
(2012). http://dx.doi.org/10.1002/jbio.201100123 JBOIBX 1864-063X Google Scholar
F. LegareC. PfefferB. R. Olsen,
“The role of backscattering in SHG tissue imaging,”
Biophys. J., 93
(4), 1312
–1320
(2007). http://dx.doi.org/10.1529/biophysj.106.100586 BIOJAU 0006-3495 Google Scholar
J. MertzL. Moreaux,
“Second-harmonic generation by focused excitation of inhomogeneously distributed scatterers,”
Optic. Comm., 196
(1–6), 325
–330
(2001). http://dx.doi.org/10.1016/S0030-4018(01)01403-1 OPCOB8 0030-4018 Google Scholar
S. W. Chuet al.,
“Selective imaging in second-harmonic-generation microscopy with anisotropic radiation,”
J. Biomed. Opt., 14
(1), 010504
(2009). http://dx.doi.org/10.1117/1.3080722 JBOPFO 1083-3668 Google Scholar
I. S. SaidiS. L. JacquesF. K. Tittel,
“Mie and Rayleigh modeling of visible-light scattering in neonatal skin,”
Appl. Opt., 34
(31), 7410
–7418
(1995). http://dx.doi.org/10.1364/AO.34.007410 APOPAI 0003-6935 Google Scholar
I. GusachenkoG. LatourM. C. Schanne-Klein,
“Polarization-resolved second harmonic microscopy in anisotropic thick tissues,”
Opt. Express, 18
(18), 19339
–19352
(2010). http://dx.doi.org/10.1364/OE.18.019339 OPEXFF 1094-4087 Google Scholar
D. Ait-Belkacemet al.,
“Influence of birefringence on polarization resolved nonlinear microscopy and collagen SHG structural imaging,”
Opt. Express, 18
(14), 14859
–14870
(2010). http://dx.doi.org/10.1364/OE.18.014859 OPEXFF 1094-4087 Google Scholar
S. Tanget al.,
“Effect of pulse duration on two-photon excited fluorescence and second harmonic generation in nonlinear optical microscopy,”
J. Biomed. Opt., 11
(2), 020501
(2006). http://dx.doi.org/10.1117/1.2177676 JBOPFO 1083-3668 Google Scholar
P. Schonet al.,
“Polarization and phase pulse shaping applied to structural contrast in nonlinear microscopy imaging,”
Phys. Rev. A, 81
(1), 013809
(2010). http://dx.doi.org/10.1103/PhysRevA.81.013809 PLRAAN 1050-2947 Google Scholar
|


