|
|
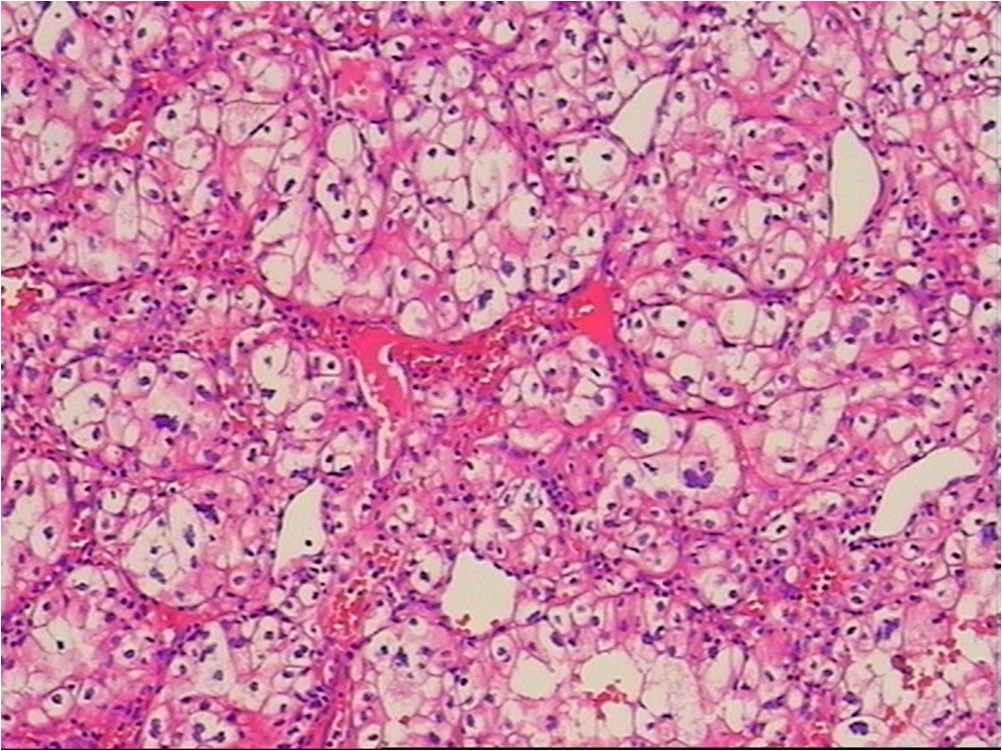
1.IntroductionRenal tumors, whose incidence ranked second only to bladder tumors in the urogenital system cancers, is one of the most common cancers in humans.1 According to statistics, the death rate of renal cell cancer has reached about 40%.2 The same to other cancers, the nature of a renal tumor is hardly predictable.3 At present, the detection methods of renal tumors, including hematuria detection,4 X-ray angiography,4 ultrasound scan,5 computed tomography (CT) scan,5 and functional optical coherence tomography6 are unable to respond to the molecular change, and easily lead to the diagnostic mistakes. A clear and new predictive tool is urgently needed to characterize the renal tumor. In this study, we use confocal micro-Raman spectroscopy to study the molecular changes of renal tumors, and distinguish the normal and cancerous renal tissues based on Raman spectroscopy. Confocal micro-Raman spectroscopy, which depends on polarizability change of an oscillating molecule, has proven extremely versatile and has led to a vast array of applications across the disciplines of chemistry, physics, biology, biomedicine, engineering, and archaeology.7–9 With an insensitivity to the presence of water, Raman spectroscopy is a particularly attractive technique for life sciences. In addition to these, compared with other cancer diagnosis technologies including second harmonic generation,10,11 Fourier transform infrared spectroscopy (FTIR),12 and multiphoton microscopy,13 Raman spectroscopy requires simple sample preparation and contains abundant information. At present, Raman spectroscopy has been used to detect many tumors in colonic, bladder, and neck tissues.14–16 However, there are only a minority of reports about the Raman study on renal tumors. To our knowledge, Joshi et al.17 detected the change of genetically altered renal cells (human embryonic kidney cells transfected with green fluorescence protein) by Raman spectroscopy, but this experiment did not mention the composition change of renal tumor tissue (RTT), and it also did not detect the true renal tumor cell. Bensalah et al.18 characterized the renal tumor based on Raman spectroscopy, which was equipped with fiber optic magnetic resonance (MR) probe with a , noncontact objective. With the strong fluorescence background in their research, many important RTT Raman peaks were covered. Meanwhile, this study did not give any details of the diseased tissue. Recently, Fleureau et al.19 employed Raman spectroscopy to assess renal tumors at surgery. Results show the interest of Raman spectroscopy to evaluate kidney cancer and suggested the potential of this technique as a surgical assistance. In our study, a confocal micro-Raman spectroscopy with high resolution and spatial filtering ability is used to detect the molecular variations in human RTT. The normal renal tissue (NRT) is taken for Raman scanning to compare with the Raman spectra of RTT. With the help of high-quality, confocal micro-Raman spectroscopy, the low fluorescence background and highly sensitive Raman spectra of RTT and NRT are obtained, which give us more details about molecule variations in renal tumors. 2.Materials and Methods2.1.Sample PreparationTissues samples were obtained from surgical specimens of renal tumor patients. Fresh RTT and NRT were immediately stored in a bottle of liquid nitrogen until Raman spectroscopy measurement. A total of 25 patients (15 male, 10 female; age 42 to 68, mean 54.6 years) diagnosed with a renal tumor by an experienced clinical pathologist, were provided by Sun Yat-Sen Memorial, Sun Yat-Sen University, and Nanfang Hospital, Guangzhou, China. Figure 1 is a typical male patient with a renal tumor in our experiment (provided by Nanfang Hospital). Figure 1 is a section of a histology image stained by hematoxylin-eosin (H&E staining), which is a common staining method in clinical pathology.20 In Fig. 1, the renal cells have a rounded or polygonal shape and abundant clear or granular cytoplasm, which contains glycogen and lipids. The nuclei are small, round, deeply stained, and located on the edge or center of the cell. Informed consent was obtained from all subjects, and the study was approved by the medical ethics committee of Nanfang Hospital, Southern Medical University. Five-millimeter square tissue samples without any slicing were placed on a silicon slice for Raman scanning; there are no extra Raman peaks in the region of 700 to on the silicon slice. In order to avoid the dehydration caused by the dry environment in a Raman laboratory, and ensure the focus position did not change in the testing process, samples were infiltrated by normal saline. The concentration of saline solution used was 0.9% (weight/volume, ), which is an osmotic solution with the human tissue. 2.2.Confocal Micro-Raman SpectroscopyConfocal micro-Raman spectroscopy, which is a nondestructive technique, provides information about the molecular composition, molecular structures, and molecular interactions in cells and tissues. Raman measurements were performed using a Renishaw (New Mills, UK) inVia confocal micro-Raman spectroscopy equipped with a 785-nm laser. A Leica microscope objective (DM2500) of magnification was used to focus the incident laser light on the solution in a capillary tube approximately 1 mm in diameter, and to collect the backscattered Raman light with a detection range of 700 to . The laser power focused on sample was , and the acquisition time of each spectrum was 30 s. The slit-width we used is about 50 um. All data were collected under the same conditions. Before Raman scanning, the instrument is calibrated by silicon at the band. 2.3.Data AnalysisFor each sample, at least 25 Raman spectra are obtained. In order to compare the related spectra change, the band intensity at (assigned to phenylalanine) is used to normalize the spectra. The final Raman spectrum of each sample is baseline corrected by the software R 2.8.1, which is provided by Renishaw, and smoothed, normalized, and averaged by Origin Pro 7.5 (OriginLab Corp., Northampton, MA,).21–23 Statistical Package for the Social Science (SPSS) was used for statistical analysis in this study (SPSS 17.0, SPSS Inc). The spectra recorded from RTT and NRT are statistically analyzed by principal component analysis (PCA). PCA is oriented toward modeling a variance-covariance structure of a data matrix from which the eigenvalues, corresponding to principal components, are extracted.24 Each principal component (PC) is a linear combination of the independent wavenumber variables . For example: The first PC accounts for the greatest variance which corresponds to the largest eigenvalue. The second PC is orthogonal to the first, with each successive PC being both orthogonal to all those preceding, and accounting for a decreasing proportion of the variance. In this paper, we chose the first three PC which has accounted for more than 75% of the accumulative total contribution for analysis. 3.Results3.1.Raman Spectrum of Normal Renal TissueA typical Raman spectrum of normal renal tissue is shown in Fig. 2. The primary Raman peaks of NRT are observed at 831, 855, 936, 1003, 1340, 1450, and . The doublet of fermi-resonance caused by breathing vibration of a tyrosine hydroxyphenyl ring and in-plane bending vibration of octave are observed at 831 and . Raman peak of is assigned to stretching vibration and Raman band at belong to phenylalanine. For tryptophan, the Raman peak locates at . The peak at corresponded to () deformation vibration of proteins, and a peak of is assigned to amide I. Complete Raman frequency assignments of NRT spectrum are presented in Table 1.25,26 Fig. 2Raman spectrum of normal renal tissue (NRT), which were baseline corrected, averaged, smoothed, and normalized. 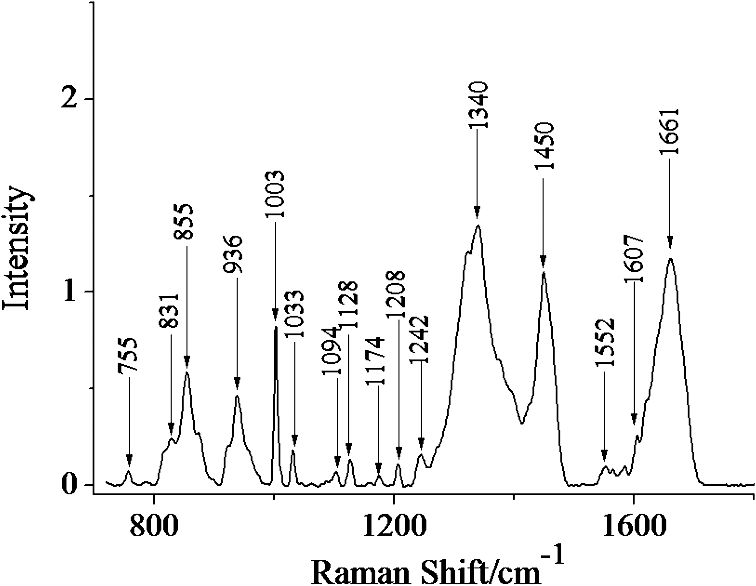 Table 1Raman frequencies and assignments of NRT Raman spectrum
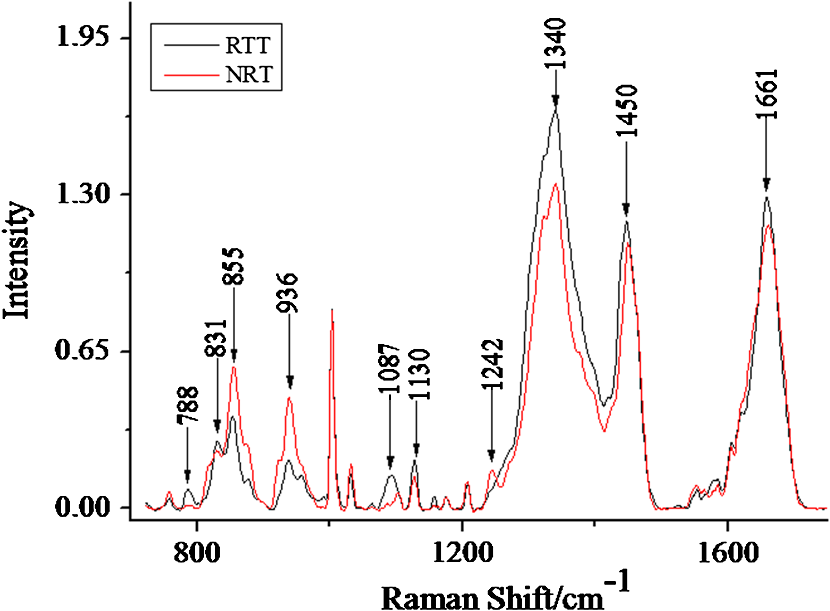
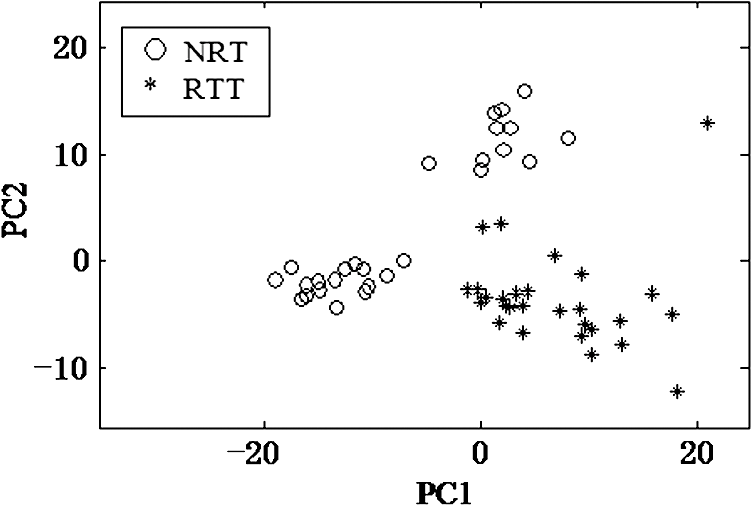
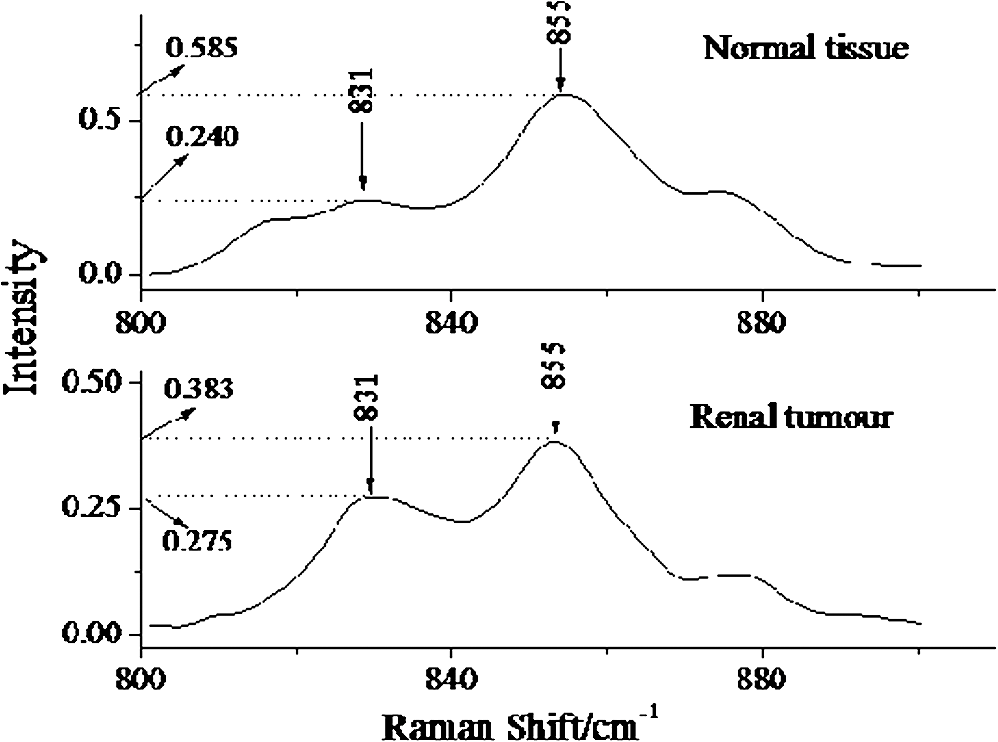
Note: v: stretching vibration; δ: bending vibration. 3.2.Raman Spectrum of Renal Tumor TissueAll the Raman spectra of RTT have been baseline corrected, smoothed, normalized, and averaged a final spectrum (Fig. 3). In the low region (800 to ), compared with NRT, the Raman intensity of RTT enhance significantly. These enhanced Raman peaks include 831, 784, 1087, and . As the intensity of Raman peaks present the content of molecule composition, the intensive peaks at 784 and show an increase content of , which is related to nucleic acid.27 At the same time, the intensive band shows a higher content of stretching vibration. In addition to low region, intensive Raman peaks also can be found at 1340, 1450, and in the RTT spectrum, which indicate the increased content of protein and collagen. Compared with the Raman spectrum of NRT, peaks at 851, 1242, and , which belong to fermi-resonance of tyrosine, amide III, and the bond, respectively, revealing a decreased tendency. 3.3.Principal Component AnalysisIn this study, PCA is used to distinguish the Raman spectra of RTT and NRT. Result is shown in Fig. 4, which depicts the plot between scores of the first principal component (PC1) and the second principal component (PC2). Twenty-seven Raman spectra of NRT and 28 Raman spectra of RTT are used for PCA. The plot shows that almost all the Raman spectra of RTT locate at bottom left. And the Raman spectra of NRT are at the opposite in Fig. 4. The analysis result shows a good classification compared with other method.18 4.DiscussionDespite all the progress made over the last decades, cancer remains a leading cause of death and its natural course is difficult to predict in a single patient. Fortunately, Raman spectroscopy can provide a total simultaneous chemical analysis (on lipid, protein, and nucleic acid), and the change that display on Raman spectra can be used as the marks of tumors. For the specificity of tumor cells, the tumor tissue has many differences from the normal one such as shape, organizational structure, and tissue constituents. Compared with the normal tissue, the tumor tissue contains more protein, collagen, mucus, and nucleic acid. From Fig. 3, we see the most dramatic change in the Raman spectrum of RTT are observed at 788 and , which originate from symmetric () and asymmetric () stretching bands of phosphodiester groups.28 In the NRT Raman spectrum, there is no obvious Raman peak at . While in the spectrum of RTT, this peak has a notable increase. Meanwhile, the peak of also increases sharply in RTT spectrum. These results agree well with the findings of Wong et al.28,29 and Rigas et al.30 In the RTT, most groups become hydrogen bonded, and intermolecular packing among neighboring groups becomes closer. These results point out that nucleic acids are mainly responsible for the observed change in and bands.28–30 Since much information is concerned with structural change of nucleic acids in tumor tissue, peaks at 788 and can be used as the RTT markers for Raman detecting. Moreover, study of 788 and is potentially significant for understanding other cancers; we seek to confirm the molecular variations origin of the phosphodiester stretching modes in the Raman spectra of tissues and cells. In addition to and groups, the Raman bands at 831 and , which correspond to tyrosine, also obviously change. In NRT spectrum, the peak at is inconspicuous. However, there is an obvious peak at this Raman shift in RTT, but another peak belongs to tyrosine which appears at , which shows a different tendency (Fig. 5). Because the ratio is relevant to the environment of tyrosine residue, it is used to estimate the conformational change of tyrosine in tumor tissue. When bands, which locate in benzene rings of tyrosine, combine with , we regard the tyrosine conformation as “exposure” according to previous research.31 If these bands combine with bands which locate in the protein residue, the tyrosine conformation is said to be “buried”. For the “exposure” conformation, the interval of ratio is between 0.3 and 1.5. And this ratio ranges from 1.7 to 2.5 for the “buried” conformation. In our study, the corresponding statistical analyses (two independent sample tests, SPSS 17.0, SPSS Inc) show that the of NRT is and that of RTT is . This proves that in NRT, most of the tyrosine residue in proteins are “buried,” which is good for keeping the stability of protein space structure. While for RTT, this conformation turns into “exposure.” This indicates that some of the bands had combined with bands, which makes the tyrosine have a tendency to become “exposure” in the RTT compared with NRT. 5.ConclusionConfocal micro-Raman spectroscopy provides important biochemical information because each molecule has its own vibration pattern that can be served as a “Raman biomarker.” Furthermore, these vibrations are usually sensitive to the structure of the molecular environment and can therefore reflect structural change. Our results confirm that Renal tumors can be characterized by a higher content of . The Raman peaks at 788 and are used to test the content of in the RTT, and results show an obvious increase of Raman intensity. In addition, compared with NRT, tyrosine residue conformation in RTT turned from “buried” to “exposure”. The ratio is used as a maker of conformation variation. In this study, this ratio turned from in NRT to in RTT, which indicates more “exposure” tyrosine in the RTT than NRT. Also, confocal micro-Raman spectroscopy can be regarded as a new tool to detect renal tumors. We use PCA to test the ability of confocal micro-Raman spectroscopy to distinguish the RTT and NRT. The analysis result shows a good classification, which indicates the feasibility of confocal micro-Raman spectroscopy to provide a better understanding on molecule variations in renal tumor. AcknowledgmentsThis work was supported by the Foundation for the Construction of Strong Province in Traditional Chinese Medicine from Administration Department of Traditional Chinese Medicine of Guangdong Province (No. 20112179), National Natural Science Foundation of China (No. 61275187), Natural Science Foundation of Guangdong Province (No. 9251063101000009), and Specialized Research Fund for the Doctoral Program of Higher Education of China (No. 20114407110001). ReferencesX. NanY. Zhang,
“New advance in diagnosis and treatment for renal cell carcinoma patiants with thrombus in the renal vein and inferior vena cava,”
J. Mod. Urol., 16
(4), 290
–298
(2011). XMWZBF 1009-8291 Google Scholar
R. J. SwainG. JellM. A. Stevens,
“Non-invasive analysis of cell cycle dynamics in single living cells with Raman micro-spectroscopy,”
J. Cell. Biochem., 104
(4), 1427
–1438
(2008). http://dx.doi.org/10.1002/jcb.v104:4 JCEBD5 0730-2312 Google Scholar
C. Matthäuset al.,
“New ways of imaging uptake and intracellular fate of liposomal drug carrier systems inside individual cells, based on Raman microscopy,”
Mol. Pharm., 5
(2), 287
–293
(2008). http://dx.doi.org/10.1021/mp7001158 69MJIU Google Scholar
G. Mickischet al.,
“Guidelines on renal cell cancer,”
Eur. Urol., 40
(3), 252
–255
(2001). http://dx.doi.org/10.1159/000049783 EUURAV 0302-2838 Google Scholar
K. ErichM. D. Lang,
“Comparison of dynamic and conventional computed tomography, angiography, and ultrasonography in the staging of renal cell carcinoma,”
Cancer, 54
(10), 2205
–2214
(1984). http://dx.doi.org/10.1002/(ISSN)1097-0142 CANCAR 1097-0142 Google Scholar
J. Wierwilleet al.,
“In vivo, label-free, three-dimensional quantitative imaging of kidney microcirculation using Doppler optical coherence tomography,”
Lab. Invest., 91
(11), 1596
–1604
(2011). Google Scholar
C. Krafftet al.,
“Methodology for fiber-optic Raman mapping and FTIR imaging of metastases in mouse brains,”
Anal. Bioanal. Chem., 389
(4), 1133
–1142
(2007). http://dx.doi.org/10.1007/s00216-007-1453-2 ABCNBP 1618-2642 Google Scholar
J. Linget al.,
“Direct Raman imaging techniques for study of the subcellular distribution of a drug,”
Appl. Opt., 41
(28), 6006
–6017
(2002). http://dx.doi.org/10.1364/AO.41.006006 APOPAI 0003-6935 Google Scholar
A. Beljebbaret al.,
“Identification of Raman spectroscopic markers for the characterization of normal and adenocarcinomatous colonic tissues,”
Critical Rev. Oncol./Hematol., 72
(3), 255
–264
(2009). http://dx.doi.org/10.1016/j.critrevonc.2009.09.004 CCRHEC Google Scholar
S. M. Zhuoet al.,
“Quantitative biomarkers of colonic dysplasia based on intrinsic second-harmonic generation signal,”
J. Biomed. Opt., 16
(12), 120501
(2011). http://dx.doi.org/10.1117/1.3659715 JBOPFO 1083-3668 Google Scholar
S. M. Zhuoet al.,
“Quantitatively linking collagen alteration and epithelial tumor progression by second harmonic generation microscopy,”
Appl. Phys. Lett., 96
(21), 213704
(2010). http://dx.doi.org/10.1063/1.3441337 APPLAB 0003-6951 Google Scholar
A. Sadeet al.,
“Celecoxib reduces fluidity and decreases metastatic potential of colon cancer cell lines irrespective of COX-2 expression,”
Biosci. Rep., 32
(1), 35
–44
(2012). http://dx.doi.org/10.1042/BSR20100149 BRPTDT 0144-8463 Google Scholar
S. M. Zhuoet al.,
“Label-free monitoring of colonic cancer progression using multiphoton microscopy,”
Biomed. Opt. Exp., 2
(3), 615
–619
(2011). http://dx.doi.org/10.1364/BOE.2.000615 BOEICL 2156-7085 Google Scholar
P. C. Lopeset al.,
“Discriminating adenocarcinoma from normal colonic mucosa through deconvolution of Raman spectra,”
J. Biomed. Opt., 16
(12), 127001
(2011). http://dx.doi.org/10.1117/1.3658756 JBOPFO 1083-3668 Google Scholar
B. W. de Jonget al.,
“Discrimination between nontumor bladder tissue and tumor by Raman spectroscopy,”
Anal. Chem., 78
(22), 7761
–7769
(2006). http://dx.doi.org/10.1021/ac061417b Google Scholar
A. T. Harriset al.,
“Raman spectroscopy in head and neck cancer,”
Head. Neck. Oncol., 2
(26), 1
–6
(2010). Google Scholar
J. Joshiet al.,
“Raman spectroscopic study of a genetically altered kidney cell,”
Proc. SPIE, 6853 85304
(2008). http://dx.doi.org/10.1117/12.760317 Google Scholar
K. Bensalahet al.,
“Raman spectroscopy: a novel experimental approach to evaluating renal tumours,”
Eur. Urol., 58
(4), 602
–608
(2010). http://dx.doi.org/10.1016/j.eururo.2010.06.002 EUURAV 0302-2838 Google Scholar
J. Fleureauet al.,
“Characterization of renal tumours based on Raman spectra classification,”
Expert Syst. Appl., 38
(11), 14301
–14306
(2011). http://dx.doi.org/10.1016/j.eswa.2011.05.092 ESAPEH 0957-4174 Google Scholar
E. JörundssonJ. H. LumsdenR. M. Jacobs,
“Rapid staining techniques in cytopathology: a review and comparison of modified protocols for Hematoxylin and Eosin, Papanicolaou and Romanowsky Stains,”
Vet. Clin. Pathol., 28
(3), 100
–108
(1999). http://dx.doi.org/10.1111/j.1939-165X.1999.tb01057.x VCPADJ Google Scholar
J. Zhaoet al.,
“Automated autofluorescence background subtraction algorithm for biomedical raman spectroscopy,”
Appl. Spectrosc., 61
(11), 1225
–1232
(2007). http://dx.doi.org/10.1366/000370207782597003 APSPA4 0003-7028 Google Scholar
Z. ZhangS. ChenY. Liang,
“Baseline correction using adaptive iteratively reweighted penalized least squares,”
Analyst, 135
(5), 1138
–1146
(2010). http://dx.doi.org/10.1039/b922045c ANLYAG 0365-4885 Google Scholar
Z. Zhanget al.,
“An intelligent background-correction algorithm for highly fluorescent samples in Raman spectroscopy,”
J. Raman Spectrosc., 41
(6), 659
–669
(2010). http://dx.doi.org/10.1002/jrs.v41:6 JRSPAF 0377-0486 Google Scholar
B. R. Woodet al.,
“Resonance Raman spectroscopy of red blood cells using near infrared excitation,”
Anal. Bioanal. Chem., 387
(5), 1691
–1703
(2007). http://dx.doi.org/10.1007/s00216-006-0881-8 ABCNBP 1618-2642 Google Scholar
N. T. YuE. J. East,
“Laser Raman spectroscopic studies of ocular lens and its isolated protein fractions,”
J. Biol. Chem., 250
(6), 2196
–2202
(1975). JBCHA3 0021-9258 Google Scholar
M. V. P. Chowdaryet al.,
“Biochemical correlation of Raman spectra of normal, benign and malignant breast tissues: a spectral deconvolution study,”
Biopolymers, 91
(7), 539
–546
(2009). http://dx.doi.org/10.1002/bip.v91:7 BIPMAA 0006-3525 Google Scholar
C. S. PottenM. Loeffler,
“Stem cells: attributes, cycles, spirals, pitfalls and uncertainties. Lessons for and from the crypt,”
Development, 110
(4), 1001
–1020
(1990). DEVPED 0950-1991 Google Scholar
P. T. T. WongE. D. PapavassiliouB. Rigas,
“Phosphodiester stretching bands in the infrared spectra of human tissues and cultured cells,”
Appl. Spectrosc., 45
(9), 1563
–1567
(1991). http://dx.doi.org/10.1366/0003702914335580 APSPA4 0003-7028 Google Scholar
P. T. T. WongR. Basil,
“Infrared spectra of microtome sections of human colon tissues,”
Appl. Spectrosc., 44
(10), 1715
–1718
(1990). http://dx.doi.org/10.1366/0003702904417481 APSPA4 0003-7028 Google Scholar
B. Rigaset al.,
“Human colorectal cancers display abnormal Fourier-transform infrared spectra,”
Proc. Natl. Acad. Sci., 87
(20), 8140
–8144
(1990). http://dx.doi.org/10.1073/pnas.87.20.8140 PNASA6 0027-8424 Google Scholar
J. MoW. ZhengZ. Huang,
“Fiber-optic Raman probe couples ball lens for depth-selected Raman measurements of epithelial tissue,”
Biomed. Opt. Express, 1
(1), 17
–30
(2010). http://dx.doi.org/10.1364/BOE.1.000017 BOEICL 2156-7085 Google Scholar
|